Recommended

Recommended
More Related Content
Similar to Structural and Conformational Properties of PEO in Silica Nanocomposites
Similar to Structural and Conformational Properties of PEO in Silica Nanocomposites (20)
Recently uploaded
Recently uploaded (20)
Structural and Conformational Properties of PEO in Silica Nanocomposites
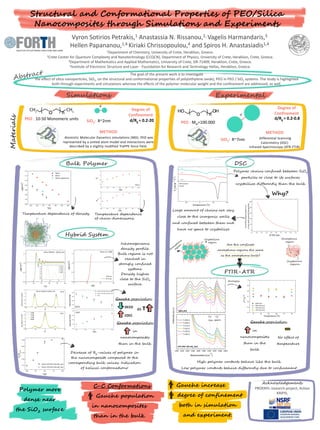
- 1. in nanocomposites than in the bulk Vyron Sotirios Petrakis,1 Anastassia N. Rissanou,2, Vagelis Harmandaris,3 Hellen Papananou,1,4 Kiriaki Chrissopoulou,4 and Spiros H. Anastasiadis1,4 1Department of Chemistry, University of Crete, Heraklion, Greece. 2Crete Center for Quantum Complexity and Nanotechnology (CCQCN), Department of Physics, University of Crete, Heraklion, Crete, Greece. 3Department of Mathematics and Applied Mathematics, University of Crete, GR-71409, Heraklion, Crete, Greece. 4Institute of Electronic Structure and Laser - Foundation for Research and Technology Hellas, Heraklion, Greece. The goal of the present work is to investigate the effect of silica nanoparticles, SiO2, on the structural and conformational properties of poly(ethylene oxide), PEO in PEO / SiO2 systems. The study is highlighted both through experiments and simulations whereas the effects of the polymer molecular weight and the confinement are addressed, as well. Acknowledgements PROENYL research project, Action KRIPIS, Structural and Conformational Properties of PEO/Silica Nanocomposites through Simulations and Experiments Simulations PEO : 10-50 Monomeric units PEO : Mw=100.000SiO2: R~2nm SiO2: R~7nm METHOD Differential Scanning Calorimetry (DSC) Infrared Spectroscopy (ATR-FTIR) 280 300 320 340 360 380 400 1.00 1.02 1.04 1.06 1.08 1.10 1.12 1.14 10mer 50mer 10mer experiment (g/cm 3 ) T(K) Materials 280 300 320 340 360 380 400 15 16 17 18 50mer Ree T(K) Rg T(K) 280 300 320 340 360 380 400 35 40 45 Bulk Polymer Hybrid System 10 20 30 40 50 60 0.0 0.5 1.0 1.5 (gr/cm 3 ) r(Å) 10mer 95%PEO - 5%SiO2 (wt) 20 25 30 0.96 1.04 1.12 1.20 1.28 1.36 1.44 1.52 T=285K T=300K T=318K T=330K T=400K 10 20 30 40 0.0 0.5 1.0 1.5 50mer at T=400K 30 % wt 57 % wt (gr/cm 3 ) r(Å) -200 -100 0 100 200 0.0 0.4 0.8 1.2 1.6 2.0 distributionofOCCO o 50mer 43%PEO-57%SiO2 (wt) OCCO -200 -100 0 100 200 0.0 0.4 0.8 1.2 1.6 2.0 COCC330K 350K 370K 400K distributionofCOCC o 0.78 0.81 0.84 0.87 0.90 50mer 67% PEO-33% SiO2 (wt) 50mer 57% PEO-43% SiO2 (wt) Bulk Gauche/Total 300 325 350 375 400 0.15 0.18 0.21 0.24 0.27 COCC T(K) Gauche/Total OCCO 300 325 350 375 400 0.87 0.90 0.93 0.96 0.99 50mer 67% PEO-33% SiO2 (wt) 50mer 57% PEO-43% SiO2 (wt) Rg /Rgbulk T(K) Inhomogeneous density profile. Bulk regime is not reached in strongly confined systems. Density higher close to the SiO2 surface. Gauche population OCCO COCC as T Gauche population 1200 1220 1240 1260 1280 1300 1320 1340 1360 1380 100% PEO T=393 K T=383 K T=373 K T=363 K T=353 K T=343 K Intensity(a.u.) 27% PEO-73% SiO2 (wt) C-C trans C-C gauche Wavenumbers (cm -1 ) -50 0 50 100 PEO Content % (wt) 18% Temperature ( o C) Cp (calgr -1o C -1 ) 100% 27% Polymer chains confined between SiO2 particles or close to its surfaces crystallize differently than the bulk 0.1 0.2 0.3 0.4 0.5 0.6 0.7 0.8 0.9 1.0 0 20 40 60 80 100 %ofPEOvolumewhichisin a1nmshellaroundtheparticle PEO (wt) Why? Large amount of chains are very close to the inorganic walls and confined between them and have no space to crystallize Crystalline region Analysis 70 80 90 100 110 120 0.4 0.5 0.6 0.7 0.8 0.9 1.0 Temperature ( o C) I gauce /I total 100% PEO 86% PEO (vol) 43% PEO (vol) 31% PEO (vol) Gauche population in nanocomposites than in the bulk No effect of temperature DSC FTIR-ATR High polymer contents behave like the bulk Low polymer contents behave differently due to confinement Crystalline regions Amorphous region Are the confined amorphous regions the same as the amorphous bulk? Polymer more dense near the SiO2 surface C-C Conformations Gauche population in nanocomposites than in the bulk Decrease of Rg-values of polymer in the nanocomposite compared to the corresponding bulk values. Indication of helical conformations! Experimental METHOD Atomistic Molecular Dynamics simulations (MD). PEO was represented by a united atom model and interactions were described by a slightly modified TraPPE force field. Degree of Confinement Degree of Confinement d/Rg = 0.2-20 d d d/Rg = 0.2-0.8 Temperature dependence of density. Temperature dependence of chain dimensions. Gauche increase degree of confinement both in simulation and experiment.