1. AGRICULTURAL AND FOOD SCIENCE
P. Peltonen-Sainio et al. (2015) 24: 24–38
24
Proximity of waterways to Finnish farmlands and associated
characteristics of regional land use
Pirjo Peltonen-Sainio1*
, Heikki Laurila2
, Lauri Jauhiainen1
, Laura Alakukku3
1
Natural Resources Institute Finland (Luke), Natural resources and bioproduction, FI-31600 Jokioinen, Finland
2
CGI Finland, Karvaamokuja 2, FI-00380 Helsinki, Finland
3
University of Helsinki, Department of Agricultural Sciences, P.O. Box 28, FI-00014 University of Helsinki, Finland
email: pirjo.peltonen-sainio@luke.fi
High latitude agriculture is rainfed. Climate change could, however, increase water deficiency and initiate a call
for development of irrigation systems as a part of field water management systems. This study aimed to develop
a basic understanding about the current state of irrigation potential according to region by monitoring proximity
of fields to waterways and characterizing their general conditions. One third of Finnish fields are in direct contact
with a shoreline of an inland waterway. This coupled with Finland being water-rich country may improve adaptive
capacity to cope with the potentially harmful impacts of climate change in the future. However, there are marked
differences between regions in access to water resources. Findings of this survey will serve as background informa-
tion needed to assess future needs for introduction of irrigation and to evaluate the opportunities to close yield
gaps and improve yield stability through irrigation.
Key words: distance, field, irrigation, land use, water availability
Introduction
Prehistoric settlement in Finland progressed in phases (Zvelebil and Rowley-Conwy 1984) and played a significant
role in determining current land use, shaping the landscapes of the boreal regions. Forests, fields and waterways
dominate the landscapes of Finland. In general, Finland is characterized as an exceptionally water-rich country
owing to the forces caused by the 2‒3 km thick ice sheet that covered the ground during the last glacial period
of 10 000 years ago.
Prehistoric lakeside settlements have been typical in Europe (Pollmann 2014). Humans have always utilized the
combined ecological resources of land and water. As the coastal areas gradually emerged from the Baltic due to
land upheaval, those with fine-grained mineral soils were available for settlement (Taavitsainen et al. 1998). Pol-
len analyses have interestingly revealed that traditional slash-and-burn cultivation was not the dominant practice
in the coastal regions dedicated to agriculture, but cereals were grown in permanent fields while shore meadows
offered feed for livestock (Wallin and Segerström 1994, Hansen 1998). However, due to post-glacial land upheaval,
settlements were relocated from time to time to maintain the closeness to the seashore. Single farms were often
the likely basis of the local settlement and typically such settlements again formed the basis of a firm organisa-
tion for society (Hansen 1998).
Hunter-gatherers and developing agrarian societies evidently benefitted in various ways from the ecosystem ser-
vices that shoreline settlement offered. Despite the strategically beneficial location of farms and fields next to
water, agriculture has not to date utilized thoroughly the ecosystem services provided by water availability. This is
despite the fact the precipitation deficiency (difference between evapotranspiration and rainfall) during the first
half of the growing season (May-July) in Finland has been estimated to be 100 to 250 mm, being highest in the
southern and western part of the country (Pajula and Triipponen 2003). Until recently farmers belittled the role
of water scarcity as a frequent yield limiting constraint, possibly due to being misled by high annual precipitation
and high spatial and temporal variation in precipitation (Peltonen-Sainio et al. 2011). Hence, despite abundant
water reserves Finnish agriculture has always mainly been rainfed. Closeness to waterways has, however, provid-
ed advantageous microclimates that represent lower risks for night frosts interfering with crop growth, especially
during the late and early growing season.
Manuscript received August 2014
2. AGRICULTURAL AND FOOD SCIENCE
P. Peltonen-Sainio et al. (2015) 24: 24–38
25
Current access to water resources in Finnish agriculture can be considered as one of the manifestations of nation-
al-cultural heritage that prehistoric ancestors provided when they settled Finland and organised agrarian socie-
ties close to waterways. Even though high latitude agriculture has been rainfed to date, the future, with projected
climate change induced increase in severity of water deficiency and occurrence in extreme events (IPCC 2012),
may call for development and introduction of irrigation systems as an important component of comprehensive
water management (drainage-irrigation-water protection) in boreal agriculture (Peltonen-Sainio et al. 2015a). As
relevant around the world, this obliges development of water management strategies that integrate e.g. needs
and means for changes in agricultural water use, conservation objectives and land use planning to prevent future
harmful consequences (Jury and Waux 2007, Baker et al. 2014). Increased global demand for food is unlike with-
out some expansion in irrigated area, as irrigated agriculture is >300 % as productive as rainfed agriculture and
water scarcity will increase (Jury and Waux 2007). Increasing food production capacities by introduction of irriga-
tion is feasible in regions like Finland with sufficient, high-quality water reserves.
With this study we aspired to compile a basic understanding about the state of irrigation potential in present day
fields, according to region, by assessing closeness of fields to waterways. Furthermore, our objective as to char-
acterize, in general, field conditions and land use depending on how close they were to inland waterways. The
gained novel understanding serves as basic background information when planning and developing assessments
on future potential for irrigation in Finland, i.e. estimating current and future yield gaps and elaborating further
opportunities to narrow the gaps and increase yield stability through irrigation in a socially acceptable and eco-
nomically viable and rational way.
Materials and methods
Data sources and their elaboration
The data used in this study consisted of four spatial vector and raster datasets (i)−(iv) each analyzed as separate
layers in a common Geographical Information System (GIS) with a common EUREF-FIN (TM35FIN/ETRS89) coor-
dinate system using a Transverse Mercator map projection: (i) the digitized vector boundaries for the Centre for
Economic Development, Transport and the Environment (ELY) Centres in Finland, (ii) MTT Agrifood Research Fin-
land spatial soil database, (iii) the Agency for Rural Affairs (MAVI) official Field Parcel Identification System (FLPIS
2014) database with digitized field parcels for all cultivated agricultural land in Finland, and (iv) NLS (National Land
Survey of Finland) dataset, containing both topographic coordinate data and other spatial attribute data like wa-
terway width, classification code and spatial type (line, polygon) for surface and irrigation water resources (ditch-
es, rivers and lakes) in Finland (NLS 2014).
The ELY dataset consisted of 16 digitized boundaries (of type line) for the ELY centres in Finland (Fig. 1).
The MTT soil dataset consisted of digitized polygons with major soil classification types in Finland (Lil-
ja et al. 2009). The MAVI dataset consisted of digitized fields (type polygon) in Finland. The NLS data-
set consisted of digitized (1) main ditches (NLS class code 36312, width 2−10 m, spatial type line), (2)
rivers (NLS code 36313, width >10 m, type polygon), and (3) lakes (NLS code 36200, type polygon).
Model
With the following multi-phase process we aimed to categorise how the Finnish cropland falls into different dis-
tance ranges from surface waters. ArcGIS (v. 10.2) software from the Environmental Systems Research Institute
(ESRI) with the ArcMap Geoprocessing tool for spatial analysis was used to analyze the four spatial datasets (i−iv)
used in this study. Two ArcMap components in Geoprocessing toolset using ArcMap ModelBuilder were used in
spatial analysis: (a) Buffering Analysis and (b) Intersect Analysis components.
The Buffering Analysis component creates buffer polygons around input features to a specified distance. In this
study the Buffering Analysis component was used to calculate the 50, 100 and 300 metre buffering zones (of spa-
tial type line) around ditches, rivers and lakes obtained from the NLS dataset (iv).
The Intersect Analysis component computes a geometric intersection covariance of the input layers using map
algebra rules. The result of the intersect analysis consists of layers or portions of layers which overlap in all input
layers. In this study the Intersect Analysis was used to calculate the spatial intersection covariance components
(polygons and lines) interacting between the four spatial datasets (i−iv). The common EUREF-FIN coordinate sys-
tem was applied for four overlaying GIS layers digitized as spatial polygons and lines.
3. AGRICULTURAL AND FOOD SCIENCE
P. Peltonen-Sainio et al. (2015) 24: 24–38
26
The general solution for the spatial intersection method with covariance effects, buffering analysis, and calcula-
tion hierarchy is given in Eq. 1. During the spatial analysis process, the spatial buffering line results (x4
) were in-
tersected with polygon component results (x1,
x2,
x3
).
intersection [ (x1
)× (x2
)× (x3
)× (buffering (x4
)) ] [1]
where the intersect covariances were: (x1
) a digitized region polygon (The Centres for Economic Development,
Transport and the Environment, ELY Centres, total of 16), (x2
) the MTT soil polygon inside a specific ELY region poly-
gon, (x3
) the MAVI field parcel polygon within a specific ELY region polygon and corresponding overlaying MTT soil
polygon (totalling about 1 million field base parcels), and (x4
) the buffered distance line (50, 100, 300 m) from the
waterway (0 m) within specific (MAVI field parcel polygon × MTT soil polygon × ELY centre region polygon) inter-
section. In addition, during buffering analysis in component (x4
), a requirement was forced for each field parcel
having either shoreline to waterway or being ≤50 m, ≤100 m, ≤300 m or >300 m distant from the corresponding
shoreline) depending on the waterway (being either main lake, river or main ditch).
In this paper we use term “field” when referring to field parcels available from FLPIS. These fields are often fur-
ther divided into agricultural parcels. Thereby, in one field there might be number of agricultural parcels that dif-
fer by crop species.
Cultivation information was obtained from MAVI (official database for field crop cultivation). The register had
1213038 agricultural parcels from 1026934 fields. 1143147 agricultural parcels had following information: culti-
vation area, farmer, crop, municipality and ELY-centre in 2011. In addition, mid-point coordinates were available
for 852303 fields.
The national field parcel register and the database of water access were combined. Descriptive statistics (mean,
lower quartile, median, upper quartile) were used to calculate water access distribution in different ELY-centres.
In addition, similar calculations were done separately for several crops and results were compared to the distri-
bution of all crops. Descriptive statistics were used to compare average area of agricultural parcels between dif-
ferent water access categories. Spatial distribution of water access categories was illustrated by 10 × 10 km maps
with background maps of 1:80 000 by Maanmittauslaitos (National Land Survey of Finland).
The soil map database (Lilja et al. 2009) included information on soil type from 571808 fields. The database was
combined with the database for water access and distribution of water access was calculated for all soil types.
Weather data originating from the Finnish Meteorological Institute was gathered for 2010, when specific infor-
mation was available for irrigation practices on Finnish farms (Tike 2012). As drought has most detrimental ef-
fects on crop growth and yield formation at early to mid summer (Peltonen-Sainio et al. 2011), information on
monthly accumulated precipitation (mm), mean temperature (°C) and cumulated degree days (°C) for May, June
and July in 2010 was compared with the long-term mean (1981‒2000) for eight regional meteorological stations.
Results
Regional differences in field closeness to waterway shorelines and field characteristics
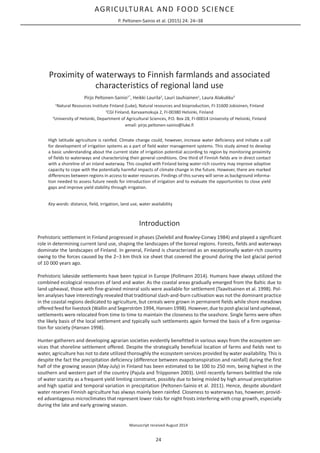
At the national scale one third of the fields are located next to waterways, lakes, rivers and main ditches, and
slightly more than another third are within 300 m of the shoreline of a waterway (Fig. 1), when sea shorelines
were excluded.
Hence, only one quarter of the fields is more than 300 m from a waterway. However, regional differences are sig-
nificant: the highest share of fields is close to waterways in western coastal regions that are characterized by a
high number of outlets. In the archipelago and southern coastal and eastern interior regions the proportion of
fields with reasonable closeness to waterways is lowest, but even then 20‒35 percent of fields were located near
the waterways and even more in the Great Lakes District of Finland (Fig. 1).
The number of fields and agricultural parcels within a main field change substantially, depending on region. As
the total number of agricultural parcels included in this study was ca. 960000, the range depending on region
varied from 111000 agricultural parcels in Etelä-Pohjanmaa and 98000 in Varsinais-Suomi to 12000 in the archi-
pelago (mainly Åland) and 18000 in northern interior Kainuu. At the national scale 86.9% of fields were not di-
vided into agricultural parcels in 2011, ranging from 83.7 % to 91.2 % depending on region (data not shown).
4. AGRICULTURAL AND FOOD SCIENCE
P. Peltonen-Sainio et al. (2015) 24: 24–38
27
In the case of having agricultural parcels, fields were divided into two up to five or even eight parcels depending
on region and the field size (Fig. 2): typically the biggest fields had the highest number of agricultural parcels, but
the sizes of agricultural parcels within a field were not equal.
Fig. 1. Closeness of fields to waterways depending on
region. The size of the circle indicates the total area (ha)
of arable land in each region compared with Varsinais-
Suomi as a reference (with the total of 296630 ha
in 2011). Regions: UUSI, Uusimaa (1 in Fig. 4); VARS,
Varsinais-Suomi (2); SATA, Satakunta (3); HÄME, Häme
(4); PIRKA, Pirkanmaa (5); KAAK, Kaakkois-Suomi (6);
ESAVO, Etelä-Savo (7); PSAVO, Pohjois-Savo (8); PKARJ,
Pohjois-Karjala (9); KESKI, Keski-Suomi (10); EPO, Etelä-
Pohjanmaa (11); POHJ, Pohjanmaa (12); PPO, Pohjois-
Pohjanmaa (13); KAIN, Kainuu (14); LAPP, Lapplan (15);
ARCH, Archipelago [Åland Islands (16)].
Whole country
Next to
=50 m
=100 m
=300 m
>300 m
VARS
ARCH
SATA
PIRKA
UUSI
KAAK
PKARJ
ESAVO
HÄME
KESKI
PSAVO
EPO
POHJ
KAIN
PPO
LAPP
0
2
4
6
8
10
12
1 2 3 4 5 6 7
Number of agricultural parcels in a field
Size of field and size distribution of agricultural parcel in it (ha)
Fig. 2. The mean number and size
distribution of agricultural parcels
depending on the area of the field. The
parcel size distribution within a field is
shown with alternating black and gray.
5. AGRICULTURAL AND FOOD SCIENCE
P. Peltonen-Sainio et al. (2015) 24: 24–38
28
There was also a tendency that the fields and also agricultural parcels right next to the waterway, especially river
and main ditch, were bigger than those more distant from waterways (Fig. 3).
This was the case independent of region, though regional differences in general field size distributions were high.
Particularly large fields were located next to lakes, rivers and main ditches in the southern and south-western
prime cereal production regions, Uusimaa, Varsinais-Suomi, Satakunta and Pirkanmaa (Fig. 4). Field size at <50,
<100 and <300 m from waterways were, however, very similar in size compared with those even further from any
waterway (data not shown).
0
2
4
6
8
1 2 3 4 5 6 7 8 9 10 11 12 13 14 15 16
0
2
4
6
8
1 2 3 4 5 6 7 8 9 10 11 12 13 14 15 16
0
2
4
6
8
1 2 3 4 5 6 7 8 9 10 11 12 13 14 15 16
0
2
4
6
8
1 2 3 4 5 6 7 8 9 10 11 12 13 14 15 16
Next to lake
Next to river
Next to main ditch
Elsewhere
Field
size
(h
a)
Region
0
1
2
3
4
5
6
N
e
xt
to
la
ke
N
e
xt
to
rive
r
N
e
xtto
m
a
in
d
rain
=
5
0
m
=
1
00
m
=
3
00
m
E
lse
w
h
e
re
0
1
2
3
4
5
6
N
e
xtto
lake
N
e
xtto
rive
r
N
e
xtto
m
a
in
d
rain
=
50
m
=
10
0
m
=
30
0
m
E
lsew
h
ere
H
ectares
H
ectares
Field
Agricultural parcel
Fig. 3. Field size depending on closeness to waterway
compared with fields located at a distance. The upper part
of the line indicates upper quartile, the lower part of line
lower quartile, the top of the box mean field size (ha) and
the bottom of the box median for field size.
Fig. 4. Regional differences in field size (ha) next to lake, river, main
ditch and elsewhere (≥300 m from waterways). The upper part of the
line indicates upper quartile, the lower part of line lower quartile, the
top of the box mean field size (ha) and the bottom of the box median
for field size. Regions, see Figure 1.
HectaresHectares
Nexttolake
Nexttoriver
Nexttomaindrain
≤50m
≤100m
≤300m
Elsewhere
Fieldsize(ha)
6. AGRICULTURAL AND FOOD SCIENCE
P. Peltonen-Sainio et al. (2015) 24: 24–38
29
The portfolio of field crops grown in different regions has not fluctuated much within a region in recent three
decades though major differences between regions exist, with e.g. large areas under grass crops in northern and
eastern parts of Finland and the domination of cereal and other seed crops in the coastal and southern inland
regions (Fig. 5).
Climatic conditions, especially temperature-related length of the growing season and risk for night frost, are among
the main climatic factors shaping the land use in addition to edaphic factors that differ regionally. For example,
fine mineral soils like fine sand and silt (Eutric Regosol) and clay soils (Vertic Cambiosol) dominate close to water-
ways while till soils (Haplic Podzol 1) are typical of fields distant from waterways (Fig. 6). Organic soils are infre-
quent both close to and apart from waterways.
Whole country
Wheat
Barley
Oat
Winter cereals
Rapeseed
Legumes
Potato
Grasscrops
Others
Fig. 5. Regional differences in land use in crop production in 2011
(Data from Tike). Regions, see Figure 1.
Fig. 6. Frequency of different soil types in fields
next to waterway, up to 300 m from waterway
and elsewhere. Data from Luke Soil Database (Lilja
et al. 2009).
Mineral soils
High Coarsenes Low
Proportion(%)
Organic soils
25
20
15
10
5
0
Haplicpodzol1
Haplicpodzol2
EutricLegosol
EutricCambisol2
VerticCambisol
Fibric/TerricHistosol2
Fibric/TerricHistosol1
DystricGleysol
7. AGRICULTURAL AND FOOD SCIENCE
P. Peltonen-Sainio et al. (2015) 24: 24–38
30
This is attributable to the generally larger fields along the shoreline of waterways (Figs. 3 and 4). Agricultural par-
cels devoted to potato (Solanum tuberosum L.) are particularly small, especially next to lakes (Fig.7). When regions
were compared the same held, independently of the frequency of waterways and fields next to them in a region
– the larger fields and agricultural parcels were next to the rivers and main ditches (Fig. 8).
Fig. 7. Differences between crops in
agricultural parcel size (ha) depending on
closeness to waterways in 2011. The upper
part of the line indicates upper quartile, the
lower part of line lower quartile, the top of
the box mean field size (ha) and the bottom
of the box median for parcel size.
Fig. 8. Differences between major and minor production
regionsinagriculturalparcelsizedevotedtospringwheat
(a), rapeseed (b) and grass crops (c). The upper part of
the line indicates upper quartile, the lower part of line
lower quartile, the top of the box mean parcel size (ha)
and the bottom of the box median for field size.
Agriculturalparcelsize(ha)
Nexttolake
Nexttomainditch
Nexttolake
Nexttoriver
Nexttoriver
Nexttomainditch
≤50m
≤50m
≤100m
≤100m
≤300m
≤300m
Elsewhere
Elsewhere
Agriculturalparcelsize(ha)
Nexttolake
Nexttomainditch
Nexttoriver
≤50m
≤100m
≤300m
Elsewhere
Nexttolake
Nexttolake
Nexttoriver
Nexttoriver
Nexttomainditch
Nexttomainditch
≤50m
≤50m
≤100m
≤100m
Elsewhere
Elsewhere
≤300m
≤300m
8. AGRICULTURAL AND FOOD SCIENCE
P. Peltonen-Sainio et al. (2015) 24: 24–38
31
When further assessing how common each major crop was near a waterway relative to the general proportion
of cultivated land in a region or on the national scale, we found that potato was more frequently grown next to
waterways than any other crop despite large regional differences (Table 1). Also for crops other than oat (Avena
sativa L.) and pasture higher proportions of land were devoted to their cultivation in agricultural parcels close to
waterways than elsewhere.
Table 1. Percentage of crop grown in fields close to waterways and elsewhere compared with general cropping percentage (% / %)
at national (CO) level and in the region (REG) with the highest percentage (i.e., 1.00 refers to equal percentage at national scale,
<1.00 lower percentage and >1.00 higher percentage compared with national or regional scale). Also proportion of fields with
buffer zones (%) (area being at least 15 m from shoreline) incentivized by the Agri-Environmental Program is shown at national and
regional scale. Data for 2011 provided by Tike.
Closeness to
waterway
Wheat Barley Oat
Winter
cereals
Rapeseed Potato
Grass
crops
Buffer
zone
CO REG CO REG CO REG CO REG CO REG CO REG CO REG CO REG
Next to lake 0.63 1.88 0.75 1.19 0.87 1.14 0.76 2.84 0.72 1.22 0.43 2.74 1.19 1.46 1.55 5.01
Next to river 1.28 3.33 1.17 1.53 0.87 1.91 1.23 8.20 1.14 2.51 1.39 2.95 0.91 1.12 1.50 5.61
Next to ditch 1.19 1.57 1.24 2.10 1.05 1.91 1.05 1.97 1.20 1.92 1.36 2.93 0.85 1.15 0.50 1.79
≤50 m 0.78 1.46 0.91 1.20 0.90 1.08 0.97 1.75 0.88 1.87 0.84 1.76 1.16 1.26 1.55 5.61
≤100 m 0.99 1.50 1.07 1.45 1.03 1.41 0.92 2.33 1.02 3.03 1.08 1.50 0.99 1.17 0.92 3.37
≤300 m 0.96 3.54 0.96 1.18 1.02 1.33 1.01 1.61 0.96 2.26 1.01 1.62 1.06 1.25 0.57 1.71
Elsewhere 0.94 1.01 0.86 1.06 1.02 1.10 1.00 1.06 0.93 1.44 0.75 1.74 1.02 1.31 0.27 0.73
Current irrigation capacity
The proportion of farms with existing irrigation technology averaged 7.2 % in Finland, with high regional differ-
ences and particularly high irrigation capacity in the archipelago, Varsinais-Suomi and Uusimaa regions, and low in
northern regions of the country (Table 2). The potential area accessed by irrigation technologies ranged from 0.5
% to 10.3 %, depending on region, with a national mean of only 3.0 %. Even in the cases that a farm has irrigation
facilities, only some of the fields can be irrigated, i.e. from 22.2 % to 40.9 % of the farm area (Table 2). On aver-
age, about one third of the farm area is available for irrigation considering farms that have irrigation equipment.
Drought and elevated temperatures were experienced from mid summer 2010 (Table 3), i.e. when yield potential
was determined, but especially so when it was realized as yields.
9. AGRICULTURAL AND FOOD SCIENCE
P. Peltonen-Sainio et al. (2015) 24: 24–38
32
Table 2. Regional differences in proportion of farms with irrigation technologies (%) and proportion of arable land available for
irrigation (%) in 2010. Regions: UUSI, Uusimaa; VARS, Vasinais-Suomi; SATA, Satakunta; HÄME, Häme; PIRKA, Pirkanmaa; KAAK,
Kaakkois-Suomi; ESAVO, Etelä-Savo; PSAVO, Pohjois-Savo; PKARJ, Pohjois-Karjala; KESKI, Keski-Suomi; EPO, Etelä-Pohjanmaa;
POHJ, Pohjanmaa; PPO, Pohjois-Pohjanmaa; KAIN, Kainuu; LAPP, Lapplan; ARCH, Archipelago. See regions in map in Figure 1.
Data from Tike (2012).
Region Farms with irrigation technologies
Potential area for irrigation
At regional scale At irrigation farm scale
UUSI 11.2 5.3 38.5
VARS 15.6 5.2 30.4
SATA 8.5 4.2 38.2
HÄME 8.4 3.8 31.9
PIRKA 5.4 2.9 38.9
KAAK 8.1 3.3 35.9
ESAVO 8.5 3.8 38.5
PSAVO 7.1 2.0 32.7
PKARJ 4.0 1.1 34.1
KESKI 3.8 1.0 24.4
EPO 3.2 1.1 31.0
POHJ 3.9 1.9 40.9
PPO 4.3 1.7 32.2
KAIN 4.1 0.8 28.5
LAPP 3.2 0.5 22.5
ARCH 28.8 10.3 35.6
At national scale 7.2 3.0 34.1
Table 3. Deviation of May, June and July mean temperature (Tmean, °C), cumulated degree days (CDD, °C) and accumulated
precipitation (Prec, mm) from long-term mean (1981‒2010) in eight meteorological stations of Finland in 2010. See regions in Table
2 and Figure 1. Data from Finnish Meteorological Institute.
Station Deviation from long-term mean
Name (coordinates) Region Month#
Tmean CDD Prec
Jomala (60.12, 19.90) ARCH May 0.5 23.8 7.5
June ‒0.3 ‒16.7 ‒28.8
July 3.2 112.8 ‒41.8
Jokioinen (60.81, 23.50) HÄME May ‒5.0 46.9 27.0
June 0.0 0.7 ‒10.3
July 4.1 127.2 ‒33.5
Lappeenranta (61.04, 28.15) KAAK May ‒4.0 59.3 20.3
June 0.0 13.6 ‒19.9
July 5.0 154.7 ‒20.5
Jyväskylä (62.40, 25.67) KESKI May ‒4.9 64.7 26.7
June ‒0.4 1.0 ‒13.7
July 4.6 143.7 ‒57.2
Tohmajärvi (62.24, 30.35) PKARJ May 3.0 69.4 10.3
June ‒1.0 ‒30.5 0.5
July 4.4 136.4 ‒4.8
Seinäjoki (62.94, 22.49) EPO May 2.2 68.6 28.3
June ‒0.5 ‒14.2 ‒14.6
July 3.6 112.8 0.1
Oulunsalo (64.93, 25.35) PPO May 3.1 100.6 ‒12.5
June ‒1.4 ‒42.2 ‒13.3
July 2.2 68.0 ‒11.5
Rovaniemi (66.58, 26.01) LAPP May 2.1 92.3 ‒1.4
June ‒1.4 ‒36.7 ‒32.2
July 0.6 23.5 5.4
#
In general, May corresponds with plant stand establishment, June with formation of yield potential and July with early phase of realization
of yield potential (in particular for grain and seed crops).
10. AGRICULTURAL AND FOOD SCIENCE
P. Peltonen-Sainio et al. (2015) 24: 24–38
33
Accumulated precipitation in 2010 was clearly less than the long-term mean for June and July, especially across
the prime agricultural regions of Finland, and was accompanied by elevated temperatures and more cumulated
degree days, particularly in July (and continuing so also in August). Of farms with existing irrigation technologies
(7.2 % of farms), 3.7 % exploited the opportunity for irrigation (Table 4).
Table 4. Regional differences in proportion of irrigated farms (%) in 2010 and the proportion of area that was irrigated to cope with drought
(%). See regions in Table 2 and Fig. 1. Data from Tike (2012).
Region
Proportion of irrigated
farms
Proportion of irrigated area to cope with drought
At regional scale
At irrigation farm
scale
From area accessible for irrigation
UUSI 4.4 0.5 3.8 9.8
VARS 9.4 0.9 5.4 17.8
SATA 4.2 0.9 8.3 21.8
HÄME 3.6 0.6 4.9 15.5
PIRKA 1.7 0.2 3.3 8.2
KAAK 3.5 0.5 5.0 13.9
ESAVO 5.3 1.3 13.4 34.8
PSAVO 4.0 0.6 9.3 28.4
PKARJ 2.5 0.3 10.8 31.7
KESKI 2.0 0.1 3.3 13.7
EPO 1.3 0.2 5.8 18.6
POHJ 2.1 0.6 12.7 31.0
PPO 2.0 0.3 6.4 19.9
KAIN 1.5 0.1 2.6 9.1
LAPP 1.8 0.1 5.0 22.1
ARCH 18.7 4.4 15.2 42.6
At national scale 3.7 0.6 6.4 18.7
Depending on region, up to 4.4 % of the arable land was irrigated in 2010 to cope with drought, but the national
mean was only 0.6 %. Furthermore, 6.4 % of the area was irrigated on farms with facilities for irrigation and 18.7
% of the area of farms that had potential for irrigation. In most cases surface water was used for irrigation, com-
ing from a waterway extending beyond the farm (38.6‒83.8 % of water used) (Table 5).
Depending on region, surface water on the farm was an important source for irrigation (10.3‒49.4 %), while
groundwater and tap water were only rarely used. In horticulture (the dominant sector for irrigation) more on-
farm surface water was used than for special crop and potato production.
11. AGRICULTURAL AND FOOD SCIENCE
P. Peltonen-Sainio et al. (2015) 24: 24–38
34
Table 5. Origin of irrigation water (%) in 2010 according production sector and regions (surface water from the farm or from
a waterway that extends beyond the farm, groundwater from the farm, tap water from outside the farm and other source of
water). See regions in Table 2 and Figure 1. Data from Tike (2012).
Surface water Groundwater Tap water Other
Production sector Farm Beyond the farm Farm Beyond the farm
Horticulture 36.2 54.6 5.3 2.6 1.3
Special crop 25.4 69.3 2.9 0.5 1.9
Other 27.9 63.3 5.4 2.0 1.4
Total 29.9 61.9 4.8 1.9 1.5
Region
UUSI 25.7 66.7 7.2 0.4 0.0
VARS 37.9 51.1 7.5 1.1 2.4
SATA 21.2 74.7 0.9 2.6 0.7
HÄME 31.7 63.6 1.6 0.7 2.4
PIRKA 26.5 61.4 8.7 3.5 0.0
KAAK 23.0 70.2 3.9 2.9 0.0
ESAVO 39.2 51.9 7.7 1.2 0.0
PSAVO 34.7 62.7 0.6 0.4 1.6
PKARJ 30.2 62.3 5.1 2.4 0.0
KESKI 49.4 50.6 0.0 0.0 0.0
EPO 18.9 64.6 5.2 7.2 4.1
POHJ 10.3 73.9 5.5 4.3 6.0
PPO 12.4 83.8 0.9 0.9 2.0
KAIN 43.1 38.6 10.3 8.1 0.0
LAPP 24.7 75.3 0.0 0.0 0.0
ARCH 35.0 54.1 8.4 2.5 0.0
Discussion
National heritage for future adaptation?
The ancestors that gradually settled Finland and formed agrarian societies next to shorelines exploited ecosystem
services that water resources represented (Jussila et al. 2007). However, having additional supply of water for ir-
rigation of crop stands was evidently not important in a humid climate where the annual precipitation exceeded
annual evapotranspiration and fields needed drainage to exploit the short growing season. Currently an average
of 58 % of fields has subsurface drainage systems and 27 % ditches. One can consider that clearing land and es-
tablishing farms next to waterways has provided a national-cultural heritage that may enable improved adaptive
capacity to cope with the forecasted, potentially harmful impacts of climate change (Rötter et al. 2011). The boreal
regions of Europe thus seem to have unique opportunities to cope with potential future constraints like drought
and heatwaves. When considering abundant water reserves and their availability for irrigation, there are marked
differences among regions in access to water resources, as shown in Figure 1 and Figure 9.
That fields are located next to or close to the shorelines of inland waterways, poses disadvantages with associ-
ated environmental problems like eutrophication that increases as cultivation increases. Excess use of fertilizers
was reported for the late 1960s to 1990s in Finland (Antikainen et al. 2008), increasing the soil phosphorus levels
(acid ammonium acetate, pH 4.65, soil test phosphorus) and risk of soluble P leaching (Uusitalo and Jansson 2002).
12. AGRICULTURAL AND FOOD SCIENCE
P. Peltonen-Sainio et al. (2015) 24: 24–38
35
On the other hand, drought is a frequent constraint interfering with nutrient uptake and crop growth, especially
in the western coastal regions (Peltonen-Sainio et al. 2011). This again emphasizes the need to consider irriga-
tion as a means to not only close yield gaps, but also to ensure efficient nutrient uptake and thereby sustainably
intensify boreal cropping systems.
Since 1995 policy incentives have been directed at reducing fertilizer use rates (Salo et al. 2007), with successful
effects on reducing nutrient loads but negative impacts on yields and quality (Peltonen-Sainio et al. 2015b). How-
ever, in addition to reducing nitrogen and phosphorus use, establishing buffer zones has been incentivized, espe-
cially on sloping fields next to waterways. This targeted measure has been successful when gauged as frequency
of buffer zones in fields located next to the shorelines of lakes and rivers, and allocation according to vulnerabil-
ity of a region (Table 1).
A
B
C
Fig. 9. Differences in frequency of fields
and access to water resources depending
on distance to closest waterway. On
the right hand side figures, one dot
indicates one field in a 10 × 10 km grid.
The darkest blue indicates that the field
has direct contact with a shoreline of
a waterway, dark blue that it is at ≤50
m from shoreline, blue ≤100 m, light
blue ≤300 m apart and beige >300 m
apart. There are three example sites:
Jokioinen (A) in Häme, Ylistaro (B) in
Etelä-Pohjanmaa and Rantasalmi (C) in
Etelä-Savo.
13. AGRICULTURAL AND FOOD SCIENCE
P. Peltonen-Sainio et al. (2015) 24: 24–38
36
Currently irrigation is practised in Finnish horticulture (Table 5). Potato is virtually the only field crop irrigated cur-
rently and also predominantly located close to waterways in some regions (Table 1). Regarding crops other than
potato, factors additional to water availability, i.e. climatic and edaphic conditions (Fig. 6), as well as other field
characteristics (especially larger fields next to waterways; Fig. 3), are the predominant drivers for future land use
planning. Consequently, current land use in shoreline fields does not indicate future land use, especially in the
case that irrigation is introduced. Therefore, in the forthcoming assessments, one needs to also consider the po-
tential changes in land use and shifts between crop species grown in different fields and regions depending on
crops biological and economic responsiveness to irrigation. Thereby, one can more thoroughly envisage the fu-
ture potential for yield elevations in a region through crop choices, associating changes in nutrient load risks and
their interplay with socio-economics at the farm and regional scale. An example of recent demarcation between
economics contra climatic limitations is that despite temperature conditions and adequate length of the growing
season, as well as risk of night frosts (Fig. 5), spring wheat (Triticum aestivum L.) and rapeseed (Brassica rapa L.)
have been cultivated more and more outside their original zones (see their share of field use e.g. in Pohjanmaa
region) (Peltonen-Sainio et al. 2009, Peltonen-Sainio and Jauhiainen 2014).
2010 as a case of severe drought
Drought and elevated temperatures coincided in Finland since mid-summer 2010 (Table 3) and the records were
broken for the highest temperatures ever measured in July (37.2 °C) and August (33.8 °C) according to the Finnish
Meteorological Institute. Simultaneously, in Russia extreme drought and the highest heat wave measured over 130
years, causing e.g. more than 550 wildfires, resulted in a food crisis (Wegren 2011). About 5.4 million hectares of
crop stands shrivelled ‒ averaging 17 % of the total cropped land and impacting directly ca. 25.000 farms (Welton
2011). This caused price volatility in global food markets, and especially so in the countries that imported Russian
grain. As often in a crisis, it hit the poorest (Welton 2011). Although this was a single event, and not necessarily
linked with climate change, it mirrored events that are projected to become more frequent in the future (IPCC
2012) and which have been faced repeatedly in Europe during the 2000s, e.g. in 2003 and 2011 (Soussana et al.
2012). According to IPCC (2013) each of the last decades has become progressively warmer.
Finland also experienced drought and heat in 2010 and there was concern about water sufficiency for agriculture.
Accumulated precipitation was less than the long-term mean for June and July across the prime agricultural regions
of Finland (Table 3) and 2010 was among the years in the 2000s with the lowest spring cereal grain yields (data not
shown). In addition to 2010, exceptional drought was experienced also in 2002, interfering with crop production
and animal welfare and production (Silander and Järvinen 2004). Regarding the drought of summer 2010, statistics
(Tike 2012) indicate than only 3 % of arable land had access to irrigation, mainly because of lack of technologies,
yet at the national scale 23 % of fields are located next to the shoreline of a waterway and even 72 % are ≤300 m
from water (Fig. 1). In general, fields in the most drought prone coastal regions have often an advantage of access
to irrigation machinery and water over the inland regions. As the fields next to shorelines are typically larger than
those elsewhere, access of the whole field to water could be limited. Irrigation again is practised almost solely for
horticulture and potato production (Table 3). Even in the case of severe drought and elevated temperatures that
occurred in 2010, only part of the irrigation potential (corresponding <20 % of area accessible for irrigation) was
harnessed, mainly by exploiting surface water resources (Tables 4 and 5). Also the historical reallocation of parcels
of land may have resulted in farm structures unsuited to irrigation (Hiironen and Ettanen 2012).
It is likely that the major limiting factor for exploiting even the currently existing irrigation potential in today’s so-
cio-economic framework is insufficient in economic incentives to invest in irrigation equipment and/or to expand
the current technology to watering crops other than horticultural cash crops (Peltonen-Sainio et al. 2015a). How-
ever, the current incentives for irrigation may differ markedly from those envisaged for the future in a changing
climate. The projected increasing challenges regarding water sufficiency (Peltonen-Sainio et al. 2011) and elevated
temperatures (Rötter et al. 2011), as well as the anticipated increases in weather variability and frequency of ex-
treme events (IPCC 2012), in addition to a projected longer growing season and higher yield potentials (Peltonen-
Sainio et al. 2009), call for including irrigation as an element in adaptation strategies and implementation plans.
ThissurveyhighlightedthereasonablyhighirrigationpotentialresultingfromonethirdofFinnishfieldsbeingindirect
contactwithashorelineofaninlandwaterway,especiallyinwesterncoastalregionswiththelowestearlyseasonprecipi-
tationandhighestpressureevapo-transpiration(PajulaandTriipponen2003;Peltonen-Sainioetal.2011).However,under
highlatitudelong-dayconditionstheperiodforthemostacuteneedforadditionalwatertosustaincropstandsisshort.
14. AGRICULTURAL AND FOOD SCIENCE
P. Peltonen-Sainio et al. (2015) 24: 24–38
37
Hence, when targeting irrigation technologies to supply additional water to crop stands during their most vulner-
able, drought prone phase, sufficiency of water for contemporary, potentially even large-scale irrigation, is uncer-
tain (Peltonen-Sainio et al. 2015a). This again calls for comprehensive assessments of water sufficiency for future
irrigation schemes. Besides the sufficiency of water for irrigation, possible limitations to using water resources for
irrigation must be taken into account. In the future studies on field water management, irrigation systems should
be considered together with drainage systems to assess the opportunities to gain from water collection systems
and/or temporary storage (e.g. constructed wetlands).
Conclusions
Monitoring access to abundant water reserves in Finland emphasized the general potential to expand irrigated
areas in the future in the case that drought episodes and elevated temperatures will be experienced more fre-
quently due to climate change. However, the development of water management systems will differ depending
on region and further steps to be taken along with technological developments call for thorough considerations
of water sufficiency and availability for large-scale irrigation needed for a relatively short time period. Also socio-
economic obstacles, like farmers’ inexperience in irrigation in field crop production and the diffuse farm struc-
ture, and thereby the potential reluctance to invest, needs to be taken into consideration. To support long-term
decision-making processes at the national scale and to better envisage the future gains potentially achievable by
irrigation, calls for comprehensive evaluation of differences in yield potentials, attainable yields and yield loss-
es caused by drought under future climatic conditions for different regions. Factors other than water availability
(field characteristics, environmental concern etc.) are current drivers for land use planning in the shoreline fields
and consideration has therefore to be given to the land use changes in shoreline and distant fields. Depending
on yield gaps and responsiveness of crops to irrigation, greater understanding is needed on the future potential
of irrigating Finnish fields.
Acknowledgements
The work was financed by the Finnish Ministry of Agriculture and Forestry as a part of a consortium project titled
Water Management Systems to Improve Energy and Nutrient Use Efficiency of Field Crop Production in Chang-
ing Climate (VEHMAS) and by MTT Agrifood Research Finland as a part of a project Sustainable Intensification of
Cropping Systems (SusIntens).
References
Antikainen, R., Haapanen, R., Lemola, R., Nousiainen, J.I. & Rekolainen, S. 2008. Nitrogen and phosphorus flows in the Finnish
agricultural and forest sectors, 1910‒2000. Water, Air & Soil Pollution 194: 163‒177.
Baker, J.M., Everett, Y., Liegel, L. & van Kirk, R. 2014. Patterns of irrigated agricultural land conversion in a Western U.S. water-
shed: Implication for landscape-level water management and land-use planning. Society and Natural Resources 27: 1145‒1160.
FLPIS 2014. Finnish Land Parcel Identification System register web site administered by MAVI and NLS. Cited 28 July 2014. http://
www.mavi.fi/en/support-and-services/Pages/default.aspx and http://www.paikkatietoikkuna.fi/web/en/map-window.
Hansen, B.R. 1998. Early agrarian landscapes in Finland. Geografiska Annaler 80: 187‒201.
Hiironen, J. & Ettanen, S. 2012. Peltoalueiden tilusrakenne ja sen parantamismahdollisuudet. Maanmittauslaitoksen julkaisuja
nro 113. 82 p. (In Finnish).
IPCC 2012. Summary for Policymakers. In: Field, C.B., Barros, W., Stocker, T.F., Qin, D., Dokken, D.J., Ebi, K.L., Mastrandrea, M.D.,
Mach, K.J., Plattner, G.-K., Allen, S.K., Tignor, M. & Midgley, P.M., (eds). Managing the Risks of Extreme Events and Disasters to
Advance Climate Change Adaptation. A Special Report of Working Groups I and II of the Intergovernmental Panel on Climate
Change, Cambridge, Cambridge University Press. 19 p.
IPCC 2013. Summary for Policymakers. In: Stocker T.F., Qin D., Plattner G.-K., Tignor M., Allen S.K., Boschung J., Nauels A., Xia Y.,
Bex V. & Midgley P.M. (eds). Climate Change 2013: The Physical Science Basis. Contribution of Working Group I to the Fifth As-
sessment Report of the Intergovernmental Panel on Climate Change, Cambridge, Cambridge University Press. 28 p.
Jury, W.A. & Vaux, H.J. Jr. 2007. The emerging global water crisis: Managing scarcity and conflict between water users. Advances
in Agronomy 95: 1‒76.
Jussila, T., Kriiska, A. & Rostedt, T. 2007. The Mesolithic settlement in NE Savo, Finland and the earliest settlement in the eastern
Baltic Sea. Acta Archaeologica 78: 143‒162.
Lilja, H., Uusitalo, R., Yli-Halla, M., Nevalainen, R., Väänänen, T. & Tamminen, P. 2009. Suomen Maannostietokanta. MTT TIEDE 6.
69 p. Helsinki, Finland. (In Finnish with English abstract)
NLS 2014. National Land Survey of Finland (NLS) topographic dataset. Cited 28 July 2014. http://www.paikkatietoikkuna.fi/web/
fi/maastotietokanta.
15. AGRICULTURAL AND FOOD SCIENCE
P. Peltonen-Sainio et al. (2015) 24: 24–38
38
Pajula, H. & Triipponen, J-P. 2003. Selvitys Suomen kastelutilanteesta, esimerkkialueena Varsinais-Suomi. (A survey of the irriga-
tion in Finland - case study Southwestern Finland). Suomen ympäristö, No. 629. 86 p. ISBN 952‒11‒1416‒9 (In Finnish)
Peltonen-Sainio, P. 2012. Crop production in a northern climate. In: Meybeck, A., Lankoski, J., Redfern, S., Azzu, N. & Getz, V. Pro-
ceedings of a Joint FAO/OECD Workshop, Building Resilience to Climate Change in the Agriculture Sector. p. 183‒216. Cited 2 July
2014. http://www.fao.org/agriculture/crops/news-events-bulletins/detail/en/item/134976/
Peltonen-Sainio, P., Jauhiainen, L. & Venäläinen, A. 2009. Comparing regional risks in producing turnip rape and oilseed rape - To-
day in light of long-term datasets. Acta Agriculturae Scandinavica, B Soil and Plant Science 59: 118‒128.
Peltonen-Sainio, P., Jauhiainen, L. & Hakala, K. 2011. Crop responses to temperature and precipitation according to long-term
multi-location trials at high-latitude conditions. Journal of Agricultural Science 149: 49‒62.
Peltonen-Sainio, P. & Jauhiainen, L. 2014. Lessons from the past in weather variability: sowing to ripening dynamics and yield
penalties for northern agriculture in 1970‒2012. Regional Environmental Change 14: 1505‒1516.
Peltonen-Sainio, P., Jauhiainen, L. & Alakukku, L. 2015a. Stakeholder perspectives for switching from rainfed to irrigated cropping
systems at high latitudes. Land Use Policy 42: 585‒593.
Peltonen-Sainio, P., Salo, T., Jauhiainen, L., Lehtonen, H. & Sieviläinen, E. 2015b. Static yields and quality issues: Is the Agri-Envi-
ronment Program with reduced fertilizer use rates the primary driver? AMBIO, DOI: 10.1007/s13280-015-0637-9
Pollmann, B. 2014. Environment and agriculture of the transitional period from the Late Bronze to early Iron Age in the eastern
Baltic: an archaeobotanical case study of the lakeshore settlement Luokesa 1, Lithuania. Vegetation History & Archaeobotany
23: 403‒418.
Rötter, R.P., Palosuo, T., Pirttioja, N.K., Dubrovsky, M., Salo, T., Ristolainen, A., Fronzek, S., Aikasalo, R., Trnka, M., Carter, T.R.,
2011. What would happen to barley production in Finland if global warming exceeded 4 °C ? A model-based assessment. Euro-
pean Journal of Agronomy 35: 205‒214.
Salo, T., Lemola, R. & Esala, M. 2007. National and regional net nitrogen balances in Finland in 1990‒2005. Agricultural and Food
Science 16: 366‒375.
Silander, J. & Järvinen, E.A. 2004, Vuosien 2002–2003 poikkeuksellisen kuivuuden vaikutukset (Effects of Severe Drought of
2002/2003). Suomen ympäristö 731. 79 p. (In Finnish).
Soussana, J.F., Fereres, E., Long, S., Mohren, F.M.J., Panday-Lorch, R., Peltonen-Sainio, P., Porter, J.R., Rosswall, T. & von Braun,
J. 2012. A European science plan to sustainably increase food security under climate change. Global Change Biology, Letter 18:
3269‒3271.
Taavitsainen, J.-P., Simola, H. & Grönlund, E. 1998. Cultivation history beyond the prephery: early agriculture in the North Euro-
pean Boreal forest. Journal of World Prehistory 12: 199‒253.
Tike 2012. Maatalouslaskenta 2010. Kastelu avomaalla ja energia. 16 p. Cited 30 June 2014. http://www.maataloustilastot.fi/e-le-
hti-kastelu-energia/
Uusitalo, R. & Jansson, H. 2002. Dissolved reactive phosphorus in runoff assessed by soil extraction with an acetate buffer. Agri-
cultural and Food Science in Finland 11: 343–353.
Wallin, J.-E. & Segerström, U. 1994. Natural resources and agriculture during the Iron Age in Ostrobothnia, western Finland, in-
vestigated by pollen analysis. Vegetation History & Archaeobotany 3: 89‒105.
Wegren, S.K. 2011. Food security and Russia’s 2010 drought. Eurasian Geography and Economics 52: 140‒156.
Welton, G. 2011. The impact of Russia’s 2010 grain export ban. Oxfam Research Reports, June 2011: 32 p. http://www.oxfam.
org/en/grow. Accessed 1 July 2014.
Zvelebil, M. & Rowley-Conwy, P. 1984. Transition to farming in northern Europe: A hunter-gatherer perspective. Norwegian Ar-
chaeological Review 17: 104‒128.