1. STAGE ONE: Initially, all organisms thrived in a surplus of
resources. Between 70 and 100 days, E. coli grew in density
while C. vulgaris showed a rise in the number of dead cells.
Aggregates of both E. coli and C. vulgaris cells were found in
increasing numbers at earlier stages of the microcosm. T.
thermophila cells were examined to contain one or two C.
vulgaris cells.
STAGE TWO: Between days 200 – 300, C. vulgaris and T.
thermophila cell populations show decreased numbers while
E. coli populations increased. C-Tetrahymena populations
increased in numbers during this stage.
STAGE THREE: After 300 days the E. coli population is
decreased and T. thermophila numbers are higher. C-
Tetrahymena cells increased in population. C. vulgaris
population showed no significant change in population.
Endosymbiosis is an ancient process by which two symbiotic
organisms form a relationship with each other that is beneficial for both
of them. This mutualistic relationship is hypothesized to be derived
from pathogenic parasite-host relationships. By way of evolution, a new
phenomenon has developed that encourages a beneficial parasite-host
relationship between participating organisms. Under favorable
conditions, parasites raise their offspring in the host, which in turn
increases the benefits between the two organisms. However,
researchers believe there is a force besides genetics that prompts the
development of endosymbiosis associations between organisms.
Predatory relationships may induce endosymbiotic association between
organisms that, under normal circumstances, do not generally have a
mutualistic relationship.
Nakajima et al performed an experiment where a microcosm was
created and carefully observed for endosymbiotic interactions between
Chlorella vulgaris (algae), Escherichia coli (bacterium), and Tetrahymena
thermophila (ciliate). Under normal conditions, C. vulgaris excretes
organic waste which is consumed by the E. coli, and the T. thermophila
feed on the E. coli. They investigate the potential for any endosymbiotic
associations between a mix of autotrophic and heterotrophic organisms
inside the microcosm by examining the organisms after certain periods
of time have passed. Results are divided into three stages to explain
population differences. Nakajima et al prove that symbiotic
relationships can be induced in organisms that are normally non-
associative, but only when resources are scarce and conditions are
extreme.
Inducing Endosymbiotic Interactions in Microcosms
Harsh Patel
Oglethorpe University
Introduction Results Conclusions
References
In the first stage, E. coli populations begin to diminish
and T. thermophila cell populations increased. At this
moment, dissolved oxygen (DO) and nutrients are plentiful.
C. vulgaris also begins to live symbiotically with T.
thermophila.
The second stage shows signs of limited resources. DO
levels are down. This is due to C. vulgaris populations
decreasing. Dead C. vulgaris cells serve as a site of refuge
for the E. coli to thrive in, creating “aggregates” of algal and
bacterial cells. This gives E. coli safety from the predatory
ciliates and access to a surplus of nutrients. T. thermophila
cannot penetrate the aggregates and thus, they are
starved, and as a result, their population decreases. At the
same time, C-Tetrahymena cell populations rapidly increase
because it is endosymbiotically favorable for both
organisms to associate with each other. T. thermophila will
phagocytize C. vulgaris, providing them with a safer habitat
to live in with higher DO levels. In return, C. vulgaris cells
provide the ciliates with the nutrients necessary to survive,
serving as an alternative food source in the presence of low
populations of E. coli.
In the third stage of the experiment, the symbiotic
relationship between the algal cells and the ciliates is
evolutionarily favored. The offspring of the hybrid
organisms were growing, even under low E. coli
populations, indicating that T. thermophila relied almost
completely on the C. vulgaris for its nutrients. Under
struggling circumstances, endosymbiosis was induced
between the T. thermophila and C. vulgaris, two organisms
that would not naturally associate in a mutualistic
relationship.
Figure 1. Displays the tendency
of T. thermophila cells to
harbor C. vulgaris cells. (a)
taken 3 days after inoculation
into the microcosm. (b) taken
363 days after inoculation. (c)
732 days after inoculation. (d)
Displays a dividing C-
Tetrahymena cell 3 days after
inoculation (e) Dividing C-
Tetrahymena cell 435 days
after inoculation (f) Displays T.
thermophila cells percolating
C.vulgaris cells 435 days after
inoculation.
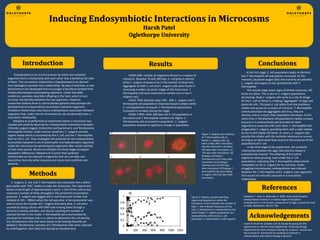
Figure 2. Displays a graph reporting
organismal populations within the
microcosm. X-axis indicates the number of
days, Y- axis indicates frequency of live
cells. C-Tetrahymena is represented by the
solid triangle; C. vulgaris populations are
represented by solid circles; E. coli
population is represented as solid squares.
Nakajima T`, Sano A, Matsuoka H. 2009. Auto-/heterotrophic
endosymbiosis evolves in a mature stage of ecosystem
development in a microcosm composed of an alga, a bacterium and
a ciliate. BioSystems. 96:127-135.
Acknowledgements
I want to thank Dr. Schadler and Dr. Baube for giving me this
opportunity as well the entire Oglethorpe University Biology
Department for their assistance during my research. I would also
like to thank Dr. Schmeichel for peaking my interest in
endosymbiosis and cellular biology in general.
Methods
C. vulgaris, E. coli, and T. thermophila was inoculated into a 200ml
glass bottle with “MC” media to make the microcosm. The experiment
lasted a total length of approximately 3 years. 1.5ml of the culture was
removed a number of times throughout this period for enumeration
purposes. C. vulgaris was tagged with a red fluorescent marker that
radiated at 330 – 380nm when the cell was alive. A hemacytometer was
used to count the number of C. vulgaris that were alive. E. coli were
counted by dying cultures with DAPI and running them through a
bacterial counting chamber, and also by counting the number of
colonies formed in the media. T. thermophila were enumerated by
counting the individual cells in a culture to determine the cell density.
Any Tetrahymena cells that were shown to be hosting Chlorella are
labeled C-Tetrahymena. Samples of C-Tetrahymena cells were collected
by centrifugation, then fixed and stained by toluidine blue.