
Recommended
Recommended
More Related Content
What's hot
What's hot (20)
Similar to Modern Product Data Workflows: Harness Your Product Data: Better Understanding User Behavior Across Channels and Devices
Similar to Modern Product Data Workflows: Harness Your Product Data: Better Understanding User Behavior Across Channels and Devices (20)
More from Hannah Flynn
More from Hannah Flynn (20)
Recently uploaded
Recently uploaded (20)
Modern Product Data Workflows: Harness Your Product Data: Better Understanding User Behavior Across Channels and Devices
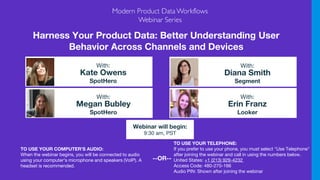
- 1. Harness Your Product Data: Better Understanding User Behavior Across Channels and Devices TO USE YOUR COMPUTER'S AUDIO: When the webinar begins, you will be connected to audio using your computer's microphone and speakers (VoIP). A headset is recommended. Webinar will begin: 9:30 am, PST TO USE YOUR TELEPHONE: If you prefer to use your phone, you must select "Use Telephone" after joining the webinar and call in using the numbers below. United States: +1 (213) 929-4232 Access Code: 480-270-166 Audio PIN: Shown after joining the webinar --OR-- Kate Owens SpotHero With: Diana Smith Segment With: Megan Bubley SpotHero With: Erin Franz Looker With:
- 2. Looker is a complete data platform that offers data analytics and business insights to every department, and easily integrates into applications to deliver data directly into the decision-making process. Looker is powering data-driven cultures at more than 1,600 industry-leading and innovative companies.
- 3. Click on the Questions panel to interact with the presenters www.productmanagementtoday.com/webinar-series/modern-product-data-workflows www.projectmanagementupdate.com/webinar-series/modern-product-data-workflows www.businessinnovationbrief.com/webinar-series/modern-product-data-workflows Modern Product Data Workflows Webinar Series
- 4. About Kate Owens - SpotHero Kate leads Business Intelligence at SpotHero. Through her 5 year tenure, she's had the opportunity to help the company scale from 10 to nearly 200 employees and evolve the data strategy in the process. In addition to implementing multiple data and visualization tools from ground up, she's pioneered many of SpotHero's core business definitions and KPIs and has oversaw data due diligence for the company's series B and series C funding rounds. Fully cracking the code on cross-device, multi-channel marketing attribution is of particular interest to her at the moment - that and learning how to keep alive the excessive amount of houseplants she just bought. About Megan Bubley - SpotHero Megan is a Consumer Product Manager at SpotHero, a top-ranking app that helps people park easier. She has been at SpotHero for the past four years. Her background in education and customer service has made her passionate about creating amazing user experiences through the use of data-driven collaboration and a customer-centric feature focus. Aside from having the amazing opportunity to grow and develop her career at one of Chicago's leading startups, she also knows more about parking than she ever imagined she would in her entire life (general industry knowledge with a specialty in parking puns) feel free to fact check!
- 5. About Diana Smith - Segment Diana Smith is the Head of Product Marketing at Segment, the customer data infrastructure. She is an expert on analytics and marketing technology, working closely with Segment customers on their data implementation and marketing stack choices. Prior to Segment, Diana worked in public relations for machine learning and marketing software clients and started her career in public relations and marketing at Disney. In her spare time, Diana can be found training for a half marathon, reading SciFi novels, or enjoying a ballet performance. About Erin Franz - Looker Erin works with Looker’s ecosystem of technology partners, where she focuses on partner technical integration and enablement. Prior to Looker, Erin worked in analytics at Accenture where she helped build out big data solutions.
- 6. 6 Agenda • Introduction to SpotHero • Product/Analytics Landscape • Segment/Looker Case Studies
- 8. The Market Leader in Online Parking Reservations IN NUMBER OF APP DOWNLOADS IN NUMBER OF CUSTOMERS IN FUNDING IN NUMBER OF EMPLOYEES #1 #1 #1 #1 #1 #1 IN FACILITIES PER MARKET IN PARKING FACILITIES
- 9. Solutions For Drivers, Operators & Partners Parking ToolsConsumers HeroConnect Empower Consumers With ● Mobile App ● Website ● Customer Service Software, Hardware & Data For Parking Operators ● HeroTech Hardware ● Operator Software ● Tow Truck App Power Partners With Parking Directly In Their User Journey ● API ● SDK ● Web Widget
- 10. Product & Analytics at SpotHero
- 11. Product and Analytics Landscape 11 Problem: How do we ensure we’re looking at the same data in the same way while still moving fast and getting the granularity we need?? Analytics Team Product Team Who: 8 analysts across all our departments Main Analytics Tool(s): Looker, Google Analytics Who: 6 Product Managers broken out across 4 subteams Main Analytics Tool(s): Mixpanel, Optimizely
- 12. Segment ensures that all our tools are receiving the same data 12
- 13. Looker allows us to fully customize and easily visualize our data 13
- 14. 2018 Product & Analytics Main Goals 14 1) Improve our conversion rate tracking by customizing our own data and definitions 2) Improve understanding of cross-device, pre-purchase and post-purchase user behavior
- 15. SOLUTION One single source of truth for conversion rate Different departments, using different tools and different definitions for measuring conversion rate Utilize Looker to visualize conversion funnels with data sent from Segment Highlight #1: Single Source of Truth for Conversion Rate 15 PROBLEM GOAL
- 16. Highlight #1 Example: Airport Parking Task Force 16 Solution: Use single source of conversion truth to measure success in our cross-departmental airport parking task force. Looker Funnel Visualization Example
- 17. SOLUTION Connect pre- purchase, post- purchase and cross- device behavior to a known user Multiple devices and an anonymous checkout flow make it difficult to see complete user journey Use Lookml to define and create visualizations for audiences using Segment data Highlight #2: Improved user tracking 17 PROBLEM GOAL
- 18. Highlight #2 Example: Monthly Parking in App 18 Solution: Analyzing and operationalizing off user behavior data post adding functionality to purchase monthly parking in app
- 19. Kate Owens Sr. Business Intelligence Manager Kate@SpotHero.com Thank you! Megan Bubley Product Manager Megan@SpotHero.com
- 20. Harness your product data Diana Smith, Director of Product Marketing
- 21. Core challenges we see Teams focused on integrations and maintenance, rather than making an impact 21 How Segment can help Dirty data leads to incohesive customer experiences, or is simply not used Customer data lives in silos and is inconsistent across teams and tools TRUST IN DATAPRODUCTIVITY CUSTOMER UX Lack of confidence in your data
- 22. Current approach is failing Siloed tools, create siloed data, which creates a disjointed customer experience. The status quo 22 Mobile App Mobile App SERVER Warehouses Warehouses Mobile App Website Mobile App
- 23. C O L L E C T S T A N D A R D I Z E S Y N T H E S I Z E A C T I V A T E Observe customer interactions from every first- party touch point. Ensure data is consistent, accurate, and filtering to the correct location. Resolve into user profiles and surface signals about each customer. Send data to more than 200+ tools for analytics, growth, and more. 23 Introduction to Segment A quick overview of Segment Your customer data infrastructure
- 24. Align: Design your tracking plan Keep your teammates in sync with an accessible data dictionary. Align
- 25. How Segment can help Before Segment // Google Analytics ga('create', 'UA-XXXXX-Y'); ga('require', 'ec'); ga('ec:signedUp', { 'email': ‘andy@segment.com’}); ga('send', 'pageview'); // Facebook Pixel fbq('track', 'Signed Up', { 'email': ‘andy@segment.com’ // Adobe Analytics window.s.linkTrackVars = 'email'; window.s.tl(true, 'o', 'signed_up'); // Marketo window.mktoMunchkinFunction('visitWebPage', { url: '/event/Signed-Up', params: ‘email=andy@segment.com’ 1 2 3 4 5 6 7 8 9 10 11 12 13 14 15 16 17 18 19 20 analytics.track('Signed Up', { name: 'andy@segment.com' }); 1 2 3 4 5 6 7 8 9 10 11 12 13 14 15 16 17 18 19 20 Collect: Implement analytics code 25 After Segment Capture user interactions across channels.
- 26. Validate: Automate the QA process Diagnose data quality issues before they impact production. Validate
- 27. Enforce: Defend against rogue events Automatically block invalid events from being sent to your end-tools. Enforce
- 28. 28 How Segment can help Connect: Integrate 200+ tools Integrate Redshift, BigQuery, Snowflake, or DB2 and analyze with Looker.
- 29. 29 How Segment can help Define: Create universal metrics Align on how you turn raw event data to company-wide metrics.
- 30. Solutions to key product challenges Capture product data once, send it to any data warehousing, analytics, or growth tool. 30 How Segment can help Build analysis and campaigns with the user’s full history and context in mind. Drive better activation and engagement. Unify your data with a consistent schema and gain confidence with data governance controls. TRUST IN DATAPRODUCTIVITY CUSTOMER UX Unify and trust your data
- 31. Start your free trial segment.com/signup Chat with a product specialist segment.com/demo
- 32. Harness your product data Erin Franz Technology Alliances Manager
- 33. 33 A New Way Of Doing Things Leveraging Today’s Technology LookML + One Platform Guarantee Consistency Data Stays In Your Database
- 34. Looker for Segment: An Overview Find, explore and understand all the data Explore Everything Find, explore, and understand all the data Create Standards Define metrics with LookML and Looker Blocks Any SQL Database Analyze all of your data in your data warehouse Build a Data Culture Anyone can ask and answer questions Will we meet our revenue targets? Which rep is converting best? Which customer is at risk? Can we speed up our operations? Send the results back to Segment & downstream tools!
- 35. Define Meaningful KPIs Built an “Inventory Score” to determine investment KPI based on the number of items covered by offers in a given store allows team to focus efforts on customer retention and sales in stores with lower score Standardize metrics to drive analysis and action Use Looker to build the best indicators of product performance and success across data sources, and use them to inform decisions Image Here
- 36. Evaluate Customer Retention Determines how basket size impacts retention Analyzed which plan had best retention and designed screen to reflect the best performing plan for customers Understand user retention and influencing factors Use application data to analyze duration and/frequency users are leveraging your platform. Act on results to optimize. Image Here
- 37. A/B Testing A/B email testing analysis for best performing content Send 30% of recipients selection of email titles, and send remaining 70% best performing title to optimize Compare and easily understand results from A/B testing Add statistical significance to tests to ensure that you’re adding the proper rigor to your analysis, and avoid erroneous conclusions. Image Here
- 38. Q&A www.productmanagementtoday.com/webinar-series/modern-product-data-workflows www.projectmanagementupdate.com/webinar-series/modern-product-data-workflows www.businessinnovationbrief.com/webinar-series/modern-product-data-workflows Kate Owens Senior BI Manager, SpotHero Diana Smith Head of Product Marketing, Segment Linkedin:/in/erinfranz Twitter:@LookerData Website: Looker.com Erin Franz Technology Alliances Manager, Looker Megan Bubley Product Manager, SpotHero Linkedin:/in/megan-bubley Twitter:@SpotHero Website: Spothero.com Linkedin:/in/kate-owens-411b5243/ Twitter:@SpotHero Website: Spothero.com Linkedin:/in/dianaharlansmith Twitter:@Segment Website: Segment.com Modern Product Data Workflows Webinar Series