2. 458 Nor Atiqah Aima Roslan et al. / Procedia - Social and Behavioral Sciences 172 (2015) 457 – 462
Iskandar Malaysia is one of the five regional corridors that is more economically vibrant. Logistics is one of the
five identified growth nodes of economy in Iskandar Malaysia (Muhammad et al., 2012). Logistics has become a
significant role in supporting export activities in rapid growth of global market (Banomyong et al., 2011). Logistics
has become effectively as third party logistics service providers due to the particular international logistics services.
According to Banomyong (2011), in order to compete in the logistics market, many freight companies rebranded
themselves into third party logistics (3PL).
However, based on Logistics Performance Index (LPI), Malaysia is at the 28th
rank in the world with range index
of 3.49 in 2012 (Mecometer, 2014; The World Bank, 2014). This shows that Malaysia has lower average index range
compared to Singapore, which is currently at the first rank in the global logistics activity with range index of 4.10.
The reason for this research to be done in Iskandar Malaysia is because it is the nearest location to Singapore compared
to another four regions.
According to Banomyong et al. (2011), logistics service quality plays a significant role in determining customers’
satisfaction, loyalty as long as long-term relationship. There are few researches that had been done for Malaysia
service sectors such as in banking, sales and marketing and logistics. Although there are few researches about logistics
in South East Asia, however, there is lack of research done in logistics services in Malaysia. Based on what had been
stated earlier, this research aims to identify customers’ satisfactions towards third party logistics companies in Iskandar
Malaysia for service enhancement and customer loyalty.
2. Literature reviews and research hypotheses
2.1. Iskandar Malaysia
During Ninth Malaysia Plan, Tun Abdullah Hj Ahmad Badawi has announced the five regional economic corridors
to be initiated, and one of them is Iskandar Malaysia (Muhammad et al., 2012). Services and manufacturing sectors
are the two main pillars of Iskandar Malaysia's economy, but services dominate by contributing about USD 10 billion
in Iskandar Malaysia. Logistics have been one of the committed investments besides manufacturing, properties,
utilities, and tourism. During the Tenth Malaysia Plan, logistics is one of the five identified growth nodes to build
economic pillars together with education, healthcare, finance, creative industry, and tourism.
2.1.1. Logistics
Logistics can be divided into few components which are warehouses, distribution centres and transportation
(Saatçioǧlu et al., 2009; Banomyong et al., 2011; Hellström et al., 2011; Tian et al., 2009). Transportation can be
divided into few types of transport such as cargo, courier, shipping, trucks or lorry, van and etc. (Zubaidah, 2007).
From Logistic Performance Index (LPI) in the year of 2012, Malaysia has an average index range of 3.49 compared
to 3.44 index range in 2010 (Mecometer, 2014; The World Bank, 2014). Malaysia experienced positive growth of
1.45 percentages. Globalisation has made business strategy became a major force during the last two decades. It has
led to an increase of the export trade for many developing countries such as Singapore, Malaysia, and Thailand. In
wider export markets, logistics activities have become a significant role in supporting export activities (Banomyong
et al., 2011). This statement is supported by other researchers such as Saatçioǧlu et al. (2009) where they stated that
globalisation had caused rapid growth of logistics activities especially transportation due to expansion of globalisation
market and global advanced technology that covers supply chain and operations.
Furthermore, Banomyong et al. (2011) said that logistics activities especially transportation plays a significant role
in supporting business expansion especially in export sector. The effectiveness of logistics services has been a critical
issue as it will determine the performance for the particular company. Due to the increasing customer demand, every
company always need to evaluate, change to better, and improving their logistic operations (Gotzamani et al., 2010).
2.1.2. Third party logistics
3. 459Nor Atiqah Aima Roslan et al. / Procedia - Social and Behavioral Sciences 172 (2015) 457 – 462
The increasing demand from traders for international freight logistics services has led to the rapid growth of third
party logistics (3PL) industry (Banomyong et al., 2011). They stated that in order to compete in the logistics market,
many freight companies rebranded themselves into 3PLs. Since each 3PL possesses different characteristics such as
different strengths and weaknesses, the choice of 3PL directly impacts on the efficiency of international logistics
channel.
2.2. Service quality
Quality refers to something whether it is good or not (Zubaidah, 2007). However, there are some opinions that say
the quality of service can be defined from different expectations of users towards the services provided with the
perception of the service received (Munusamy et al., 2010). Quality of a product or service is essential. According to
Fečiková (2004), the customer satisfaction towards the quality of certain services will determine the company’s failure
or success. Furthermore, it also believed that the quality service will determine customers’ loyalty to certain company
and increase profits. Hemmasi et al., (2010) stated that manufacturing firms had their own bench mark and that was
used to compare their goods while service activities do not have these form of analysis because of its inherent
intangible nature. However, there are a few opinions stated that service quality can be interpreted from the difference
of customer expectation towards experienced services and customer perception towards received services (Munusamy
et al., 2010).
2.2.1. SERVQUAL
SERVQUAL by Parasuraman et al. (1985, 1988) defined service quality through the gap between customers’
perception and expectation of company’s service quality performance. For the conclusion, a service quality was built
from expected and desired quality (Baki et al., 2009). Many studies have identified that the SERVQUAL model of
Parasuraman et al., 1985, is the most accurate model to be used in determining the quality of the services offered
(Rauyruen et al., 2007; Banomyong et al., 2011; Baki et al., 2009).
2.2.1.1 SERVQUAL model
Table 1 shows the five crucial dimensions that leads to model of service quality developed and concluded by
Parasuraman et al (1985) and been used by other researchers (Munusamy et al., 2010; Banomyong et al., 2011; and
Ooi et al., 2011).
Table 1. Definitions of SERVQUAL model’s dimensions
Dimensions Definitions
Tangible The element that represents the appearance of the personnel, physical
facilities, equipments and communication materials
Reliability The element of service provider’s abilities to perform the promised
service dependably and accurately.
Responsiveness The element of the ability of the service provider’s to provide
prompt service and the willingness to help customers.
Assurance The element that represents the knowledge and courtesy of service
providers and their ability to convey trust and confidence.
Empathy The element of the ability of the service provider in providing care
and attention individually to each customer.
2.3. Customer satisfaction
Customer satisfaction is a business term that describes the measurement of goods or services provided by the
4. 460 Nor Atiqah Aima Roslan et al. / Procedia - Social and Behavioral Sciences 172 (2015) 457 – 462
company to ensure that their customers’ expectation is achieved (Munusamy et al., 2010). Customers’ satisfaction can
be observed or measured from the result of loyalty customers that continuously using the same service, and in addition,
promote the product or the service to their friends (Feçiková, 2004; Huang, 2008). However, customers’ satisfaction
is very subjective because until this day, there still no researchers who are able to set the demand as well as the
requirements of a service desired by the customers due to its intangibility and different experience of each users (Baki
et al., 2009). Studies from Munusamy et al. (2010) stated that customers’ satisfaction and service quality are closely
related. Their theory is that, the higher quality of service, the higher the customers’ satisfaction.
2.4. Research hypotheses
Based on the literature review, it can be concluded that the hypotheses are as follows.
HO: There is no relationship between customers’ satisfaction and dimensions of third party logistics’ service quality
in Iskandar Malaysia.
HA: There is a relationship between customers’ satisfaction and dimensions of third party logistics’ service quality in
Iskandar Malaysia.
3. Methodology
This research covers the area of Iskandar Malaysia (IM), Johor, Malaysia. Questionnaires will be distributed to the
customers of IM logistics service providers which cover four pillars; Electrical and Electronics, Petro and Oleo
Chemical, Food and Agro Processing, and Tourism. This study is a quantitative study. There are three objectives of
the study that will be focused on. To achieve those objectives, questionnaires will be distributed among the customers
of third party logistics from four pillars which consists of Electric and Electronic, Palm and Oleo Chemical, Tourism,
and Food and Agro Processing within Iskandar Malaysia’s region.
Purposive sampling will be the sampling method to determine the respondents of this study. Based on the telephone
conversation with Iskandar Regional Development Authorities (IRDA), it is estimated that there are 80 000
companies’ lies under Iskandar Malaysia. However, the actual listing is not possible to get it all due to lack of official
directory. Thus, for this research, researcher will use purposive sampling by taking the list of companies from the
website of Johor State Investment Centre (JSIC). The types of sampling chosen under purposive sampling will be
quota sampling. According to Awang (2012), quota sampling is similar to stratified sampling which the process of
selecting sample that represents each stratum in a population. The main reason researcher is using quota sampling is
because to ensure that various subgroups in a population represented in the sample. However, the results of using
nonprobability sampling will not generalize the population (Sekaran et al., 2013).
The researcher will be using Statistical Package for the Social Science (SPSS) to run the data collected. Any results
will be expected to answer those three objectives of this study.
4. Research findings
Based from Parasuraman et al. (1985) SERVQUAL model, there are many researchers using the model and
modified accordingly to their research. There are some modifications to the model regarding different field of study.
For logistics itself, research by Banomyong et al. (2011) is the most accurate modified SERVQUAL model to be used.
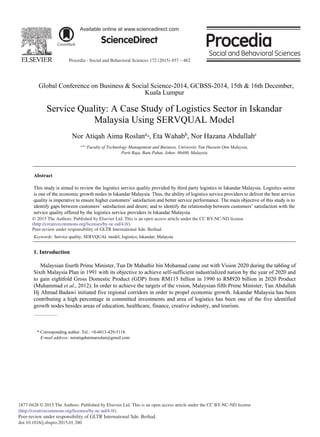
4.1. Conceptual framework
The conceptual framework for this study are as shown in Figure 1 that explains the structure of SERVQUAL model
by Parasuraman et al. (1985), and the added dimension according to Banomyong et al. (2011).
5. 461Nor Atiqah Aima Roslan et al. / Procedia - Social and Behavioral Sciences 172 (2015) 457 – 462
Figure 1. Dimensions of service quality
Source: Adapted from Parasuraman et al. (1985) and used and modified by Banomyong and Supatn, 2011.
5. Conclusions
It is expected that the findings of this research are proven that there are relationships between customers’
satisfaction and dimensions of service quality in Iskandar Malaysia’s logistics service providers. It is also expected
that there are positive gaps exist between the expectation and perception of the customers towards service quality of
Iskandar Malaysia’s logistics service providers.
Acknowledgements
The authors would like to thank University of Tun Hussein Onn Malaysia (UTHM) for supporting this research
under the grant scheme Fudamental Research Grant Scheme (FRGS), Ministry of Education (MOE), grant vot number
(1225). The authors also would like to thank the relevant parties that have directly or indirectly contributed to the
success of this study. The authors also wish to express their gratitude to the anonymous referees for their helpful
comments and sincere suggestions to improve the paper.
References
Awang, Z. (2012). Research Methodology and Data Analysis (2nd Ed). Malaysia: Press UiTM, 80 – 118.
Baki, B., Basfirinci, C. S., Cilingir, Z. & AR Murat, I. (2009). An Application of Integrating SERVQUAL and Kano’s Model Into QFD for Logistic
Services: A Case Study from Turkey, 21(1), 106 – 126.
Banomyong, R. & Supatn, N. (2011). Selecting Logistics Providers in Thailand: A Shippers’ Perspective, 45(3), 419 – 437.
Fečiková, I. (2004). An Index Method For Measurement of Customer Satisfaction, 16(1), 57 - 66.
Gotzamani, K., Longinidis, P. & Vouzas, F. (2010). The Logistics Services Outsourcing Dilemma: Quality Management and Financial Performance
Perspectives, 15(6), 438 – 453.
Hellström, D. & Nilsson, F. (2011). Logistics-driven Packaging Innovation: A Case Study at Ikea, 39(9), 638 – 657.
Hemmasi, M., Strong, K. C. & Taylor, S. A. Measuring Service Quality for Strategic Planning and Analysis in Service Firm. Journal of Applied
Business Research, 10(4), 24 – 34
Huang, W. H. (2008). The Impact of Other-Customer Failure on Service Satisfaction, 19(4), 521 – 536.
Logistics Performance Index (2012). http://mecometer.com/topic/logistics-performance-index-overall/. (12/12/2013)
Muhammad, S., Sulaiman, N. F. C. & Sanusi, N. A. (2012). Innovative Capacity, Human Capital and Its Contribution to Economic Development
in Malaysia.
Munusamy, J., Cselliah, S. & Hor W. M. (2010). Service Quality Delivery and Its Impact On Customer Satisfaction in The Banking Sector in
Malaysia, 1(4).
Ninth Malaysia Plan 2006 – 2010 (2006). Kuala Lumpur: The Motion to Table the Ninth Malaysia Plan.
Ooi, K. B., Lin, B., Tan, B. I. & Chong, A. Y. L. (2011). Are TQM Practices Supporting Customer Satisfaction and Service Quality?. Journal of
6. 462 Nor Atiqah Aima Roslan et al. / Procedia - Social and Behavioral Sciences 172 (2015) 457 – 462
Services Marketing, 25(6), 410 – 419.
Parasuraman, A., Zeithaml, V. A. & Berry L. L. (1985). A Conceptual Model of Service Quality and Its Implications for Future Research. Journal
of Marketing, 49, 41 -50.
Rauyruen, P. & Miller, K. E. (2007). Relationship Quality as a Predictor of B2B Customer Loyalty. Journal of Business Research, 60, 21 – 31.
Rauyruen, P., Miller, K. E. & Barrett, N. J. (2007). Relationship Quality As A Predictor of B2B Customer Loyalty.
Saatçioǧlu, Ö. Y., Dereci, D. A. & Cerit, A. G. (2009). Logistics and Transportation Information Systems in Turkey: E-Government Perspectives,
3(2), 144 – 162.
Sekaran, U. & Bougie, R. (2013). Research Methods for Business (6th Ed). John Wiley & Son Ltd., 252 – 253.
Tenth Malaysia Plan 2011 – 2015 (2010). Putrajaya: The Economic Plan Unit.
The World Bank (2012). http://data.worldbank.org/indicator/LP.LPI.OVRL.XQ. (12/12/2013)
Tian, Y., Ellinger, A. E. & Chen H. (2010). Third-party Logistics Provider Customer Orientation and Customer Firm Logistics Improvement in
China, 40(5), 356 – 376.
Zuraidah (2007). New Oxford English-English-Malay Dictionary. Malaysia: Oxford Fajar Sdn. Bhd