1. WRITING TASK 1
Bước 1: Nhận dạng và phân tích đề bài- xác định thì, chủ ngữ, đơn vị
Bước 2: Viết mở bài và overall
Bước 3: Viết dàn ý 2 body
Bước 4: viết thành câu hoàn chỉnh = Tiếng Việt và chuyển sang Tiếng Anh
LINE GRAPH
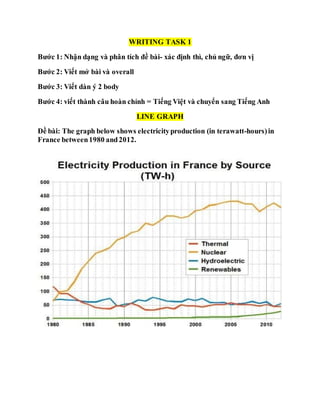
Đề bài: The graph below shows electricityproduction (in terawatt-hours)in
France between1980 and2012.
2. TABLE
The table below shows statistics aboutthe top five countries for international
tourism in 2012 and 2013.
The table below gives information on consumer spending on different items in
five different countries in 2002.
3. PIE CHART
The charts below show household spending patterns in two countries between 1980 and
2008.
You should spend about 20 minutes on this task.
You should write at least 150 words.
4. The pie charts below compare water usage in San Diego, California and the
rest of the world. Summarise the information and Write at least150 words.
6. The chart below shows global sales of the top five mobile phone brands
between 2009 and 2013.
7. MAPS
Quá khứ
The mapsbellow show changesexperienced by the town of Lakesideatthe
beginingof the 21st century. Summarisethe information byselecting and
reporting the mainfeatures, and makecomparisonswhererelevant.
8. Quá khứ và hiện tại
The maps show changes in the village of Meadowside and the town of Fonton from
1962 to now.
Write a report of at least 150 words describing the main features and making
comparisons where relevant.
9.
10. Hiện tại và tương lai
The diagrams below show the existing ground floor plan of a house and a proposed
plan for some building work.
11. MIXED CHART
The pie chart below shows the main reasons why agricultural land
becomes less productive. The table shows how these causes affected three
regions of the world during the 1990s.
13. The diagram shows the life cycle of the honey bee.
Summarize the information by selecting and reporting the main features, and make comparisons
where relevant.