Hot Call Girls |Delhi |Preet Vihar ☎ 9711199171 Book Your One night Stand
Eje eje 201405-0008
1. 649
Introduction
Ecological services
Biodiversity provides several benefits, termed ecologi-
cal or ecosystem services, which are essential for human
survival (Millennium Ecosystem Assessment, 2005). The
continued increase in the human population is accompa-
nied by marked modifications of natural areas resulting in a
reduction in biodiversity, which usually negatively affects
the services provided (Carpenter et al., 2009). Urbanisa-
tion is a major cause of pollution, habitat loss, extinction
and impoverished biodiversity through homogenization
and invasions (McKinney, 2002). However, even if the
consequences of these effects are known, the quantifica-
tion of ecological services is difficult and changes in the
numbers of useful organisms are often used as a proxy for
the level of services they provide (Isbell et al., 2011). The
relationship, however, is not necessarily straightforward,
with additional, controversial aspects linked to sampling,
rarity, intra-guild relationships and the selection of reliable
indicators (Hilty & Merenlender, 2000). Considering the
environmental and economic importance of the well-being
of ecosystem services for humans, it is important to iden-
tify and accurately measure ecosystem services (Layke et
al., 2012; Liss et al., 2013).
Predation
Predation by natural enemies is one of the ecological ser-
vices (de Groot et al., 2002), and changes in the composi-
tion and density of natural enemy groups (usually restrict-
ed to one or a few taxonomic categories) in response to
urbanisation are numerous (Magura et al., 2010). However,
assessing changes in the ecological function of pest control
by natural enemies is neither common nor easy. Attacks by
predators on invertebrate prey are usually cryptic and rare-
ly leave any evidence, making its quantification difficult.
Visual observation may be complicated, and even when
possible, the presence of the observer may affect the activ-
ity of the predators. When other methods are used, such as
examination of gut contents, or radioactive labelling of the
prey, distinguishing between “real” predation and scaveng-
ing or secondary predation is difficult or impossible; the
spread of the radioactive label may also be related to non-
predatory events (Kidd & Jervis, 2007). One way of meas-
uring predation intensity is to use sentinel prey (O’Neal et
al., 2005), which relies on placing prey items in a habitat,
and infers predation pressure from their rate of disappear-
ance. Suitable prey are the immobile stages of insects such
as eggs (Wilson et al., 2004) or pupae (Rowe et al., 2013),
or immobilised insects (e.g. aphids glued on a card, Öst-
man et al., 2001). The disadvantage of this method is that
the prey usually disappears and the identity of the predator
is rarely discernible. Dummy prey can also be used, which
is not removed and the marks of the attempted predation
can be used to identify the predator (Howe et al., 2009).
While it is not usually possible to quantify predation inten-
sity in this way (Brodie, 1993), it is useful for comparing
predation pressure in various habitats (Howe et al., 2009).
Studies often indicate a high predation pressure, especially
in tropical habitats (Loiselle & Farji-Brener, 2002; Posa
et al., 2007; Howe et al., 2009), but there are few records
from the temperate regions; published studies using dum-
Eur. J. Entomol. 111(5): 649–654, 2014
doi: 10.14411/eje.2014.082
ISSN 1210-5759 (print), 1802-8829 (online)
Quantifying predation pressure along an urbanisation gradient in Denmark
using artificial caterpillars
Marco FERRANTE 1
, Alessandro LO CACCIATO 2
and Gabor L. LÖVEI 1
1
Aarhus University, Department of Agroecology, Flakkebjerg Research Centre, Forgøsvej 1, DK-4200 Slagelse, Denmark;
e-mails: marco.ferrante@agrsci.dk; gabor.lovei@agrsci.dk
2
University of Palermo, Faculty of Science, Via Archirafi 28, 90123 Palermo, Italy; e-mail: locacciato-alessandro@live.it
Key words. Carabidae, Formicidae, fragmentation, natural enemies, ecosystem services, predation, urbanisation, sentinel prey
Abstract. Urbanisation results in a marked modification of habitats and influences several ecological processes, some of which give
rise to beneficial ecological services. Natural pest control, the effect of predators on prey is one of such services. We quantified changes
in the incidence of predation with increasing levels of urbanisation using artificial caterpillars made of green plasticine. Potential preda-
tors can be identified by the “attack marks” they leave on these artificial caterpillars. We conducted this study from May to October
2010 around the city of Sorø (Zealand, Denmark), in forests along an urbanisation gradient (rural-suburban-urban). Artificial caterpil-
lars were placed on the ground in order to obtain an estimate of the incidence of predation at ground level. Half (50%) of the 1398 cat-
erpillars were “attacked” and 28.8% of the bites were those of chewing insects. We attributed the majority of these to carabids, the most
common group of ground-active arthropods. Chewing insects exerted the greatest predation pressure in the original forest (52.1%),
with lower values recorded in the suburban (10.1%) and urban (16.4%) forest fragments. Ants were responsible for only 4.7% of the
attacks in forest, 11.3% in suburban and 16.4% in urban forest fragments. Mammals exerted the highest predation pressure in suburban
habitats (22.2% vs. 4.9% in forest, and 8.1% in urban forest fragments).
2. 650
eyespots (Hossie & Sherratt, 2012). The 115 baits per sampling
occasion were fixed to a suitable substrate lying on the ground
(i.e. a dead leaf or dry branch) using super glue, exposed for
24 h, after which they were examined in the field using a hand-
held magnifying glass (12 ×). Chewing insects left characteristic
mandible marks, ants numerous fine mandible marks, and small
mammals their tooth marks (Fig. 1). Birds left characteristic beak
marks (not illustrated). These marks were usually recognisable
in the field, but in case of doubt, additional inspection was made
in the laboratory using a stereomicroscope (Leica MS5, 0.63–4 ×
magnification).
Data analysis
The study period was divided into three seasons (spring, sum-
mer and autumn) following the “quartile method” by Fazekas et
al. (1997). The number of caterpillars collected in each season
was comparable (491, 456 and 451, respectively). When a cat-
erpillar was bitten by more than one type of predator, it was in-
cluded as two independent predation events. Multiple marks by
the same type of predator were categorised as a single predation
event. A few (n = 28, 2.0%) caterpillars were lost; we were un-
able to identify the predator in 1.9% of the attacks. Due to their
low values, data on predation by birds and unknown predators (n
= 30) were not analysed as a separate category, resulting in the
1368 caterpillars included in the analysis. We tested the probabil-
ity of survival along the urbanisation gradient using the site as a
random component in a generalized linear mixed model, calcu-
lated using the package “lme4” in R version 3.0.2 (R Core Team,
2013). As the random component did not affect the model, we re-
duced and adapted it to a logistic regression with “binomial” error
distribution (link = logit). Subsequently we checked if outliers or
collinearity affected the model using the package “car”. Graphs
were made using the “lattice” package (Sarkar, 2008).
Results
General results
Of the 1398 artificial caterpillars, 50% were attacked by
predators. Chewing insects other than ants were responsi-
ble for 26.8% of the attacks on the artificial caterpillars.
The other main predators were small mammals (with an
my prey usually focus on predation by birds (e.g. Mäntylä
et al., 2008).
Aims
Urbanisation affects the diversity and density of vari-
ous groups of predators, including birds (Chace & Walsh,
2006), ground beetles (Magura et al., 2010) and spiders
(Alaruikka et al., 2002; Horvath et al., 2012). However,
it can only be speculated what the consequences of these
structural changes on ecological functioning might be. In
order to better understand the consequences of increas-
ing urbanisation on the natural incidence of predation by
ground active predators, we used the dummy caterpillar
method (Howe et al., 2009) along an urbanisation gradi-
ent in Denmark. As natural habitats may offer better condi-
tions (i.e. favourable temperature regimes, natural refuges)
for predators we tested the hypothesis that the incidence
of predation will diminish along a gradient of increasing
urbanisation, with the highest rates recorded in forest, and
lowest in patches of forest in urban parks, which corre-
sponds to Gray’s increasing disturbance hypothesis (Gray,
1989).
Materialand Methods
Study area
Our study area was in and around the city of Sorø (55°26´N;
11°34´E; UTM: PG64), 80 km south-west of Copenhagen (Zea-
land, Denmark), along an urbanisation gradient selected according
to the Globenet protocol (Elek & Lövei, 2005). The urbanisation
gradient included rural, suburban and urban areas, each of which
originated from a primary forest of beech (Fagus sylvatica) and
was characterized by an increasing built-up area (0%-20%-40%)
but no difference in soil characteristics (Howe & Engaard, 2006).
The rural area (160 ha) was ca. 3 km west of the town centre, bor-
dered by Lake Sorø and almost completely dominated by beech,
that persisted, although gradually decreasing in abundance in the
other habitats. Small patches of pine (Pinus sylvestris) and other
deciduous trees occurred near the forest roads. The seasonal un-
derstory of herbaceous plants consisted of Anemone silvestris, A.
ranunculoides, and Leucojum vernum. The suburban area (30 ha)
was originally a wet forest area, now under forestry management,
and close to an old cemetery. The urban area (25 ha), located 4
km from the suburban area, was an isolated park adjacent to the
lake visited by many people during the year. Here the incidence
of beech was lower; other trees, mostly yew (Taxus baccata) and
silver lime (Tilia argentea) were more common. In each stage of
the gradient, we selected four sites, each at ≥ 50 m from the next,
which were further subdivided into two patches, 20 m apart. A
prey patch had five individual caterpillars placed 5 m apart, which
amounts to a total of 115 caterpillars per sampling occasion (the
only exception was one site in the urban forest fragment, which
had only one prey patch instead of two) and 1426 caterpillars
during the course of this experiment. This was repeated thirteen
times at approximately fortnightly intervals from the end of April
until the end of October 2010.
The dummy caterpillar method
The artificial caterpillars were made of light green plasticine
(Smeedi plus, V. nr. 776609, Denmark), using a modified garlic
press, which produced a cylindrical shape (Howe et al., 2009),
but 15 mm long and 3 mm thick as used by Tvardikova & No-
votny (2012). Green colour was chosen because predators react
to aposematic warning colouration or defensive signals, such as
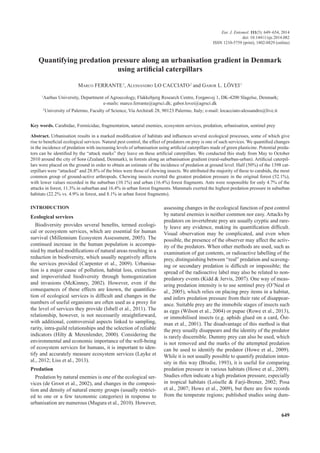
Fig. 1. Marks made by different predators on artificial caterpil-
lars: “a” and “b” – chewing insects, “c” – ants, “d” – mammal.
The pictures “a”, “b” and “c” were taken using a digital colour
microscope camera Leica DFC450 and “d” a Canon Ixus 60 cam-
era.
3. 651
overall “predation rate” of 12.1%), ants (10.5%), and birds
(0.43%).
Predation along the urbanisation gradient
There were different incidences in the predation of the
artificial caterpillars by the different predators in the differ-
ent stages of urbanisation (Fig. 2). In the forest, the cater-
pillars were mostly attacked by chewing insects (52.1%);
ants (4.7%) and small mammals (4.9%) had a low rate of
attack. In the fragments of forest in suburban areas the
most common marks found belonged to small mammals
(22.2%), followed by ants (11.3%), and chewing insects
(10.1%). In the patches of forest in urban parks, marks in-
flicted by ants (16.4%) and chewing insects (16.4%) were
more common than those made by small mammals (8.1%).
The seasonal incidence of predation by each of the preda-
tors in these different habitats differed (Fig. 3). The inci-
dence of predation by chewing insects in the forest habitats
increased from spring to autumn. That of small mammals
in the suburban area was highest in summer, followed by
a decline during autumn, and that of ants in the urban area
highest in spring, after which it gradually declined. The
level of urbanisation affected the probability of being at-
tacked. Caterpillars were significantly more likely to be
attacked in the forest than in either of the two other stages
of urbanisation (odds ratio = 2.19, 95% CI = 1.92–2.46
and odds ratio = 1.93, 95% CI = 1.68–2.18, respectively,
p < 0.001 for both). There was no significant difference in
predation pressure between the suburban vs. urban areas.
The stage of urbanisation and season had a significant ef-
fect on caterpillar “survival” (Table 1), with higher values
recorded in urban and suburban areas than in forest (value
= 0.801, p = 0.000 and value = 0.670, p = 0.000, respec-
tively).
Predation during the season
When the stage of urbanisation was not taken into con-
sideration, the incidence of predation by each of the main
types of predator varied little from spring to autumn (Fig.
4). Marks made by ants and mammals were usually more
frequently recorded during spring and summer than in au-
tumn, while for chewing insects, the frequency was higher
Fig. 2. Percentage predation recorded for the three main preda-
tor groups (ants, chewing insects, mammals) along an urbanisa-
tion gradient at Sorø, Denmark, 2010.
Fig. 3. Percentage predation recorded for the three main preda-
tor groups (ants, chewing insects, mammals) along an urbanisa-
tion gradient in three seasons at Sorø, Denmark, during 2010.
The seasons are indicated on the horizontal axes and urbanisation
stage inside each box.
Table 1. The effect of the level of urbanisation on the inci-
dence of “predation” on artificial caterpillars at Sorø, Denmark,
during spring-autumn of 2010, analysed using a generalized lin-
ear model. Incidence of predation in the forest and during autumn
served as bases for comparison.
Value S.E. Z value Significance
(Intercept) –0.315 0.121 –2.596 0.009
Suburban 0.670 0.131 5.104 0.000
Urban 0.801 0.137 5.848 0.000
Spring 0.225 0.134 1.682 0.093
Summer –0.481 0.136 –3.536 0.000
Fig. 4. Percentage predation recorded for the three main preda-
tor groups (ants, chewing insects, mammals) in the three seasons
studied at Sorø, Denmark, 2010.
4. 652
in summer and autumn than spring (Table 2). However,
when the stage of urbanisation was considered, the inci-
dence of predation by the different predators during the
year differed (Fig. 3). Survival was significantly affected
by season, being lowest in summer (value = –0.481, p =
0.000) and slightly higher in spring (value = 0.225, p =
0.093) than in autumn.
Discussion
Although there are records in the literature of the inci-
dence of predation at ground level in a temperate region
(Sipos et al., 2012), there is no information on the inci-
dence of predation by different guilds of predators. Most
of the studies carried out in the northern hemisphere using
dummy prey have focused on predation by birds, with some
studying defensive mechanisms such as countershading
(Speed et al., 2005; Rowland et al., 2007). In our study we
did not focus on any particular predator, but exploited the
characteristic signs left by different predators in the malle-
able surface of the artificial caterpillars. The most common
marks were those made by ground-active insects, ants and
small mammals. The highest incidence of predation was
by ground-active insects, as is recorded in other studies us-
ing artificial caterpillars (Faveri et al., 2008; Howe et al.,
2009; Tvardikova & Novotny, 2012). We believe that most
of the chewing insect bites were made by ground beetles
(Carabidae), the most common predators in the area (Elek
& Lövei, 2007). There were remarkably few attacks by
birds, which are commonly recorded in tropical areas (Loi-
selle & Farji-Brener, 2002; Howe et al., 2009). However,
these studies, although using artificial caterpillars, were
carried out in different habitats using different arrange-
ments (artificial caterpillars were fixed to leaves and not
on the ground), and therefore differences in the incidence
of predation may reflect different hunting strategies (Mar-
tin, 1987). Nevertheless, in our study, risk of predation was
generally high, and this may have influenced habitat selec-
tion by potential prey. It is unknown whether potential prey
can assess this risk and whether it influences their behav-
iour. We expected that due to the many different predators
in forest areas, the highest incidence of predation would be
recorded there, but this prediction was only partially sup-
ported. We found differences in the incidence of predation
along the urbanisation gradient. In particular, the incidence
of predation by ants and mammals was lowest in forest,
despite the lower anthropogenic disturbance there, indi-
cating that some predators may be favoured by human ac-
tivities. However, like the trend in diversity and density of
different taxonomical groups along urbanisation gradients
(Magura et al., 2008), the effects of human disturbance on
the incidence of predation may be related to the feeding or
habitat preference of the guilds of predators studied. We re-
corded considerable differences in the incidence of preda-
tion when both season and stage of urbanisation were con-
sidered. This may indicate that abiotic factors differently
influence the ecological services recorded in the different
stages of urbanisation. Judged by the incidence of preda-
tion, suburban areas were favoured by small mammals in
all the seasons studied. The same was true for chewing in-
sects in forest and ants in urban areas, with the exception of
spring and autumn, respectively. While the method is easy
to use and useful in several situations (Howe et al., 2009),
further refinements are needed. It is important to determine
the optimal placement of the sentinel prey, and enlarge the
catalogue of the different marks to identify a larger number
of potential predators. For measuring ecological services in
habitats subject to anthropogenic effects, it is important to
control and quantify the conditions and intensity of these
processes when assessing the effects of humans on non-
human city dwellers, and develop countermeasures to pre-
serve the irreplaceable services provided by biodiversity.
Acknowledgements. We thank the Sorø Akademi Stilf-
telse for permission to work on their land, J. Thomsen and A.
Grube, for their assistance and support, A. Agüera, J. Halley and
N. Holst for their comments. This is publication no. 9 of the Dan-
globe Project. Author contributions: study was designed by GL,
with contributions by MF, AL; field work was performed by MF,
AL, and GL; data analysis MF, GL, AL, writing of the paper: MF,
GL, with comments from AL.
Table 2. The number of artificial caterpillars attacked along the urbanisation gradient in three seasons by each category of predator:
“ants”, “ground-active insects” and “small mammals”. Note that if an artificial caterpillar was attacked by more than one type of preda-
tor, it was counted in both categories.
Habitat/season
The number of artificial caterpillars attacked by No. of “unhurt”
artificial caterpillars
Total number of artificial
caterpillars exposed
Ants Ground-active insects Small mammals
Forest 23 256 24 199 491
Spring 11 51 7 104 173
Summer 8 89 5 64 166
Autumn 4 116 12 31 163
Suburban 55 49 108 276 486
Spring 25 14 38 96 173
Summer 24 19 48 67 158
Autumn 6 16 22 113 157
Urban 69 69 36 252 421
Spring 32 10 14 91 147
Summer 33 33 14 62 142
Autumn 4 26 8 99 137
Grand Total 147 374 168 727 1398
5. 653
References
Alaruikka D., Kotze D.J., Matveinen K. & Niemelä J. 2002:
Carabid beetle and spider assemblages along a forested urban-
rural gradient in southern Finland. — J. Insect Conserv. 6:
195–206.
Brodie E.D. 1993: Differential avoidance of coral snake banded
patterns by free-ranging avian predators in Costa-Rica. —Evo-
lution 47: 227–235.
Carpenter S.R., Mooney H.A.,Agard J., Capistrano D., DeFries
R.S., Diaz S., Dietz T., Duraiappah A.K., Oteng-Yeboah A. &
Pereira H.M. 2009: Science for managing ecosystem services:
Beyond the Millennium Ecosystem Assessment. — Proc. Nat.
Acad. Sci. USA 106: 1305–1312.
Chace J.F. & Walsh J.J. 2006: Urban effects on native avifauna:
a review. — Landsc. Urban Plann. 74: 46–69.
Churchfield S., Hollier J. & Brown V. 1991: The effects of small
mammal predators on grassland invertebrates, investigated by
field exclosure experiment. — Oikos 60: 283–290.
de Groot R.S., Wilson M.A. & Boumans R.M.J. 2002: A typol-
ogy for the classification, description and valuation of ecosys-
tem functions, goods and services. — Ecol. Econ. 41: 393–408.
Elek Z. & Lövei G. 2005: Ground beetles (Coleoptera, Carabi-
dae) assemblages along an urbanisation gradient near Soro,
Zealand, Denmark. — Entomol. Medd. 73: 115–121.
Elek Z. & Lövei G.L. 2007: Patterns in ground beetle (Coleo
ptera: Carabidae) assemblages along an urbanisation gradient
in Denmark. — Acta Oecol. 32: 104–111.
Faveri S.B., Vasconcelos H.L. & Dirzo R. 2008: Effects of Ama-
zonian forest fragmentation on the interaction between plants,
insect herbivores, and their natural enemies. — J. Trop. Ecol.
24: 57–64.
Fazekas J., Kadar F., Sarospataki M. & Lövei G.L. 1997: Sea-
sonal activity, age structure and egg production of the ground
beetle Anisodactylus signatus (Caleoptera: Carabidae) in Hun-
gary. — Eur. J. Entomol. 94: 473–484.
Gray J.S. 1989: Effects of environmental-stress on species rich
assemblages. — Biol. J. Linn. Soc. 37: 19–32.
Hawes C., Stewart A. & Evans H. 2002: The impact of wood ants
(Formica rufa) on the distribution and abundance of ground
beetles (Coleoptera: Carabidae) in a Scots pine plantation. —
Oecologia 131: 612–619.
Hawes C., Evans H.F. & Stewart A.J. 2013: Interference compe-
tition, not predation, explains the negative association between
wood ants (Formica rufa) and abundance of ground beetles
(Coleoptera: Carabidae). — Ecol. Entomol. 38: 315–322.
Hilty J. & Merenlender A. 2000: Faunal indicator taxa selec-
tion for monitoring ecosystem health. — Biol. Conserv. 92:
185–197.
Horváth R., Magura T. & Tóthmérész B. 2012: Ignoring eco-
logical demands masks the real effect of urbanization: a case
study of ground-dwelling spiders along a rural-urban gradient
in a lowland forest in Hungary. — Ecol. Res. 27: 1069–1077.
Hossie T.J. & Sherratt T.N. 2012: Eyespots interact with body
colour to protect caterpillar-like prey from avian predators. —
Anim. Behav. 84: 167–173.
Howe A. & Engaard M. 2006: Ground Beetles and Urbanisation.
BSc Thesis, Roskilde University, Denmark, 62 pp.
Howe A., Lövei G.L. & Nachman G. 2009: Dummy caterpillars as
a simple method to assess predation rates on invertebrates in a
tropical agroecosystem. — Entomol. Exp. Appl. 131: 325–329.
Kidd N.A. & Jervis M.A. 2007: Population dynamics. In Jervis
M.A. (ed.): Insects as Natural Enemies: A Practical Perspec-
tive. Springer, Dordrecht, pp. 435–523.
Isbell F., Calcagno V., Hector A., Connolly J., Harpole W.S.,
Reich P.B., Scherer-Lorenzen M., Schmid B., Tilman D., van
Ruijven J., Weigelt A., Wilsey B.J., Zavaleta E.S. & Loreau
M. 2011: High plant diversity is needed to maintain ecosystem
services. — Nature 477: 199–202.
Layke C., Mapendembe A., Brown C., Walpole M. & Winn J.
2012: Indicators from the global and sub-global Millennium
Ecosystem Assessments: An analysis and next steps. — Ecol.
Indic. 17: 77–87.
Liss K.N., Mitchell M.G., MacDonald G.K., Mahajan S.L.,
Méthot J., Jacob A.L., Maguire D.Y., Metson G.V.S., Ziter C.
& Dancose K. 2013: Variability in ecosystem service measure-
ment: a pollination service case study. — Front. Ecol. Environ.
11: 414–422.
Loiselle B.A. & Farji-Brener A.G. 2002: What’s up? An experi-
mental comparison of predation levels between canopy and
understory in a tropical wet forest. — Biotropica 34: 327–330.
Lövei G.L. & Sunderland K.D. 1996: Ecology and behavior of
ground beetles (Coleoptera: Carabidae). — Annu. Rev. Ento-
mol. 41: 231–256.
Magura T., Tóthmérész B., Hornung E. & Horváth R. 2008: Ur-
banization and ground-dwelling invertebrates. In Wagner L.N.
(ed.) Urbanization: 21st Century Issues and Challenges. Nova
Science Publishers, New York, pp. 213–225.
Magura T., Lövei G.L. & Tóthmérész B. 2010: Does urbaniza-
tion decrease diversity in ground beetle (Carabidae) assem-
blages? — Global Ecol. Biogeogr. 19: 16–26.
Martin T.E. 1987: Artificial nest experiments: effects of nest ap-
pearance and type of predator. — The Condor 89: 925–928.
Mäntylä E., Alessio G.A., Blande J.D., Heijari J., Holopainen
J.K., Laaksonen T., Piirtola P. & Klemola T. 2008: From
plants to birds: higher avian predation rates in trees responding
to insect herbivory. — PlosOne 3: e2832.
McKinney M.L. 2002: Urbanization, biodiversity, and conserva-
tion. — Bioscience 52: 883–890.
Millennium Ecosystem Assessment 2005: Ecosystems and Hu-
man Well-being: Synthesis. Island Press, Washington, DC, 155
pp.
O’Neal M.E., Zontek E.L., Szendrei Z., Landis D.A. & Isaacs
R. 2005: Ground predator abundance affects prey removal in
highbush blueberry (Vaccinium corymbosum) fields and can be
altered by aisle ground covers. — BioControl 50: 205–222.
Östman O., Ekbom B. & Bengtsson J. 2001: Landscape hetero-
geneity and farming practice influence biological control. —
Basic Appl. Ecol. 2: 365–371.
Parmenter R.R. & MacMahon J.A. 1988: Factors influencing
species composition and population sizes in a ground beetle
community (Carabidae): predation by rodents. — Oikos 52:
350–356.
Posa M.R.C., Sodhi N.S. & Koh L.P. 2007: Predation on artificial
nests and caterpillar models across a disturbance gradient in
Subic Bay, Philippines. — J. Trop. Ecol. 23: 27–33.
R Core Team 2013: R: A Language and Environment for Statisti-
cal Computing. R Foundation for Statistical Computing, Vi-
enna, Austria. URL http://www.R-project.org/
Rowe R.L., Goulson D., Doncaster C.P., Clarke D.J., Taylor
G. & Hanley M.E. 2013: Evaluating ecosystem processes in
willow short rotation coppice bioenergy plantations. — Glob.
Change Biol. Bioen. 5: 257–266.
Rowland H.M., Speed M.P., Ruxton G.D., Edmunds M., Stevens
M. & Harvey I.F. 2007: Countershading enhances cryptic pro-
tection: an experiment with wild birds and artificial prey. —
Anim. Behav. 74: 1249–1258.
Sarkar D. 2008: Lattice: Multivariate Data Visualization with R.
Springer, New York, 268 pp.
6. 654
Sipos J., Drozdova M. & Drozd P. 2012: Effect of canopy open-
ness on the pressure of predatory arthropods and birds on epi-
geic insects. — Centr. Eur. J. Biol. 7: 1021–1029.
Speed M.P., Kelly D.J., Davidson A.M. & Ruxton G.D. 2005:
Countershading enhances crypsis with some bird species but
not others. — Behav. Ecol. 16: 327–334.
Tvardikova K. & Novotny V. 2012: Predation on exposed and
leaf-rolling artificial caterpillars in tropical forests of Papua
New Guinea. — J. Trop. Ecol. 28: 331–341.
Wilson A.P., Hough-Goldstein J.A., Vangessel M.J. & Pesek
J.D. 2004: Effects of varying weed communities in corn on Eu-
ropean corn borer, Ostrinia nubilalis (Hubner) (Lepidoptera:
Crambidae), oviposition, and egg mass predation. — Environ.
Entomol. 33: 320–327.
Received January 31, 2014; revised and accepted June 12, 2014
Prepublished online September 12, 2014