Download as PDF, PPTX


![© 2017 InfluxData. All rights reserved.7
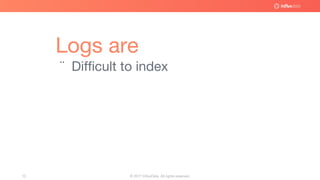
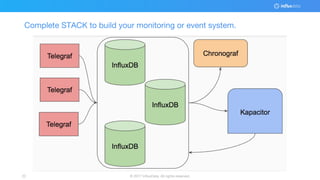
2016/04/15 15:42:46 [warn] 2330#0: *167 using uninitialized variable,
client: 10.0.1.1, server: localhost.dev, request: "POST /auth HTTP/1.1",
host: "localhost"
2016/04/15 15:44:44 [error] 2330#0: *171 FastCGI sent in stderr: "
PHP message: PHP Fatal error: Uncaught exception
'RuntimeException' with message 'All broken)[500]'
in /var/www/my/project.php:237
Stack trace:
#0 /var/www/index.php:45 ObjectService->flush()
#1 [internal function] ->save()](https://image.slidesharecdn.com/monitoryourapplicationandsleep-170529121525/85/Monitor-your-application-and-sleep-7-320.jpg)

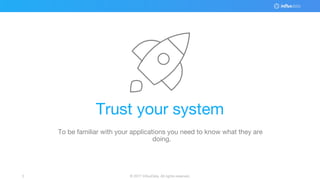
![© 2017 InfluxData. All rights reserved.15
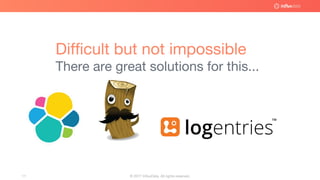
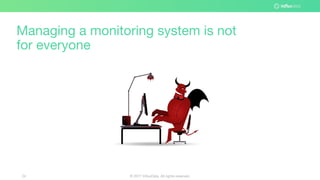
[
{
"name": "log_lines",
"columns": ["time", "line"],
"point": [1400425947368, "here's some useful log info"]
}
]
I am here to speak about time series](https://image.slidesharecdn.com/monitoryourapplicationandsleep-170529121525/85/Monitor-your-application-and-sleep-15-320.jpg)
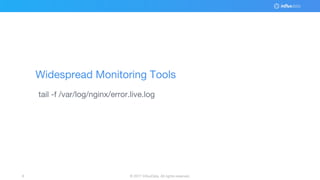
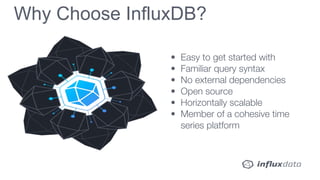
![© 2017 InfluxData. All rights reserved.16
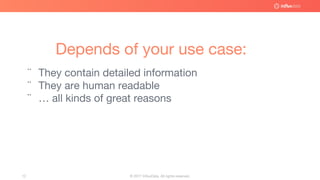
{
"name": "cpu_percent_use",
"columns": ["time", "value"],
"point": [1400425947368, 40]
}
Simplicity is everywhere](https://image.slidesharecdn.com/monitoryourapplicationandsleep-170529121525/85/Monitor-your-application-and-sleep-16-320.jpg)


The document discusses a modern open-source monitoring system for applications, emphasizing the importance of logging, time series data, and efficient management of resources. It highlights the advantages of using tools like InfluxDB, which offer simplicity, scalability, and a familiar query syntax. The piece concludes by acknowledging the challenges of managing such systems and invites questions from the audience.


![Paul Dix [InfluxData] The Journey of InfluxDB | InfluxDays 2022](https://cdn.slidesharecdn.com/ss_thumbnails/2022-11-02influxdays-journeyofinfluxdb-221020214252-ff7c76c5-thumbnail.jpg?width=640&height=640&fit=bounds)
![Paul Dix [InfluxData] | InfluxDays Opening Keynote | InfluxDays Virtual Exper...](https://cdn.slidesharecdn.com/ss_thumbnails/2020-11-10influxdays-introducinginfluxdbiox-201110182839-thumbnail.jpg?width=640&height=640&fit=bounds)


![Tim Hall [InfluxData] | InfluxDB Roadmap | InfluxDays Virtual Experience Lond...](https://cdn.slidesharecdn.com/ss_thumbnails/influxdb-roadmap-tim-hall-200623173849-thumbnail.jpg?width=640&height=640&fit=bounds)


