1. UKexcellence 13
case study
T
he Pisa plant is Saint-Gobain
Glass’s (SGG) oldest glass
manufacturing facility outside
France. It was created in
1889 and as Mr Casarosa, the
plant’s director, says: “It has a huge amount
of know-how and complexity.” Over the
years the product range has extended
from flat glass to a wide range of special
transformation products, such as coated or
patterned glass. As product differentiation
grew so has the amount of inventory held
to service the Italian and export markets.
There was a big increase in the number
of stock keeping units, with products of
different colours, thicknesses, coatings and
sizes. Now, in addition to two warehouses
on site for finished and semi-finished
goods, satellite warehouses in northern
and southern Italy help ensure customer
demand is satisfied.
However, the plant’s expansion has not
been smooth. The old sprawling site is
close to Pisa’s historic city centre and there
was no room for expansion. The challenge
was to find a way of dramatically reducing
the extent of the inventory to provide space
for the installation of a new coater and al-
low the sale of surplus land to pay for it.
Glass production lines are very big − up
to 800 metres in length. Changing from
one product to another is not easy. Quality
demands are exacting and slowing down
or speeding up a production line is very
difficult.“Once in specification keep run-
ning” was the manufacturing mantra. On
top of this, customers have short lead times
and demand is not easy to predict. Because
manufacturing lead times were greatly in
excess of customer lead times the supply
chain strategy was to stock against forecast
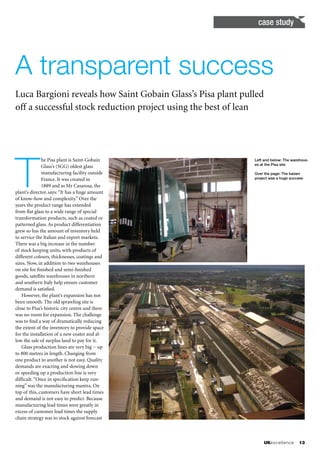
A transparent success
Luca Bargioni reveals how Saint Gobain Glass’s Pisa plant pulled
off a successful stock reduction project using the best of lean
Left and below: The warehous-
es at the Pisa site
Over the page: The kaizen
project was a huge success
2. 14 UKexcellence
case study
demand. This caused significant tension
between manufacturing, sales and produc-
tion planning.
SGG has a world-class manufacturing
improvement programme that is based on
lean six sigma methods and tools. Howev-
er, at the time of the expansion it was still
very much in its infancy. In preparation
for the expansion, Luca Bargioni, SGG’s
Italian quality manager, led the programme
with external support from Andy Liddle
of Process Insight Consulting. An across
the board percentage inventory reduction
was unlikely to succeed – previous stock
reduction efforts had resulted in temporary
reductions followed by unexpected stock
outs and then a gradual drift back to high
stocking levels. However, by applying a
range of lean techniques and data analysis,
the Pisa site was able to reduce inventory
levels by more than 20% and the stor-
age area by more than 30% without any
adverse customer impact, with validated
savings of €600,000.
The lean approach
Time spent on reconnaissance is seldom
wasted and an initial evaluation of the
situation was essential. It was necessary
to build up a better picture of the plant’s
“as is” situation. Paolo Sartini, logistics
manager, explains: “Production at Pisa is
based on float, coated, laminated, mirrored
and pattern glass. There are 1,200 differ-
ent stock keeping units that are regularly
sold with a mean 2.5 tonne unit size. A
high stock level enables the plant to react
promptly to customer demand.”
This situation generated several ques-
tions: Where is the inventory? What are
the main flows through the site? Are
all products the same? Paolo was a key
member of a small team, whose task was
to build a high-level value stream map
of the site’s main product flows and then
understand the days of sales of inventory
down for each value stream. To do this it
was necessary to get a better understanding
of the product families, identify the value
streams and look at the demand volumes
and variability.
Most of the data was available but not in
a useful form. Sales data and semi-finished
and finished product stock data were held
in different places and none was aligned
to the value streams. Using data analysis
software it was possible to quickly extract,
clean and manipulate the data and start to
build the picture that identified the main
problem areas on which to focus.
However, a deep understanding of root
causes and the implementation of sus-
tained change are only possible if the whole
organisation is engaged. Starting with the
leadership, it was essential to get alignment
on the goal and to build understanding
and ownership so that they could support
the changes that would be necessary. And
at this stage the team had no idea why
these particular value streams and product
families had such high inventory levels.
The technique used to engage staff
was a three-day project selection kaizen
event. The leadership team and all the key
functional heads from across the site par-
ticipated in a facilitated workshop. After an
initial explanation of the goal and bound-
aries of the project the team built a map of
the main steps of the key processes using
post-it notes. Lean concepts and tools were
introduced and just-in-time and rough-cut
data was added. Everyone knew their own
bit of the process but by building maps
they were able to see the overall end-to-end
process for the first time.
All the participants then marked up ar-
eas of waste, such as defects, recycle loops,
waiting, inventory and hassle, on the map.
By the end of day one it was possible to see
the problem processes that were contribut-
ing to high inventory levels. These were:
• Sales order forecasting and production
planning
• Tortuous product flows (semi-finished
and finished) within the plant and
warehouses for two product families of
transformed products
• Warehouse order preparation and
loading.
The team then split into four parallel
streams to develop four more detailed
value stream maps for these areas. Prob-
lem areas were again studied and a total
of 70 improvement opportunities were
identified. These ranged from “just do it”
through to kaizen and six sigma projects.
The activities to reduce inventory levels
and the floor area required were grouped
into three main improvement projects:
• Warehouse stock reduction
• Warehouse layout
• Loading bay.
By the end of the three-day event, these
projects were chartered, team leaders and
team members were established, enthusi-
astic, relevant sponsors from the leader-
ship team were appointed and the next
steps agreed. The whole process had been
very successful in meeting its objectives of
identifying root causes, getting alignment
and building leadership understanding
and support for the changes that would be
necessary.
Implementation
The objective of the warehouse stock
reduction project was to identify 7,500
tonnes of stock that could be safely
reduced. Products were grouped into
runners, repeaters and specials categories.
Production planning cycles were then opti-
mised in terms of product sequencing and
manufacturing frequency.
Soundly-based stock levels for each
product were derived by modelling the
impact of production planning cycles and
supply and demand volatility. Buffer levels
were calculated statistically and 7,500
tonnes of surplus stock were identified
along with a disposal plan to work off the
excess over a six-month period.
The objective of the warehouse layout
project was to liberate a set amount of
floor space in addition to that achieved by
the stock reduction project. Spaghetti dia-
grams and value stream map analyses were
used to identify excess transport and han-
dling operations. Once the flows through
the plant were understood it was possible
to make big improvements. Storage areas
were then defined for intermediate and
finished products and simple systems put
in place to control movements. Not only
was the 30% floor area target met, but the
overall workload involved in operating the
warehouse was reduced.
Thirdly, the clear objective of the load-
ing bay project was to improve loading
“
”
Starting with the
leadership, it was essential
to get alignment on the
goal and to build under-
standing and ownership
so that they could support
the changes
3. UKexcellence 15
case study
bay organisation, process and layout in
order to speed up the loading process by at
least 30%. The planned move of the coater
would result in the loss of one loading bay.
As Massimo Grazian, warehouse manager,
said: “Due to the loss of this loading bay
the plant would have to move from a day
only operation to adding a night shift and
go to 24-hour shipping, which would be
very expensive.”
Using a combination of spaghetti
diagrams, process stapling, single message
exchange or die and waste walks, the team
was able to eliminate unnecessary work,
to substantially increase the proportion of
external work and then to greatly simplify
the loading process.
These three improvement projects were
implemented over a nine-month period.
Surplus stock was gradually reduced as
the effects of the newly calculated prod-
uct stock limits and production plan-
ning changes worked through. The new
warehouse layout and product flows were
implemented and refined further by the
teams. Kaizen events helped to generate
more operator engagement and enhance
the effectiveness of the solution. 5S was
already well established at the Pisa site and
this, along with the application of some vi-
sual factory techniques, helped to underpin
the new standard process.
The warehousing and logistic operation
was progressively consolidated; external
warehouses were vacated and the second
site warehouse was emptied leaving just the
one warehouse onsite to successfully ser-
vice the entire Italian market. Meanwhile,
the loading operation was running very
smoothly and matching customer demand.
Reaping the benefits
The business benefits included a reduction
of working capital and cost of inventory.
Mr Casarosa explains: “The team mem-
bers worked very well together, identifying
unexpected solutions and applying lean
techniques. Results were much higher
than expected with savings validated at
€600,000. In addition the surplus real
estate was successfully sold.”
However there were also other, less
tangible, benefits that were nevertheless of
enormous value. Leadership understanding
and involvement were excellent and leaders
are now enthusiastic advocates and spon-
sors of further continuous improvement
activities across the site.
Engaging and involving the leadership
team from the very start of the project was
essential for alignment and ownership,
even though getting the team for three
full days was not easy. Through this direct
involvement, leadership understanding was
greatly enhanced, which in turn allowed
the team to provide excellent support for
this and future projects.
Establishing momentum on a big site
such as Pisa is like launching a rocket. You
need sufficient boosters to get you into
orbit. Having four external facilitators
available at the launch allowed the site
to sustain a number of work fronts and
achieve momentum. Change is not just
something for management. Everyone can
and should get involved and this can only
be achieved by providing plenty of support
and encouragement.
“Going back and walking around the
plant six months after the kick off meet-
ing, the difference was fantastic,” said Andy
Liddle.“Everyone wanted to demonstrate
what they had achieved and provide ideas
for further improvement. There was real
enthusiasm and determination to imple-
ment them. This is what successful lean
projects are all about.”