
Recommended
More Related Content
What's hot
What's hot (19)
Similar to NECS Sustain Tools
Similar to NECS Sustain Tools (20)
Recently uploaded
Recently uploaded (15)
NECS Sustain Tools
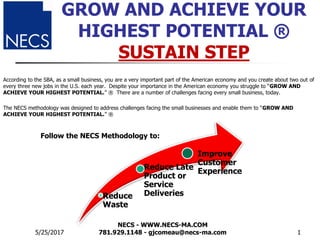
- 1. GROW AND ACHIEVE YOUR HIGHEST POTENTIAL ® SUSTAIN STEP According to the SBA, as a small business, you are a very important part of the American economy and you create about two out of every three new jobs in the U.S. each year. Despite your importance in the American economy you struggle to “GROW AND ACHIEVE YOUR HIGHEST POTENTIAL.” ® There are a number of challenges facing every small business, today. The NECS methodology was designed to address challenges facing the small businesses and enable them to “GROW AND ACHIEVE YOUR HIGHEST POTENTIAL.” ® 5/25/2017 NECS - WWW.NECS-MA.COM 781.929.1148 - gjcomeau@necs-ma.com 1 Reduce Waste Reduce Late Product or Service Deliveries Improve Customer Experience Follow the NECS Methodology to:
- 2. Following the NECS FAST® Methodology: results are possible within 3 to 14 days and continued benefits can be achieved for weeks and months into the future. NECS FAST® uses a nine- step problem solving process that focuses on data and root cause analysis. Focus •Management identifies the project (problem selection) •Problem Statement •Form team and scope the project •Identify data sources •TOOLS – JIT training for team, problem statement, V.O.C., Spaghetti Diagram, Value Stream Map (as-is), Line Chart, etc.… Analyze •Collect data •Analyze data for root cause •Determine solutions based on data •Pilot solution & Implement •TOOLS – Ishikawa, Why Technique, Pareto, Matrices, etc.… Sustain •Permanent Solution based on data •TOOLS – Value Stream Map (future), Line Chart, Pareto, etc.… Test •Monitor for results •Tell the story •TOOLS – Line Chart, Value Stream Map, Metrics, QI Story, etc.… ORGANIZATIONAL CHANGE MANAGEMENT STAKEHOLDER/LEADERSHIP ENGAGEMENT STRATEGY/PLAN COMMUNICATION STRATEGY/PLAN TRAINING STRATEGY/PLAN Sustain Step
- 3. Step 6 & 7 of the nine-step problem identification and problem solving process - Process Improvement team, based on the data, will develop possible solutions, test a number of solutions, and implement a solution. 1. Management identifies opportunity 2. Form team and scope project 3. Map & Analyze current process 4. Define desired outcomes for improved process 5. Identify Root Causes and Proposed Solutions 6. Prioritize, Plan and Test Proposed Solutions 7. Refine and Implement Solutions 8. Measure Progress and Hold Gains 9. Acknowledge Team and Communicate Results 5/25/2017 NECS - WWW.NECS-MA.COM 781.929.1148 - gjcomeau@necs-ma.com 3 1 & 2 - Management Team 3, 4 & 5 - Process Improvement Team 6, 7, 8 & 9 - PI Team & Management Identify quick hits and get a 20% - 30% savings.
- 4. In step 6 & 7 of the nine-step problem identification and problem solving process - Process Improvement team develops the solution and conducts a pilot to verify the solution. SUSTAIN – during the sustain step, the team working with NECS, will pilot and finalize the solution: Based on the data the team has developed potential solutions using the data and selected the best solution based on the pilot or pilots The team will pilot the most appropriate solution and gain buy-in from the key stakeholders before fully implementing The team will create an implementation plan for management approval and implement after the plan has been approved TOOLS – Line Charts, Value Stream Mapping (future), Pareto, etc.… 5/25/2017 NECS - WWW.NECS-MA.COM 781.929.1148 - gjcomeau@necs-ma.com 4
- 5. The third step of the NECS methodology, FAST®, for “Growth and Achieving Your Results ®” is Sustain. The Process Improvement team will map out the future state, use data collected from any pilots that may have been conducted to create line charts or Pareto Diagrams, etc. During this step there are three possible tools that could be applied: Value Stream Map – a tool for analyzing the current state of your value stream and designing the future or desired state for your value stream Line Chart - The line chart (or line graph) is one of the most widely used monitoring displays. The chart can show the number of your customer complaints by week, for example Pareto - A bar chart (Pareto diagram) that visually represents the distribution of occurrences being studied. It is possible that other tools, such as the spaghetti diagram or voice of the customer, etc. will be used by your team. NECS will provide JIT training for your team to show them the tools and how to use them. NECS will be with your team every step of the way to ensure that your team is able to go through the steps and come up with a solution. Each member of your team will receive an NECS Toolbox that provides descriptions and applications for the tools. 5/25/2017 NECS - WWW.NECS-MA.COM 781.929.1148 - gjcomeau@necs-ma.com 5
- 6. Value Stream Map – a method for analyzing the current state and designing a future state for the series of events that take a product or service from its beginning through to the customer. 1. Map out the current process or future state tasks (high level) from the supplier to the customer 2. Record the time for each task 3. Record the time between each task 4. A Value Steam Map can be used in manufacturing or service 5. A tool to identify the waste of waiting 5/25/2017 NECS - WWW.NECS-MA.COM 781.929.1148 - gjcomeau@necs-ma.com 6
- 7. Line Cart – a tool used to observe data for trends or patterns over a specified period of time. This tool is used for the current state and the future state. 1. Decide on the process performance measurement to monitor 2. Collect the data making sure there are enough data points 3. Create the graph: 1. Horizontal axis will be the time 2. Vertical axis will be the measurement, quantity, etc. 4. Plot the data 5/25/2017 NECS - WWW.NECS-MA.COM 781.929.1148 - gjcomeau@necs-ma.com 7 New Recruit Trend 0 2 4 6 8 10 12 14 1 3 5 7 9 11 13 15 17 19 Week NumberofNewrecruits
- 8. Pareto - A bar chart (Pareto diagram) that visually represents the distribution of occurrences being studied. The most frequent occurrence is represented at the far left, with other occurrences represented in descending order to the right. 5/25/2017 NECS - WWW.NECS-MA.COM 781.929.1148 - gjcomeau@necs-ma.com 8 1. Define the categories to be used in your Pareto diagram. You can get these from the Fishbone or the Why activity 2. Sort the data into categories. Arrange the categories in descending order as defined by the data 3. Make a bar graph based on the data, showing the highest category to the lowest category 4. Check your diagram for a Pareto pattern (in which the highest categories are responsible for most of the effects) 5. Use the Pareto diagram as a guide to action or to further analysis 6. The Pareto can be used for the current state and the future state
- 9. KEY POINTS Always use DATA throughout the problem solving process The Value Stream Map is used to show the future process flow. This provides the team with an opportunity to preview and evaluate the future business process. The “Pareto” will be used to compare the the future state with the current state to insure improvements are made The Line Chart will be used to compare the the future state with the current state to insure improvements are made Verify with DATA - every step of the process 5/25/2017 NECS - WWW.NECS-MA.COM 781.929.1148 - gjcomeau@necs-ma.com 9
- 10. Find out how you can get what you want and benefit from NECS’s BUSINESS PROCESS IMPROVEMENT and PREVENTION for RESULTS Send an email to: Gary J. Comeau – gjcomeau@necs-ma.com OR better still Call NOW 781.929.1148 The discussion and consultation are free – you have nothing to lose and PROFITS TO GAIN!!! 5/25/2017 NECS - WWW.NECS-MA.COM 781.929.1148 - gjcomeau@necs-ma.com 10 A Small Business Solution Using Lean / Six Sigma
- 11. ADDENDUM 5/25/2017 NECS - WWW.NECS-MA.COM 781.929.1148 - gjcomeau@necs-ma.com 11
- 12. 5/25/2017 NECS - WWW.NECS-MA.COM 781.929.1148 - gjcomeau@necs-ma.com 12 BUSINESS PROCESS IMPROVEMENT and PREVENTION for RESULTS - Lean and Six Sigma are the two most important improvement methodologies that interact and reinforce one another; and they are much faster if Lean and Six Sigma are implemented and work together. Lean focuses on simplification and streamlining; while Six Sigma focuses on optimization. The Eight Speed Bumps can be addressed by applying Lean and Six Sigma. The NECS FAST® approach combines both improvement methodologies to get you the RESULTS you want. 1. Over production (the most common type of waste) 2. Excess inventory caused by over production. 3. Waiting — People or Products 4. Unnecessary movement of work products. 5. Unnecessary movement of employees. 6. Unnecessary or incorrect processing. (people watching a machine that can be taught to monitor itself) 7. Defects leading to repair, rework, or scrap. 8. Human Capital
- 13. The nine-step problem identification and problem solving process that leads to a plan and results in 3 – 14 days. Step 1 & 2 are for the Management Team; Steps 3, 4 5 & 6 are for the Process Improvement (PI) team and steps 7, 8, & 9 are for the PI team and Management. NECS is involved in every step. 1. Management identifies opportunity 2. Form team and scope project 3. Map & Analyze current process 4. Define desired outcomes for improved process 5. Identify Root Causes and Proposed Solutions 6. Prioritize, Plan and Test Proposed Solutions 7. Refine and Implement Solutions 8. Measure Progress and Hold Gains 9. Acknowledge Team and Communicate Results 5/25/2017 NECS - WWW.NECS-MA.COM 781.929.1148 - gjcomeau@necs-ma.com 13 1 & 2 - Management Team 3, 4 & 5 - Process Improvement Team 6, 7, 8 & 9 - PI Team & Management Identify quick hits and get a 20% - 30% savings.