More Related Content
Similar to Poster1-Frank Odom
Similar to Poster1-Frank Odom (20)
Poster1-Frank Odom
- 1. RESEARCH POSTER PRESENTATION DESIGN © 2012
www.PosterPresentations.com
Using
a
Lloyd’s
mirror
interferometer,
I
have
created
lithographic
paMerns,
which
are
then
used
to
produce
silver-‐based
nanostructures.
Metallic
nanostructures
are
par/cularly
interes/ng,
because
they
possess
op/cal
and
electrical
proper/es
that
are
largely
size-‐
dependent.
I
have
been
researching
the
theore/cal
background
for
metal-‐based
plasmonic
nanostructures,
as
well
as
some
of
the
methods
for
fabrica/ng
these
structures
and
computa/onally
simula/ng
their
op/cal
proper/es.
ABSTRACT
University
of
the
South:
Sewanee
Frank
Odom,
Paul
Campbell,
Dr.
Eugenii
Donev
Plasmonic
Nanostructures
OBJECTIVES
• Explore
the
theore/cal
basis
of
plasmonics
&
nanomaterials.
• Observe
the
op/cal
effects
of
changing
the
size
and
shape
of
nanostructures
using
FDTD
simula/ons.
• Using
a
Lloyd’s
mirror
interferometer,
a
posi/ve
photoresist,
and
a
vapor
deposi/on
system,
create
silver-‐based
nanostructures
to
be
used
for
op/cal
measurements.
• Characterize
the
samples
by
observing
their
diffrac/on
paMerns,
as
well
as
by
direct
measurement
in
the
electron-‐beam
microscope
at
Sewanee.
• Collect
measurements
of
the
op/cal
transmission
through
a
sample
to
compare
to
the
FDTD
simula/on
results.
THEORY
/
INTRODUCTION
Plasmon
Finite-‐Difference
Time
Domain
(FDTD)
simula/ons
calculate
the
scaMered
fields
due
to
a
nanopar/cle
by
discre/zing
the
dimensions
of
the
par/cle
and
solving
Maxwell’s
equa/ons
at
each
/me
step.
Light
is
scaMered
most
strongly
scaMered
when
the
incident
light
matches
the
resonant
Localized
Surface
Plasmon
frequency.
For
a
nanosphere
in
vacuum,
we
can
actually
solve
for
an
exact,
analy/cal
solu/on
for
the
poten/al
outside
the
sphere,
from
which
we
derive
the
polarizability
of
the
nanosphere:
When
a
sample
of
silver
is
reduced
to
dimensions
on
the
order
of
nanometers,
it
behaves
in
a
way
that
is
en/rely
different
from
what
is
familiar.
For
example,
a
silver
nanosphere,
when
illuminated
by
white
light,
will
appear
blue.
The
polarizability,
however,
will
vary
with
the
size
and
shape
of
the
nanopar/cles
being
observed.
We
turn
to
FDTD
numerical
simula/ons
in
order
to
further
inves/gate
the
proper/es
of
nanopar/cles.
FDTD
SIMULATION
FDTD
benchmarked
with
Mie
Theory
We
can
vary
the
size,
shape,
and
surrounding
medium,
or
even
study
arrays
of
parNcles,
which
demonstrate
coupling
effects.
Size
Dependence
of
resonant
LSP
frequency
Shape
Dependence
and
Coupling
Effects
EXPERIMENTAL
METHODS
Using
a
spin-‐coa/ng
device,
a
thin
layer
of
primer
(light
gray)
is
deposited
on
a
glass
slide,
followed
by
a
layer
of
posi/ve
photoresist
(orange).
Then,
with
a
Lloyd’s
mirror
interferometer,
double-‐slit
diffrac/on
paMerns
are
projected
onto
the
photoresist.
The
exposed
photoresist
is
then
chemically
removed.
By
varying
the
exposure
parameters,
different
paMerns
can
be
created.
Using
a
vapor
deposi/on
system,
silver
is
uniformly
deposited
across
the
sample.
The
remaining
photoresist
is
removed,
leaving
an
array
of
silver
par/cles.
Lloyd’s
Mirror
The
silver
nanopar/cle
arrays
can
then
be
seen
with
a
microscope.
Par/cle
Array,
Microscope
(X100)
Transmission,
Varying
Sample
Thicknesses
In
prac/ce,
it
is
easier
to
observe
the
transmission
through
a
sample:
Department
of
Physics
&
Astronomy
ACKNOWLEDGEMENTS
1. C.,
Le
Ru
Eric,
and
Pablo
G.
Etchegoin.
Principles
of
Surface-‐Enhanced
Raman
Spectroscopy.
Amsterdam:
Elsevier,
2009.
Print.
2. Novotny,
Lukas,
and
Bert
Hecht.
Principles
of
Nano-‐Op:cs.
Cambridge:
Cambridge
UP,
2006.
Print.
3. Sala,
Fabio
Della,
and
Stefania
D’Agos/no.
Handbook
of
Molecular
Plasmonics.
Singapore:
Pan
Stanford
Pub.,
2013.
Print.
4. Bohren,
Craig
F.,
and
Donald
R.
Huffman.
Absorp:on
and
Sca@ering
of
Light
by
Small
Par:cles.
New
York:
Wiley,
1983.
Print.
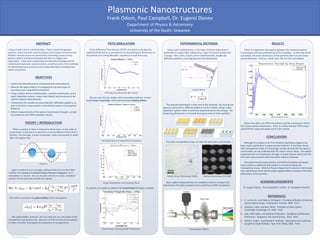
Now,
op/cal
measurements
are
needed
in
order
to
compare
the
transmission
through
a
sample
to
the
results
from
FDTD
simula/ons.
Transmission
Op/cs
CONCLUSIONS
RESULTS
Given
more
/me,
the
FDTD
simula/on
could
be
corrected
to
u/lize
the
correct
par/cle
dimensions.
Then,
it
is
likely
that
the
FDTD
values
would
fit
the
measured
values
much
more
closely.
Although
this
project
is
far
from
finished,
significant
progress
has
been
made,
par/cularly
in
experimental
methods.
It
has
been
shown
that
nanopar/cle
arrays
of
increasingly
smaller
periodici/es
(to
about
1
micrometer)
can
be
produced
with
the
Lloyd’s
mirror
setup.
The
op/cal
measurements
of
transmission
through
a
sample
(shown
above)
are
the
first
such
measurements
that
have
been
made
at
Sewanee.
The
experimental
measurements
and
FDTD
simula/ons
will
agree
more
closely
as
addi/onal
informa/on
is
uncovered
about
the
nanopar/cle
arrays.
With
the
Physics
Department’s
electron
microscope
now
opera/onal,
there
will
be
ample
opportuni/es
to
measure
the
exact
dimensions
of
the
par/cles.
There
is
a
significant
discrepancy
between
the
measured
op/cal
transmission
and
that
predicted
by
FDTD
simula/on.
At
the
/me
of
the
simula/on,
the
exact
dimensions
of
the
par/cles
were
not
yet
known
(actual
diameter
≈
950
nm,
rather
than
750
nm
from
simula/on).
REFERENCES
Dr.
Eugenii
Donev,
Paul
Campbell
(C’
2014),
Dr.
Randolph
Peterson
Electron
Microscope
(X12,500)