Ferrovial Executive Summary Jan Dec 2015
•
1 like•381 views

Executive Summary. Main Figures. Ferrovial January December 2015

Recommended
Recommended
More Related Content
What's hot
What's hot (20)
Viewers also liked
Viewers also liked (20)
Similar to Ferrovial Executive Summary Jan Dec 2015
Similar to Ferrovial Executive Summary Jan Dec 2015 (20)
More from Ferrovial
More from Ferrovial (13)
Recently uploaded
Recently uploaded (20)
Ferrovial Executive Summary Jan Dec 2015
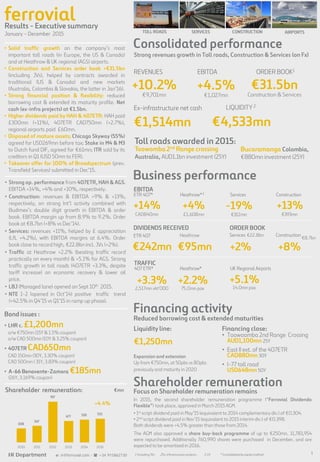
- 1. Heathrow* IR Department e: ir@ferrovial.com - +34 915862730 1 ferrovialResults - Executive summary January – December 2015 Financing activity Consolidated performance Business performance DIVIDENDS RECEIVED ETR 407 Heathrow ORDER BOOK ETR 407* ServicesHeathrow*3 Construction EBITDA REVENUES EBITDA Ex-infrastructure net cash • Strong op. performance from 407ETR, HAH & AGS. EBITDA +14%, +4% and +10%, respectively. • Construction: revenues & EBITDA +9% & +13%, respectively, on strong Int’l activity combined with Budimex’s double digit growth in EBITDA & order book. EBITDA margin up from 8.9% to 9.2%. Order book at €8.7bn (+8% vs Dec’14). • Services: revenues +11%, helped by £ appreciation (LfL +4.2%), with EBITDA margins at 6.4%. Order book close to record high, €22.8bn incl. JVs (+2%). • Traffic at Heathrow +2.2% (beating traffic record practically on every month) & +5.1% for AGS. Strong traffic growth in toll roads (407ETR +3.3%, despite tariff increase) on economic recovery & lower oil price. • LBJ (Managed lane) opened on Sept 10th 2015. • NTE 1-2 (opened in Oct’14) positive traffic trend (+42.5% in Q4’15 vs Q1’15 in ramp up phase). • Solid traffic growth on the company’s most important toll roads (in Europe, the US & Canada) and at Heathrow & UK regional (AGS) airports. • Construction and Services order book >€31.5bn (including JVs), helped by contracts awarded in traditional (US & Canada) and new markets (Australia, Colombia & Slovakia, the latter in Jan’16). • Strong financial position & flexibility: reduced borrowing cost & extended its maturity profile. Net cash (ex-infra projects) at €1.5bn. • Higher dividends paid by HAH & 407ETR: HAH paid £300mn (+11%), 407ETR CAD750mn (+2.7%), regional airports paid £60mn. • Disposed of mature assets; Chicago Skyway (55%) agreed for USD269mn before tax; Stake in M4 & M3 to Dutch fund DIF, agreed for €61mn; ITR sold by its creditors in Q1 (USD 50mn to FER). • Takeover offer for 100% of Broadspectrum (prev. Transfield Services) submitted in Dec’15. LIQUIDITY 2 TRAFFIC 407 ETR* 1 Including JVs 2 Ex-infrastructure projects. 3 Lfl * Consolidated by equity method Services Construction Shareholder remuneration In 2015, the second shareholder remuneration programme (“Ferrovial Dividendo Flexible”) took place, approved in March 2015 AGM. • 1st script dividend paid in May’15 (equivalent to 2014 complementary div.) of €0.304. • 2nd script dividend paid in Nov’15 (equivalent to 2015 interim div.) of €0.398. Both dividends were +4.5% greater than those from 2014. The AGM also approved a share buy-back programme of up to €250mn. 11,783,954 were repurchased. Additionally 760,990 shares were purchased in December, and are expected to be amortized in 2016. €mn AIRPORTSCONSTRUCTIONTOLL ROADS SERVICES UK Regional Airports Financing close: • Toowoomba 2nd Range Crossing AUD1,100mn 25Y • East II ext. of the 407ETR CAD880mn 30Y • I-77 toll road USD648mn 50Y Liquidity line: €1,250mn Expansion and extension Up from €750mn, at 50pbs vs 80pbs previously and maturity in 2020 Bond issues : • LHR c. £1,200mn o/w €750mn (15Y & 1.5% coupon) o/w CAD 500mn (10Y & 3.25% coupon) • 407ETR CAD650mn CAD 150mn (30Y, 3.30% coupon) CAD 500mn ( 31Y, 3.83% coupon) • A-66 Benavente-Zamora €185mn (26Y, 3.169% coupon) Strong revenues growth in Toll roads, Construction & Services (on Fx) Reduced borrowing cost & extended maturities Focus on Shareholder remuneration remains ORDER BOOK1 Shareholder remuneration: +10.2% €9,701mn +4.5% €1,027mn €31.5bn Construction & Services €1,514mn €4,533mn +14% CAD840mn +4% £1,608mn -19% €312mn +13% €393mn €242mn €95mn +2% €22.8bn +8% €8.7bn +3.3% 2,517mn vkt'000 +2.2% 75.0mn pax +5.1% 14.0mn pax Toowomba 2nd Range crossing Australia, AUD1.1bn investment (25Y) Bucaramanga Colombia, €880mn investment (25Y) Toll roads awarded in 2015: 308 367 917 477 510 532 2010 2011 2012 2013 2014 2015 +4.4%
- 2. ferrovial Revenues +11% partially explained by £ appreciation (LfL +4.2%). EBITDA margins at 6.4% (vs 8.8% in 2014), due to the negative contribution from the Birmingham contract (-€110mn, -€34mn of this relate to the losses incurred in 2015 & -€76mn for the possible impact from an unfavorable resolution of ongoing litigation & a revision of the contract’s profitability). Order book reached €22,800mn (inc. JV’s). Spain: Good performance continued, sales +4.9%, with contribution from contracts won in 2014 (waste collection Madrid, Orense Hospital maintenance) and higher revenues from road maintenance contracts. EBITDA margins were in line with those from 2014 (10.7%). Order book (including JV) fell by -8.8% at €6,140mn, due to the slowdown in public tendering in a year with severalelection processes. UK: Revenues growth (+14.2%) driven mainly by £ appreciation (LfL +3.0%). EBITDA (€122mn) was adversely impacted by the loss incurred (-€34mn) on Birmingham contract during 2015 (over-cost in the capex phase & legal costs) and (-€76mn) for the possible impact from an unfavorable resolution of the litigation with City Council & a revision of the contract’s profitability. Order book including JV grew by +6.7% (LfL +1.3%) at €16,323mn. During the last months of 2015, budgetary pressures on public entities (expected to continue in 2016) has been offset by higher consultingactivity. International: Positive performance across all countries; Revenues were €59mn in Chile (+20%), €26mn in Portugal (+2.4%) & €30mn in Poland (+194%). Revenues grew by +35.8% (+32.9% LfL), while EBITDA up by +113.2% (+102.2% LfL). Qatar (equity accounted) €8mn vs €5mn in 2014. Services Revenues EBITDA Order book* Toll roads Airports Double-digit growth in revenues & EBITDA, due to NTE 1-2 contribution (managed lane opened Oct’14, only including one quarter in 2014 vs full year in 2015), and traffic growth in the main toll roads. LfL sales +17% & EBITDA +26%. EBITDA margin stood at 64.9% vs 59.5% in 2014. Positive traffic trend in most toll roads, with good performance of light & heavy vehicles, supported by economic recovery (USA, Canada, Spain, Portugal & Ireland), better weather conditions & lower oil price vs 2014. In Q4, the traffic on NTE 1-2 grew by +42% vs Q1. Two new toll roads opened in 2015: • LBJ (Managedlane) in Texas on 10th Sept (3M aheadof schedule) • A-66 Benavente-Zamorain Spain on 12th May Other highlights: • ITR sold to IFM investorsfor ~$5.7bn ($50mn inflow for Ferrovial in 2Q). • Sale of a stake in M4 & M3 to Dutch fund DIF, agreed for €61mn. • Sale of Chicago Skyway (55%) to Canadian pensionfunds,agreed for USD269mn. • Algarve has been classified as financialasset after a contract change in Oct’15. Revenues EBITDA HAH contribution to Ferrovial’s equity-accounted results in 2015 was €186mn vs €74mn 2014, mainly from; the inclusion of a positive non- recurring (non-cash impact) on HAH expenses from changes in pension plans conditions agreed with the unions (+£237mn), higher amortization (+19%, from T2 opening, T1 close in June & new T3 integrated baggage system), positive mark to mark hedges, and lower tax rate (+£91mn). Heathrow: Traffic +2.2% (beating traffic record practically on every month) to 75mn pax, from increased number of seats in larger aircraft (av. seats 208.7 vs 204.5 in 2014). Load factors reached 76.5%,in line with 2014. Heathrow SP revenues +2.7%; on aeronautical +1% & commercial +8% revenues (with good performanceat parkings, catering services& duty free stores). • Record passengersatisfaction(81% rate their experience as very good or excellent). • “Best Airport in Western Europe” (2015 - 1st time), “Best Airport for Shopping” (6th consecutive year), and T5 “Best Airport Terminal in the World” (4th time in a row) by the Skytrax World Airport Awards. • “Best Airport in Europe” for the secondtime by Airport Council International. UK Regional airports: Traffic +5.1%, 14.0mn passengers. Revenues +4.0% and EBITDA +10.1% to £75mn. The airports paid £60mn dividends in 2015, €38mn to FER Revenues (HAH) *EBITDA(HAH) Ferrovial controls 25% of HAH (Heathrow) & 50% of AGS Consolidated by equity method Debt (HAH) RAB * Consolidated by equity method Revenues +8.8% (+1.2% LfL), with strong International growth (+14.6%), combined with the growth at Budimex (+6% LfL) & the start of works in new geographies (Australia, Brazil & MDE), which offset decline at Webber (-20% LfL). EBITDA improved by +13% on high margins on contracts that are ending in the US, & Budimex performance (+23% LfL). 80% of revenues are international. Order book (+3.8% LfL) was negatively impacted by the termination of the US-460 contract in Virginia. International order backlog represents 81% of total, while the Civil works segment remains the largest segment (81%). Relevant contracts were awarded in 2015, such as: Thames Tideway Tunnel (UK), Toowoomba and Northern Beaches Hospital connectivity (Australia), 407ETR phase II (Canada), I-285 (US) & several at Budimex. Budimex: Revenue +6.0% LfL from improvements in residential & non-residential construction.EBIT +26% LfL on ongoing cost control (materials & subcontractors). Webber: Revenues LfL -20%, given NTE & LBJ finalization. EBITDA margin (13.8% vs 8.7% 2014) on major projects in their final stages, with most associated risks mitigated. Order book -3% LfL, on new contractsawarded in the last quarter. F. Agroman: LfL revenues grew by +6.4% mainly by the contributions from new areas(Australia,Brazil & Middle East) and traditional markets. Revenues EBITDA Order book Construction Revenues EBITDA Order book* Spain UK International IR Department e: ir@ferrovial.com - +34 915862730 2 Revenues EBITDA Order book F. Agroman (RoW) Budimex (Poland) Webber (USA) Traffic Revenues EBITDA *Heathrow (HAH) Glasgow Aberdeen Southampton Traffic Revenues EBITDA Net debt € Ausol I (80%) NTE (57%) 407ETR* (43%) Chicago Skyway (55%) FY’15 €mn £ mn +18.9% €513mn +29.6% €333mn /64.9% +3.3% 2,517mn VKT +16.% 704mn +17.3% 590mn /83.8% -4.2bn -3.3% 39,973 +30.2% 81mn +29.7% 70mn /86.6% 0.0bn +12.4% 13,165 +11.4% 51mn +13.0% 41mn /79.1% -0.5bn +28.8% 25,553 n.s. 47mn n.s. 34mn /72.9% -0.9bn +11.3% €4,897mn -19.4% €312mn /6.4% +1.9% €22,800mn +4.9% 1,677mn +4.1% 179mn /10.7% -8.8% 6,140mn +14.2% 3,103mn -42.0% 122mn /3.9% +6.7% 16,323mn +35.8% 116mn +113.2% 11mn /9.5% +0.4% 336mn +8.8% €4,287mn +12.8% €393mn /9.2% +7.9% €8,731mn +14.3% 2,419mn +0.6% 236mn /9.8% +0.4% 5,807mn +6.4% 1,226mn +23.5% 68mn /5.6% +38.5% 1,974mn +7.9% 950mn +51.1% 89mn /13.8% -4.5% 643mn +2.8% £2,767mn +4.4% £1,608mn /58.1% £13.4bn £14.9bn +2.2% 75.0mn +2.8% 2,767mn +4.4% 1,608mn /58.1% +8.8% 104mn +13.0% 8.7mn +21.9% 44mn /42.3% -7.0% 3.5mn -1.7% 63mn +6.8% 26mn /41.7% -3.0% 1.8mn +0.5% 28mn +13.6% 8mn /29.5% * LfL €mn €mn * Including JV’s
- 3. ferrovial Long Term Assets Balance sheet Current Assets Equity Long Term Liabilities & others Current Liabilities Gross cash Ex. Infrastructure Projects Net cash position Gross debt Ex.Infrastructure Projects Infrastructure Projects Debt maturity calendar corporate (€mn) Liquidity position (ex- infra) Total cash Total liquidity Undrawn lines • Strong balance sheet and liquidity position to finance future growth opportunities. • At the end of 2015, Ferrovial’s net cash position, excluding infrastructure projects, stood at €1,514mn vs (€1,632mn in 2014). Not including the cash inflow for the disposals of the Chicago (USD269mn) or the Irish (€61mn) roads. • The dividends received from projects reached €477mn (€267mn from Toll Roads, €132mn from Airports & €78mn from Services). Corporate rating IR Department e: ir@ferrovial.com - +34 915862730 Bonds BBB / stableFitch (confirmed in July 2015) BBB / stableStandard & Poor’s (confirmed in Jun 2015) Total Net cash position FY’15 €mn Deferred income16.8bn 8.6bn 25.4bn 66% 34% 6.5bn 1.1bn 9.3bn 8.4bn33% 37% 4% 26% 1.5bn -6.1bn -4.5bn 3.0bn -1.5bn 1.5bn Net cash (debt) structure total 3.0bn 1.6bn 4.5bn 89% 34mn 2016 10mn 2017 502mn 2018 837mn 2021+ EBITDA ex-infrastructureCash flow generation W. Capital & others Operating CF (before tax) Interests paid Dividends (projects) Net investment Construction Toll roads Financials Shareholder remunerationConstruction Services Toll roads Airports Construction ServicesServices Services Construction Services Airports divs Toll roads divsOther + + = + + = FX impact Other Cash Variation 9mn 2019 12mn 2020 +580 +477 (168) +889 (300) (678) (118) +380 +267 +120 +272 (30) (532) +237 +78 (8) +289 (207) (35) (38) +132 (280) +267 (62) (23) (70) *Others Others * Includes changes in factoring, provisions, pensions payments UK and remuneration in shares & others. +132 (1) (88) Others Taxes (29)
- 4. ferrovial IR Department e: ir@ferrovial.com - +34 915862730 4 INNOVATION PROCESS ACKNOWLEDGEMENTS For the last 14 consecutive years Ferrovial has been included in the DJSI (Dow Jones Sustainability Index) at a global level. In addition, Ferrovial has been recognised by the FTSE 4Good index for the past 11 years, by the Carbon Disclosure project for the past 4 years, and is also a member of Stoxx and MSCI Global sustainability index. Sustainability is integrated in Ferrovial’s value creation proposition (economic, social and environmental) CONTRIBUTION TO VALUE CREATION Ferrovial is aware of its responsibility vs climate change assumes the firm commitment to reduce the environmental impact of all its activities. In addition, this commitment contributes to generate new ideas and business models, to offer clits innovativesolutionswith lower environmentalimpact C02 EMISSIONS -43.7% (2009-2015) RENEWABLE ENERGY 19% (100% Amey) WATER: water consumption measurement methodology. RECYCLING 1,071,021 tonneswere recycled in 2015 CONTRIBUTION TO VALUE CREATION Innovation is one of Ferrovial’s main corporate values and strategic pillars, used to answer to society’s challenges and the needs of its clients, while pushing for operating efficiency and the constant search for competitive and differential solutions. Ferrovial has identifies seven strategic areas in which innovation is key: toll Roads, Cities, Energy efficiency, energy from waste, innovativeconstruction,Water,Airports. CONTRIBUTION TO VALUE CREATION Ferrovial follows In terms of the remuneration of its top management, the same principles applicable to the rest of the company, the best market practices, legal requirementsand its own internalregulation. Ferrovial compareswith the IBEX35 members and is in the average compensationof that group. REMMUNERATION OF PRESIDENT & CEO 22% 35% 43% VariableFixed Long term incentives 2011 grant BOARD REMMUNERATION INNOVATION IN 2015 >100 €46mn 5 R&D INVESTMENT R&D DEVELOPPED PROJECS PROJECTS IN COLLABORATION WITH MIT STRATEGY PROCESS CULTURE Set by committee with Innovation Director of all business lines & the Information & Innovation Systems director, which defines the priority areas for investigation. Once a business challenge is identified, it turns into a project, supported y an open ecosystem with gvt agencies, investigation centres, large corporations, internal technical offices & competence centres and startups “Innovation days” supported by top management, extended by mid management (SUMMA university) and built y all employees (ZURITANKEN) In 2015 it is executing 2014’s winning ideas 1. Toll Roads 2. Cities 3. Energy efficiency 4.Energy from waste 5. Innovativeconstruction 6.Water 7. Airports 1. Big Data for traffic models 2. Urban Labs (Madrid, Santander & Sheffield) 3. Light for Glass 4.Circular economy 5. WPP (Warning Presenceof People) 6.Ferroagua 7. Insider Navigation PRIORITY AREAS FOR INVESTIGATION& EXAMPLE OF SPECIFIC PROJECTS REMMUNERATION PRINCIPLES Top management & Board remuneration is aligned with Ferrovial’s general remunerationprinciples: • Long term value creation • Transparency • Attraction & retentionof best professionals • Responsible objective achievement • Reasonable balance of fixed & variable remuneration • Acknowledgementin some casesof differed remunerationconcepts • No pension commitments Promoting professional development of all employees is a strategic priority. CONTRIBUTION TO VALUE CREATION Operating excellence & innovation are possible given Ferrovial employees’ talent & commitment. The Group’s internationalization requires proactive talent management, aligned with needs of our business & focussed on results and excellent performance. 70% MALE 30% FEMALE 74,032 Workforce Year end 71,784 Averageworkforce 41.9 42.8AVERAGE AGE 8.5 8.4YEARS OF SENIORITY 77% 81%PERMANENT CONTRACT 87% 13%MANAGEMENT 2.5% 0.7%ROTATION INDEX 67% 33%NEW RECRUITMENTS Spain 51% UK 28% Poland 6% America 3% RotW 12% 24countries A) TALENT MANAGEMENT: • Differential learning: Ferrovial spent 0.22% of revenues on employee training (average 22hr/employee) in 2015. • Succession Planning: 960 people assessment to identify 284 successors for key 139 management positions. B) COMMITMENT: • 84% employees would recommend Ferrovial as a good company to work for. • 91% employees are willing to make an extra effort so that the Company achieves its objectives. Ferrovialhas been recognized as Top Employer in Spain for 6 consecutiveyears Human resources Environment Say on payInnovation