
Recommended
More Related Content
Similar to lecture_5.pptx
Similar to lecture_5.pptx (20)
More from FenembarMekonnen
More from FenembarMekonnen (20)
Recently uploaded
Recently uploaded (20)
lecture_5.pptx
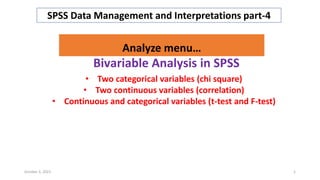
- 1. Bivariable Analysis in SPSS SPSS Data Management and Interpretations part-4 Analyze menu… • Two categorical variables (chi square) • Two continuous variables (correlation) • Continuous and categorical variables (t-test and F-test) October 3, 2023 1
- 2. Bivariable Analysis • It is analysis made to test presence of relationship between two variables • Describes presence of association between two variables • It is initial step in hypothesis testing October 3, 2023 2
- 3. Possible relationships • There are three possible combination pairs of variable types, • Combination between: 1. Two categorical variables 2. Two continuous variables 3. A continuous and categorical variables October 3, 2023 3
- 4. 1. Two categorical variables • This is when the dependent and the independent variables are categorical. • Crosstab (Chi square) is the usual test of statistics. October 3, 2023 4
- 5. Analysis Descriptive statistics Crosstab October 3, 2023 5
- 6. Analysis Descriptive statistics Crosstab Put the independent variables to “Rows” (One or more categorical variables) The dependent variable to “column” Under “statistics” “Chi square” October 3, 2023 6
- 7. Analysis Descriptive statistics Crosstab Under ‘Cells’, ‘rows’ . October 3, 2023 7
- 8. Chi-Square Tests 30.571b 1 .000 29.955 1 .000 31.089 1 .000 .000 .000 30.550 1 .000 1435 Pearson Chi-Square Continuity Correction a Likelihood Ratio Fisher's Exact Test Linear-by-Linear Association N of Valid Cases Value df Asymp. Sig. (2-sided) Exact Sig. (2-sided) Exact Sig. (1-sided) Computed onlyfor a 2x2 table a. 0 cells (.0%) have expected count less than 5. The minimum expected count is 209.37. b. X2 that needs Consideration (for 2x2) •If the variables are of 2X2 table format, take the X2 under the continuity correction •If it is of 2X(>2) take the X2 under the Pearson chi-Square •If any cell in the table has < 5 expected count, choose likelihood ratio Fisher’s Ex. •If the independent variable is of ordinal type, choose linear by linear association. gender * depression diagnosis Crosstabulation 497 358 855 58.1% 41.9% 100.0% 420 160 580 72.4% 27.6% 100.0% 917 518 1435 63.9% 36.1% 100.0% Count % within gender Count % within gender Count % within gender female male gender Total non-case depression case depression diagnosis Total Compare percentages between different exposure status This is considered as the referent Output October 3, 2023 8
- 9. 2. Two continous variables • Uses a correlation matrix • Pearson’s correlation is used, when the two variables • are continuous and • are normally distributed • Therefore, we should test the variables for their symmetry • If they fulfill for symmetry (normal distribution), we are able to analyze using the Pearson’s correlation matrix October 3, 2023 9
- 10. Analysis Correlation Bivariate October 3, 2023 10
- 11. Analysis Correlation Bivariate… 1st Select continuous variables 2nd Pass by clicking here Finally click “OK” To see the result 3rd Select Pearson or make sure its selection October 3, 2023 11
- 12. • When the continuous variables are symmetrically distributed we choose “Pearson Correlation” Pearson Correlation (r) Output… October 3, 2023 12
- 13. Fig.1: Age of the mother against Birth weight in gm • The Correlation coefficient (r) measures the degree of 'straight- line' association between the values of two variables. October 3, 2023 13
- 14. • Pearson’s Correlation Coefficient (r) • Tells you two things about the relationship: 1. Strength 2. Direction • Also, the p-value: 3. Significant October 3, 2023 14
- 15. 1. Strength • How strong is the relationship? • Look at the value of r (Pearson correlation) • How big is the number? • 1.0 (-1.0) = Perfect Correlation • 0.60 to 0.99 (-0.60 to -0.99) = Strong • 0.30 to 0.59 (-0.30 to -0.59) = Moderate • 0.01 to 0.29 (-0.01 to -0.29) = Weak • 0 = No Correlation October 3, 2023 15
- 16. 2. Direction • What is the direction of the relationship? • Look at the sign of r (Pearson correlation) • Positive (+) • Both variables move in the same direction • If one is going up, the other will go up too or • If one is going down, the other will go down too. • Negative (-) • Both variables move in opposite directions • If one is going up, the other will go down or, • If one is going down, the other will go up. October 3, 2023 16
- 17. 3. Significant • The significance is illustrated by its P-value • When P-value is less than 0.05, then we consider the correlation is statistically significant. October 3, 2023 17
- 18. Con’t … • When the variables (especially the dependent) are not symmetrically distributed. • We should follow non-parametric correlation using ”Kendall’s Tau_b” or ”Spearman rho” October 3, 2023 18
- 19. Analysis Correlation Bivariate… : October 3, 2023 19
- 20. Analysis Correlation bivariate Similar to Pearson (r) correlation. But select Kendall’s tau-b and Spearman rho October 3, 2023 20
- 21. Similar interpretation of the correlation coefficient Output… October 3, 2023 21
- 22. 3. A categorical & a continuous variable • Here you can look at a difference in mean values between two or more groups • Statistics of significance is made by: • “Students t-test” for two groups, and • “F-test” for more than two groups • P-value is used to determine significance • P-value <0.05, it is significant • P-value >0.05, it is non-significant October 3, 2023 22
- 23. T-test • If the dependent variable is symmetrically distributed, look for the independent variable 1. If it is categorical and binary type Use ‘students T-test’. • One sample t-test • Independent two-sample t-test • Paired sample t-test October 3, 2023 23
- 24. Analysis Compare means One sample T-test 1. One-Sample t-test • Compare the mean of one group against the set mean. • This set mean can be any theoretical value (or it can be the population mean). October 3, 2023 24
- 25. Output… • There is a difference in the mean of sbp from the hypothesized value (because p-value<0.05). October 3, 2023 25
- 26. 2. Independent samples T-test... October 3, 2023 26 Analysis Compare means Independent samples T-test • It is used to compare the means of two different samples.
- 27. Independent samples T-test… • To compare the outcome variable among two levels of factor variable October 3, 2023 27
- 28. October 3, 2023 28 Output • Levene’s test for equality of variances, tests assumption of homogeneity of variance, • If p-value is >0.05, we could say that ‘EQUAL VARIANCES ASSUMED’, thus to take from first row. • If p-value<0.05, it could be said that EQUAL VARIANCES NOT ASSUMED, and taking the second row will be advised. • The T-test is a test that tells us the mean difference observed on baseline CD4 count among males and females, is statistically non- significant (no difference in mean).
- 29. Analysis Compare means Independent samples T-test • Measure one group at two different times. • Compare separate means for a group at two different times or under two different conditions. 3. Paired sample T-test... October 3, 2023 29
- 30. Output • There is a difference in the mean of intervention between the before and after intervention (because p<0.05). October 3, 2023 30
- 31. F-test 2. Categorical and non-binary type use F-test (Variance Ratio Test) • Assumption: Data is normally distributed and the variance of the data (spread) is similar in each of the groups • Analysis of Variance (ANOVA) is used to compare between groups if there is more than two categories. October 3, 2023 31
- 32. One-Way ANOVA • Select the dependent variable to the ‘dependent list’ box and the independent variable to the ‘factor’. • After Clicking the “options”, choose the • ‘descriptive’ • ‘Homogeneity of variance’ and • ‘Means plot’ October 3, 2023 32
- 33. One-Way ANOVA… • After clicking “Post Hoc”, choose ‘Tukey’, click ‘Ok’. • This will give you the mean difference between and within group difference and its significance using F-test. October 3, 2023 33
- 34. 1.Analysis Compare means One-Way ANOVA October 3, 2023 34
- 35. Analysis Compare means One-Way ANOVA Under “Post Hoc”, choose ‘Tukey’ October 3, 2023 35
- 36. E.g. Weight Vs smoking status Under OPTION choose • Descriptive • Homogeneity of variance test • Means plot October 3, 2023 36
- 37. The group descriptive statistics tells us the mean of weight (KG) among different smoking status Levene’s test for equality of variances, tests assumption of homogeneity of variance, if it is significant, we could say that EQUAL VARIANCES NOT ASSUMED, thus we could say that we have violated assumptions in ANOVA and we should use other methods. • The ANOVA statistics tells us that there is mean difference in weight between groups that is statistically significant. Output October 3, 2023 37
- 38. This multiple comparison statistics (Tukey) tells us that for presence of mean difference in weight between groups and within groups. Here the mean of a single value is compared with mean of other values And is displayed by mean difference P-value for the difference Output… October 3, 2023 38 Here the mean of a single value is compared with mean of other values And is displayed by mean difference
- 39. This gives graphical representation of mean score of weight (KG) by smoking status Output… October 3, 2023 39
- 40. End! October 3, 2023 40