
Recommended
Recommended
More Related Content
What's hot
What's hot (19)
Similar to Calculate Overall Equipment Effectiveness
Similar to Calculate Overall Equipment Effectiveness (20)
Recently uploaded
Recently uploaded (20)
Calculate Overall Equipment Effectiveness
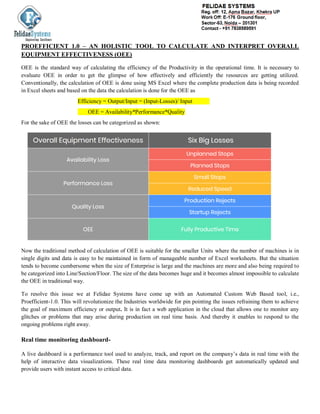
- 1. PROEFFICIENT 1.0 – AN HOLISTIC TOOL TO CALCULATE AND INTERPRET OVERALL EQUIPMENT EFFECTIVENESS (OEE) OEE is the standard way of calculating the efficiency of the Productivity in the operational time. It is necessary to evaluate OEE in order to get the glimpse of how effectively and efficiently the resources are getting utilized. Conventionally, the calculation of OEE is done using MS Excel where the complete production data is being recorded in Excel sheets and based on the data the calculation is done for the OEE as Efficiency = Output/Input = (Input-Losses)/ Input OEE = Availability*Performance*Quality For the sake of OEE the losses can be categorized as shown: Now the traditional method of calculation of OEE is suitable for the smaller Units where the number of machines is in single digits and data is easy to be maintained in form of manageable number of Excel worksheets. But the situation tends to become cumbersome when the size of Enterprise is large and the machines are more and also being required to be categorized into Line/Section/Floor. The size of the data becomes huge and it becomes almost impossible to calculate the OEE in traditional way. To resolve this issue we at Felidae Systems have come up with an Automated Custom Web Based tool, i.e., Proefficient-1.0. This will revolutionize the Industries worldwide for pin pointing the issues refraining them to achieve the goal of maximum efficiency or output. It is in fact a web application in the cloud that allows one to monitor any glitches or problems that may arise during production on real time basis. And thereby it enables to respond to the ongoing problems right away. Real time monitoring dashboard- A live dashboard is a performance tool used to analyze, track, and report on the company’s data in real time with the help of interactive data visualizations. These real time data monitoring dashboards get automatically updated and provide users with instant access to critical data.
- 2. Here is a sample dashboard where you can monitor your production related data Achieve Highest Production Efficiency It helps in achieving highest production efficiency by ensuring right product is at the right place and is processed in the time limits with the desired quality output and unnecessary worker activity. It further assures reduction in excess transportation exercise, reduction in defects, integrating quality-directed manufacturing, interlocking traceability and human error or equipment related quality defects. It helps manufacturers to identify and eliminate any processing that does not add value to the product, thereby elimination any waste of time and material and thereby saving money. Cost Reduction and Monetary Benefits
- 3. It helps to optimize asset and manage inventory which ultimately leads to lower inventory carrying costs and search times. Also with its application companies manage to reduce downtime and enable energy efficient production which finally leads to lower operational costs and creation of new sources of revenue. The benefits of using Proefficient-1.0 are mentioned below: 1. No scope for manipulation 2. Ease of use, adaptability and customizations available to suit the industry type 3. Entry of data can be Automated/manual
- 4. 4. Audit Trail for maintaining log of the activities 5. Automatic calculation for the OEE and using it you can also calculate Overall Plant Effectiveness (OPE) which is next to impossible using the traditional method 6. All the calculation for the product are done converting its value into time where the comparison for different machines with different products and different cycle time becomes possible 7. Information available to senior management anytime and can be accessed from anywhere Case-5 OEE for Plastic Part manufacturer This company had 23 numbers of Plastic Injection machines. The machines are used for high brand FMCG packaging. The products involved are: Boxes, Bottles and caps. Here is the situation: 1. Company has implemented Lean methodologies.
- 5. 2. They were using Excel sheet to calculate the OEE. For each machine one worksheet created every month 3. They have a dedicated staff to collect information from the Production and entering into the Excel sheet The main challenge was that although the data was fed regularly, but when the report is to be generated one or the other machine data was found missing. And there was no top view of all the machines. Individual excel sheet is to be checked for any machine’s OEE. The other challenge was that it was pretty difficult to find out the area to target for improvement as the category of downtime described does not define any Machine specific reason. Deployment of ProEfficient: The company deployed ProEfficient 1.0 , which is a Online platform for monitoring OEE and Machine, following are the features of this platform: Cloud based/On Premise deployment, No need to install any special software. Everything is configurable and User level defined: Shift Timing, Product Cycle Time, Stoppage Reason and Sub-reason, Quality Reason and sub-reason. Various reports possible: Downtime reports (duration and frequency), Produced product reports, Rejection reports and Value addition reporting. The sample screenshots of the reports can be seen below:
- 6. Benefits Obtained: 1. One of the challenge was that, they had machines which can have multi-cavity molds for their small products like caps, and many a times, not all cavities are used in production. Therefore the shots calculation was not enough for calculation of the Productivity. Proefficient allows unit of production defined in various ways for each type of products like Running meter per hour : Textile, Paper and Wire , Kilogram per hour: Extrusion Pipes, Units : CNC machining , Bottles etc. For multi-cavity machines, we suggested to use Kilogram/grams and they started feeding theh information of how much gram-age is converted in a shift. 2. With the help of Proefficent they could start visualizing Productivity of each machine/group of machine and Plant. 3. As the report of downtime provide charts as Pareto, visualization of low hanging fruit became easier. They could make focused efforts for fixing the major downtime issues.