The Sun’s differential rotation is controlled by high- latitude baroclinicall...
Poster_AMS_2016
1. • Although most strong and violent tornadoes (> EF1) are spawned from supercells, the
majority of supercells, even those with detected rotation, are not tornadic (Trapp et. al.
2005)
• Hodographs with significant streamwise vorticity and southerly shear in the lowest
500 meters are more likely to result in tornadic storms (Nowotarski and Jensen 2013)
• Previous studies (Markowski et. al. 2003; Craven and Brooks 2004; Thompson et. al.
2003) have shown that low-level wind shear is a good discriminator between tornadic
and non-tornadic supercells
• One hypothesis given by Markowski and Richardson (2009, 2014) on the influence of
low-level shear on tornadogenesis is that increased streamwise vorticity near the
ground leads to a stronger midlevel mesocyclone, thereby enhancing the low-level,
upward-directed dynamic vertical perturbation pressure gradient force and subsequent
convergence of near-ground vertical vorticity
• There have been other studies that have looked into this mechanism but we believe that there
could be another factor
• In this research we focus mainly on the effects of the orientation of the low-level shear
(0 – 500 m) relative to the outflow
• Supercells are simulated using the cloud model CM1 by inputting idealized soundings,
each one thermodynamically the same but having different directional low-level wind
shear
Hypotheses
• There may be a relative positioning of a supercell’s coldpool and overlying
updraft/mesocyclone where convergence of near-ground, circulation-rich outflow is
optimized and near-ground vertical vorticity is maximized.
• The position of the near-ground, circulation-rich outflow, relative to the overlying
midlevel mesocyclone will be affected by the orientation of the low-level vertical wind
shear.
• Grid points: 350 x 350 x 130
• Grid spacing: 500 x 500 m horizontal
with a stretched vertical grid (50 – 500
m)
• Model run time: 10800 seconds
• Outputs data every 300 seconds
• Free-slip top & bottom boundary
• Warm bubble initialization
• Morrison double moment microphysics
parameterization
• CM1 is a three-dimensional, non-hydrostatic, non-linear, time-dependent numerical
model designed for idealized studies of atmospheric phenomena (Bryan 2009)
Felicia Guarriello and Christopher Nowotarski
Introduction
Texas A&M University, Department of Atmospheric Sciences
Bryan GH. 2009. The governing equations for CM1. National Center for Atmospheric
Research, Boulder, CO .
Craven, J. P., and H. E. Brooks, 2004: Baseline climatology of sounding derived
parameters associated with deep moist convection. Natl. Wea. Dig., 28, 13 – 24.
Esterheld, J. M. and D. J. Giuliano, 2008: Discriminating between tornadic and non-
tornadic supercells: A new hodograph technique. Electronic J. Severe Storms
Meteor., 3 , 1–50.
Markowski, P., C. Hannon, J. Frame, E. Lancaster, A. Pietrycha, R. Edwards, and R.
L. Thompson, 2003: Characteristics of vertical wind profiles near supercells
obtained from the Rapid Update Cycle. Wea. Forecasting, 18, 1262-1272.
--------, and Y. P. Richardson, 2009: Tornadogenesis: Our current understanding,
forecasting considerations, and questions to guide future research. Atmos.
Research, 93, 3-10.
--------, --------, 2014: The influence of environmental low-level shear and cold pools on
tornadogenesis: Insights from idealized simulations. J. Atmos. Sci., 71, 243-275.
Nowotarski, C. J., and A. A. Jensen, 2013: Classifying proximity soundings with self-
organizing maps toward improving supercell and tornado forecasting. Wea.
Forecasting, 28, 783-801.
Thompson, R. L., R. Edwards, J. A. Hart, K. L. Elmore, and P. Markowski,, 2003:
Close proximity soundings within supercell environments obtained from the
Rapid Update Cycle. Wea. Forecasting, 18, 1243-1261.
Trapp, R. J., S. A. Tessendorf, E. S. Godfrey, and H. E. Brooks, 2005: Tornadoes from
squall lines and bow echoes. Part I: Climatological distribution. Wea. Forecasting,
20, 23-34.
References
Conclusions
CM1 (release 17)
Soundings
Modifications to hodograph Example of sounding
• Three low-level vertical wind shear orientations (alpha) were tested against a control
(no shear) orientation
• Esterheld and Giuliano (2008) found that when using low-level shear as a predictor for
tornadogenesis the lowest 500 meters was most effective
• The magnitude of the 0 – 500 meter shear whose orientation is being varied is 10 m s-1
which was found to be an ideal case for significant tornado formation by Craven and
Brooks (2004)
Results
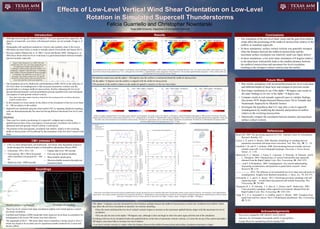
Time series of the distance between the maximum updraft helicity and the maximum low-level circulation (blue lines), the maximum surface vertical vorticity (red lines), the maximum 1-6 km updraft helicity
(green lines), the average circulation beneath the area enclosed by the 600 m2 s-2 updraft helicity contour (purple lines), and the low-level circulation (shaded) located under the updraft helicity (colored contours)
at the time of maximum low-level vertical vorticity for the control case, alpha = 0 degrees, alpha = 90 degrees, and alpha = 180 degrees.
Storm reflectivity for (a) the control, (b) 0 degrees, (c) 90 degrees, and (d) 180 degrees hodographs at 7800 seconds (130 minutes). The dashed blue line is the -1 K contour at the surface, black contours are mid-
level (4 km) vertical velocity plotted every 5 m s-1, solid green line is the 600 m2 s-2 updraft helicity outline (integrated 1-6 km), black dot is the maximum updraft helicity (integrated 1-6 km), and the yellow star
is the maximum low-level (surface) vertical velocity.
(a) (b) (c) (d)time = 7800 s (no shear) time = 7800 s (alpha = 0 degrees) time = 7800 s (alpha = 90 degrees) time = 7800 s (alpha = 180 degrees)
(a) (b) (c) (d)
Surface circulation computed about a 2-km radius square centered on each gridpoint for (a) the control, (b) 0 degrees, (c) 90 degrees, and (d) 180 degrees hodographs at 7800 seconds (130 minutes). The black
contours are mid-level (4 km) vertical velocity plotted every 5 m s-1, solid green line is the 600 m2 s-2 updraft helicity outline (integrated 1-6 km), black dot is the maximum updraft helicity (integrated 1-6 km), and
the yellow star is the maximum low-level (surface) vertical velocity. The black box represents the area in which the distance calculations were performed. The black box is determined by the position of the
maximum updraft helicity having dimensions of 25 x 17.5 km.
time = 7800 s (alpha = 0 degrees) time = 7800 s (alpha = 90 degrees) time = 7800 s (alpha = 180 degrees)time = 7800 s (no shear)
• The orientation of the low-level shear vector and the gust-front relative
winds affect the positioning of the midlevel mesocyclone relative to the
outflow in simulated supercells
• In these simulations, surface vertical vorticity was generally strongest
when the distance between the midlevel mesocyclone and the
maximum surface circulation was relatively small (see figure below)
• In these simulations, a low-level shear orientation of 0 degrees relative
to the deep-layer wind profile leads to the smallest distance between
the midlevel mesocyclone and maximum low-level circulation,
resulting in the strongest vertical vorticity near the surface
Future Work
• Run similar simulations with increased/decreased low-level wind shear
and different depths of shear layer and compare to previous results
• Run longer simulations to see if the alpha = 90 degree case results in
the same findings as we saw in the alpha = 0 degree case
• Compare results to real tornadic supercell cases to validate findings
(See poster #S79: Radar-Detected Mesocyclone Tilt in Tornadic and
Nontornadic Supercells by Michelle Serino)
• Investigate the hypothesis that LCL may play a role in supercell
tornadogenesis by modifying the intensity and position of outflow
relative to the overlying mesocyclone
• Statistically compare the correlation between distance and maximum
surface vertical vorticity
Figure 9 from Thompson et. al. (2003): Box and
whiskers plot of 0-1 km vector shear magnitude (m s-1)
for significantly tornadic supercells (sigtor, 54
soundings), weakly tornadic supercells (weaktor, 144
soundings), “marginal” supercells (mrgl, 15 soundings),
and a sample of discrete nonsupercell storms (nonsuper,
75 soundings). The shaded box covers the 25th-75th
percentiles, the whiskers extend to the 10th and 90th
percentiles, and the median values are marked by the
heavy horizontal line within each shaded box.
•In both the control case and the alpha = 180 degrees case the outflow is restrained behind the midlevel mesocyclone
•In the alpha = 0 degrees case the outflow is aligned with the midlevel mesocyclone
•The position of the outflow relative to the midlevel updraft is sensitive to the low-level shear
•The alpha = 0 degrees case has increased low-level rotation, perhaps because the midlevel mesocyclone overlies the circulation-rich outflow which
may allow the low-level circulation to intensify via vorticity stretching
•Once the storm initialized the low-level vertical vorticity begins to increase as the maximum updraft helicity aligns with the maximum low-level
circulation
•This can also be seen in the alpha = 90 degrees case, although it does not begin to show the same signs until the end of the simulation
•Looking at the low-level circulation below the updraft helicity at the time of maximum vertical vorticity, it is clear the set up of the control and alpha =
180 degree cases does little to increase low-level rotation
• Low-level vertical vorticity is weaker when the distance between the midlevel mesocyclone and surface circulation maximum is larger
(m2s-1)
Acknowledgements
• This work is funded by NSF GRANT AGS-1446342
• Advisors: Dr. Christopher Nowotarski and Dr. Craig Epifanio
• George Bryan for maintaining and developing CM1