GRAPHIQUE SEMINAIRE QIDFF 2017
•
0 likes•9 views

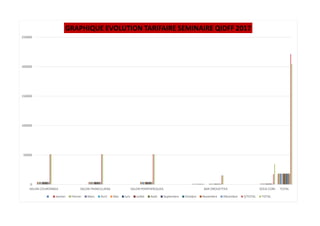
The document is a graph showing monthly revenue totals for different salons and a bar from January to December. It displays the revenue figures on the y-axis ranging from 0 to 250,000 and lists the names of the salons and bar on the x-axis below the months. The document provides revenue data for multiple businesses over a full year.
Recommended

Recommended
More Related Content
What's hot
More from Fabrice CLAMAGIRAND
More from Fabrice CLAMAGIRAND (20)
Recently uploaded
Recently uploaded (20)
GRAPHIQUE SEMINAIRE QIDFF 2017
- 1. 0 50000 100000 150000 200000 250000 SALON COURONNEA SALON FRANCILLIENA SALON PERIPHERIQUEA BAR DROUETTEA SOUS-COM TOTAL GRAPHIQUE EVOLUTION TARIFAIRE SEMINAIRE QIDFF 2017 Janvier Février Mars Avril Mai Juin Juillet Août Septembre Octobre Novembre Décembre S/TOTAL TOTAL