SlideShare a Scribd company logo
1 of 69
Dr. Rishitosh K. Sinha
Scientist/Engineer SE
Planetary Remote Sensing Section
Physical Research Laboratory, Ahmedabad
Email: rishitosh@prl.res.in
Mobile: +91 8128785486
PRINCIPLES AND
APPLICATIONS
What is Remote Sensing?
Remote sensing is the science (and to some extent, art) of acquiring
information about any planet’s surface without actually being in contact with it.
This is done by sensing and recording reflected or emitted energy and
processing, analyzing, and applying that information.
Remote sensing is the process of detecting and monitoring the physical
characteristics of an area by measuring its reflected and emitted radiation at a
distance (typically from satellite or aircraft).
Energy Source or Illumination (A) – the first
requirement for remote sensing is to have an
energy source which illuminates or provides
electromagnetic energy to the target of
interest.
Radiation and the Atmosphere (B) – as the
energy travels from its source to the target, it
will come in contact with and interact with the
atmosphere it passes through. This
interaction may take place a second time as
the energy travels from the target to the
sensor.
Interaction with the Target (C) - once the
energy makes its way to the target through
the atmosphere, it interacts with the target
depending on the properties of both the target
and the radiation.
Recording of Energy by the Sensor (D) -
after the energy has been scattered by, or
emitted from the target, we require a sensor
(remote - not in contact with the target) to
collect and record the electromagnetic
radiation.
Transmission, Reception, and Processing (E) -
the energy recorded by the sensor has to be
transmitted, often in electronic form, to a receiving
and processing station where the data are
processed into an image (hardcopy and/or digital).
Interpretation and Analysis (F) - the processed
image is interpreted, visually and/or digitally or
electronically, to extract information about the target
which was illuminated.
Application (G)
What is Electromagnetic Radiation?
The first requirement for remote sensing
is to have an energy source to illuminate
the target. This energy is in the form of
Electromagnetic radiation.
The above diagram shows an electromagnetic wave
propogating in the x direction, if the electric field is in
the y direction and the magnetic in the z direction.
Electromagnetic radiation consists of
an electrical field (E) which varies in
magnitude in a direction perpendicular
to the direction in which the radiation is
traveling, and a magnetic field (M)
oriented at right angles to the electrical
field. Both these fields travel at the
speed of light (c).
What is Electromagnetic Radiation?
Low frequency
Medium frequency
High frequency
Inversely proportional
Wavelength is the length of one wave cycle.
It is measured in nanometers, micrometers
etc.
Frequency refers to the number of cycles of
a wave passing a fixed point per unit of
time. It is normally measured in hertz (Hz),
equivalent to one cycle per second.
What is Electromagnetic Spectrum?
The electromagnetic spectrum ranges from the shorter wavelengths (including gamma
and x-rays) to the longer wavelengths (including microwaves and broadcast radio
waves). There are several regions of the electromagnetic spectrum which are useful for
remote sensing.
Use in remote sensing:
Interactions with the Atmosphere
Before radiation used for remote sensing reaches the planet's surface it has to
travel through some distance of the planet's atmosphere. Particles and gases in the
atmosphere can affect the incoming light and radiation. These effects are caused
by the mechanisms of scattering and absorption.
Scattering refers to a change in the direction of motion of a particle because of a collision with
another particle. How much scattering takes place depends on several factors including the
wavelength of the radiation, the abundance of particles or gases, and the distance the radiation
travels through the atmosphere. There are three (3) types of scattering which take place.
Rayleigh scattering occurs when particles are very small compared to the wavelength of the
radiation (small specks of dust or nitrogen and oxygen molecules).
Mie scattering occurs when the particles are just about the same size as the wavelength of the
radiation (Dust, pollen, smoke and water vapour).
The final scattering mechanism of importance is called nonselective scattering. This occurs
when the particles are much larger than the wavelength of the radiation (water droplets and
dust).
The blue colour of the sky results from
Rayleigh scattering, as the size of the gas
particles in the atmosphere is much smaller
than the wavelength of visible light.
Rayleigh scattering is much greater for blue
light than for other colours due to its shorter
wavelength. As sunlight passes through the
atmosphere, its blue component is Rayleigh
scattered strongly by atmospheric gases but
the longer wavelength (e.g. red/yellow)
components are not.
The sunlight arriving directly from the Sun
therefore appears to be slightly yellow, while
the light scattered through rest of the sky
appears blue.
In contrast, the water droplets that make up clouds are of a comparable size to the
wavelengths in visible light, and the scattering is described by Mie's model rather than that
of Rayleigh. Here, all wavelengths of visible light are scattered approximately identically, and
the clouds therefore appear to be white or grey.
The Atmospheric Window
Target Interactions
We refer to two types of reflection, which represent the two extreme ends of
the way in which energy is reflected from a target: specular reflection and
diffuse reflection.
Passive vs. Active Sensing
Satellite Characteristics: Orbits and Swaths
The path followed by a satellite is referred to as its orbit.
Spatial Resolution, Pixel Size, and Scale
The detail discernible in an image is dependent on the spatial resolution of
the sensor and refers to the size of the smallest possible feature that can be
detected. Spatial resolution of passive sensors depends primarily on their
Instantaneous Field of View (IFOV).
The IFOV is the angular cone of visibility of
the sensor (A) and determines the area on
the Earth's surface which is "seen" from a
given altitude at one particular moment in
time (B). The size of the area viewed is
determined by multiplying the IFOV by the
distance from the ground to the sensor (C).
This area on the ground is called the
resolution cell and determines a sensor's
maximum spatial resolution.
Spectral Resolution
The higher the number of bands of a remote sensing sensor, the
higher the spectral resolution of a satellite.
Using several bands for earth observation, these techniques are called multispectral
remote sensing. But there are sensors with 200 or more bands as well; those systems
are not called multispectral but hyperspectral.
Two fundamental conditions have to be considered in order to determine which
spectral bands are appropriate for a sensor: On the one hand, the atmospheric window
and, on the other hand, the spectral signature of the object in question.
Radiometric Resolution
Every time an image is acquired on film or by a sensor, its sensitivity to the
magnitude of the electromagnetic energy determines the radiometric resolution.
The radiometric resolution of an imaging system describes its ability to discriminate
very slight differences in energy The finer the radiometric resolution of a sensor, the
more sensitive it is to detecting small differences in reflected or emitted energy.
Temporal Resolution
The revisit period of a satellite sensor is usually several days. Therefore the
absolute temporal resolution of a remote sensing system to image the exact
same area at the same viewing angle a second time is equal to this period.
True and false colour composites
Image Analysis – Visual interpretation
Ghunghutta Reservoir
Shape
Gandhi Stadium
Shape and size
Pattern
Collectorate office
Kala Kendra
Bus Stand
Association
Raipur Airport
Pattern
Shadow/Pattern
Shape/Pattern/Association
Railway station
Credit: USGS
Digital Image Processing
All image interpretation and analysis involves some element of digital processing.
In order to process remote sensing imagery digitally, the data must be recorded and
available in a digital form suitable for storage on a computer tape or disk.
Image processing functions available in image analysis systems can be categorized into
the following four categories:
• Preprocessing: required prior to analysis/interpretation of the image
• Image Enhancement: mainly done to improve the appearance of the image to
enhance interpretation from the image (applied to increase differences between
features within an image)
• Image Transformation: similar to image enhancement; however, the transformation
involve combined processing of images from multiple bands
• Image Classification and Analysis: used to digitally identify and classify pixels in the
data.
Preprocessing
Landsat – 7 Image Destriping
Image Enhancement
Contrast enhancement
Pan Sharpening
Image Transformation
Image Classification
There are two broad subdivisions based on the methods used:
1. supervised classification,
2. and unsupervised classification.
In a supervised classification, the analyst identifies in the imagery homogeneous
representative samples of the different surface cover types (information classes) of
interest. These samples are referred to as training areas.
The computer uses a special program or algorithm (of which there are several
variations), to determine the numerical "signatures" for each training class.
Once the computer has determined the signatures for each class, each pixel in the
image is compared to these signatures and labeled as the class it most closely
"resembles" digitally.
Thus, in a supervised classification we are first identifying the information classes
which are then used to determine the spectral classes which represent them.
Supervised Classification
In unsupervised classification, spectral classes are grouped first, based solely on the
numerical information in the data, and are then matched by the analyst to information
classes (if possible).
Programs, called clustering algorithms, are used to determine the natural (statistical)
groupings or structures in the data.
Usually, the analyst specifies how many groups or clusters are to be looked for in the
data.
The final result of this iterative clustering process may result in some clusters that the
analyst will want to subsequently combine, or clusters that should be broken down
further - each of these requiring a further application of the clustering algorithm.
Thus, unsupervised classification is not completely without human intervention.
However, it does not start with a pre-determined set of classes as in a supervised
classification.
Unsupervised Classification
Supervised and Unsupervised Classification
Information Technology and
Geography
1. What is Information?
2. What is Geographic Information?
3. What are Geographic Information System?
What is Information?
• Information is data that have been organized (processed) and
communicated in a meaningful manner.
• Data is converted into information and information is
converted into knowledge.
What is Information?
Quantity Bucket number Item name Quantity of items
25 2 Fruits and vegetables 12 apples+13 potatoes
30 1 Vegetables 12 onions+15 potatoes+3 brinjal
21 5 Fruits 12 mangoes+5 apples+4 oranges
19 7 Eggs 19 eggs
24 3 Fruits, vegetables, and eggs 8 apples+12 potatoes+4 eggs
06 6 Vegetables 6 potatoes
21 4 Fruits and vegetables 15 oranges+6 onions
Data
Quantity Bucket number Item name Quantity of items
25 2 Fruits and vegetables 12 apples+13 potatoes
30 1 Vegetables 12 onions+15 potatoes+3 brinjal
21 5 Fruits 12 mangoes+5 apples+4 oranges
19 7 Eggs 19 eggs
24 3 Fruits, vegetables, and eggs 8 apples+12 potatoes+4 eggs
06 6 Vegetables 6 potatoes
21 4 Fruits and vegetables 15 oranges+6 onions
What is Information?
Information
Data
What is Geographic Information?
Geographic information describes:
• Physical location from where the information is coming
• Relationship between associated objects included in the information
Name and location of
cities
• Population
• Temperature
• Distance
• Density
• Land use
• Spatially related
• Can be assigned coordinates
or any spatial reference.
• On the surface of the earth.
• Involves location and
organization.
• Scale
• Can be from general to
specific.
• Simple to complex.
• Dynamics
• Spatial dynamics (variations
in space).
• Temporal dynamics
(variations in time).
Coordinate system
Scale
Time 1 Time 2
What is Geographic Information?
What is Geographic Information System?
• A geographic information system (GIS) integrates hardware, software, and
data for capturing, managing, analyzing, and displaying all forms of
geographic information.
• GIS allows us to view, understand, question, interpret, and visualize data in
many ways that reveal relationships, patterns, and trends in the form of
maps, globes, reports, and charts.
• A GIS helps you answer questions and solve problems by looking at your
data in a way that is quickly understood and easily shared.
• GIS technology can be integrated into any enterprise information system
framework.
What is Geographic Information System?
Geographic Information System
Encoding
• Information Systems
• Information system
specializing in the input,
storage, manipulation,
analysis and reporting of
geographical (spatially
related) information.
Management
Reporting
Analysis
Digitizing maps
Encoding spatial data
(census, vegetation,
topography, etc…)
Geographic
database in a
spatial data format
Spatial analysis
Thematic maps
Key features of GIS
• Information from different
sources
 Computer databases
 Digital maps
 GPS receiver
 Satellite image
• Data integration
• Projection
• Information retrieval
• Data output
• Overlay
Key components of GIS
Methods
People
Informa-
tion
Software
Hardware
GIS
• Hardware
Hardware is the computer on which a GIS operates.
• Software
GIS software provides the functions and tools needed
to store, analyze and display the geographic
information.
• People
GIS users range from technical specialists who design
and maintain the system, to those who use it to help
them do their everyday work.
• Methods
A successful GIS operates according to a well-
designed plan and business rules, which are the
models and operating practices unique to each
organization.
• Information
Geographic information and related tabular data can
be collected in-house or bought from a commercial
data provider. Most GIS employ a DBMS to create
and maintain a database to help organize and manage
data and information.
Data representation in GIS
• Raster Data
 Represent images as a
collection of pixels
 A grid of cells covering an
image / area
 Higher data volume
 Example of raster formats
 GeoTiff
 ARC/INFO ASCII Grid
 ARC/INFO GRID
 ECW
 IMG
• Vector Data
 Use geometrical shapes
(Lines, Points, Polygons)
 Low data volume
 Example of vector formats
 Shape files
 MapInfo TAB
Data representation in GIS
• RASTER
• VECTOR
• Real World
Entity representation in GIS
Points - simplest element, no
length or Width.
Lines (arcs) - set of connected
points, must have a beginning
and an ending point.
Polygons - set of connected
lines, can be used to describe a
feature as having an area.
We typically represent objects in space as three distinct
spatial elements:
We use these three spatial elements to represent real world features and
attach locational information to them.
Data types in GIS
Spatial/Geospatial/Geographic Data
• Latitude and longitude
• Street address
• x and y coordinates
• Range and township
• Location shown on a map
Non Spatial Data
• Name
• Gender
• Income
• ID number
Attributes in GIS
Data Assembly
Maps RSI
Intel Database Direct Entry
Keyboard
GPS
Functions in GIS
GIS
Desktop GIS Web GIS Mobile GIS
Types of GIS
The two primary desktop
applications for GIS
professionals are ArcMap
and ArcGIS Pro, and both
are part of ArcGIS
Desktop.
Web GIS is a type of
distributed information
system, comprising at
least a server and a client,
where the server is a GIS
server and the client is a
web browser, desktop
application, or mobile
application.
A mobile GIS allows
users out in the field to
capture, store, update,
manipulate, analyze,
and display geospatial
data and information.
Why to use GIS?
If you have a question, a map, tabular data, a computer, and
a GIS software application, you can utilize GIS to answer
your question.
Who uses GIS?
GIS are rapidly becoming the essential tools of analysis at all
levels of public- and private-sector management,
administration and planning.
People with the skill to use GIS are in demand across a broad
range of professions, in government, business and nonprofit
organizations.
How to use GIS?
GIS provides a set of tools for planning, decision-making,
operations management and inventory. GIS has a wide range
of applications.
What we can do with GIS
https://www.qgis.org/en/site/
https://earthexplorer.usgs.gov

More Related Content

Similar to Remote Sensing Principles and Applications Guide

Remote sensing principles-spectral signature-spectural range
Remote sensing principles-spectral signature-spectural rangeRemote sensing principles-spectral signature-spectural range
Remote sensing principles-spectral signature-spectural rangeMohsin Siddique
 
detail information of advance total station and remote sensing
detail information of advance total station and remote sensingdetail information of advance total station and remote sensing
detail information of advance total station and remote sensingshaikh imran
 
Fundamentals of Remote Sensing
Fundamentals of Remote SensingFundamentals of Remote Sensing
Fundamentals of Remote SensingShah Naseer
 
Surveying ii ajith sir class4
Surveying ii ajith sir class4Surveying ii ajith sir class4
Surveying ii ajith sir class4SHAMJITH KM
 
.remote sensing.Ece 402 unit-2
.remote sensing.Ece 402 unit-2.remote sensing.Ece 402 unit-2
.remote sensing.Ece 402 unit-2Vandana Verma
 
Introduction to remote sensing pt 1
Introduction to remote sensing pt 1Introduction to remote sensing pt 1
Introduction to remote sensing pt 1TafadzwaMarione
 
Chapter 5: Remote sensing
Chapter 5: Remote sensingChapter 5: Remote sensing
Chapter 5: Remote sensingShankar Gangaju
 
Surveying ii ajith sir class1
Surveying ii ajith sir class1Surveying ii ajith sir class1
Surveying ii ajith sir class1SHAMJITH KM
 
spatial resolutionin remote sensing
 spatial resolutionin remote sensing spatial resolutionin remote sensing
spatial resolutionin remote sensingGhassan Hadi
 
Principles of Remote Sensing
Principles of Remote Sensing Principles of Remote Sensing
Principles of Remote Sensing Ariful Islam
 
Basic of Remote Sensing
Basic of Remote SensingBasic of Remote Sensing
Basic of Remote Sensinggueste5cfed
 
MOD 5 SVIT NOTES VTU SYLLABUS 2018 SCHEME.pdf
MOD 5 SVIT NOTES VTU SYLLABUS 2018 SCHEME.pdfMOD 5 SVIT NOTES VTU SYLLABUS 2018 SCHEME.pdf
MOD 5 SVIT NOTES VTU SYLLABUS 2018 SCHEME.pdfBhuvanaN12
 
Remote sensing by jitendra thakor
Remote sensing by jitendra thakorRemote sensing by jitendra thakor
Remote sensing by jitendra thakorgandhinagar
 
Remote Sensing - Fundamentals
Remote Sensing - FundamentalsRemote Sensing - Fundamentals
Remote Sensing - FundamentalsAjay Singh Lodhi
 
passive and active remote sensing systems, characteristics and operations
passive and active remote sensing systems,  characteristics and operationspassive and active remote sensing systems,  characteristics and operations
passive and active remote sensing systems, characteristics and operationsNzar Braim
 

Similar to Remote Sensing Principles and Applications Guide (20)

Remote sensing principles-spectral signature-spectural range
Remote sensing principles-spectral signature-spectural rangeRemote sensing principles-spectral signature-spectural range
Remote sensing principles-spectral signature-spectural range
 
detail information of advance total station and remote sensing
detail information of advance total station and remote sensingdetail information of advance total station and remote sensing
detail information of advance total station and remote sensing
 
Remote sensing 1
Remote sensing 1Remote sensing 1
Remote sensing 1
 
Fundamentals of Remote Sensing
Fundamentals of Remote SensingFundamentals of Remote Sensing
Fundamentals of Remote Sensing
 
Surveying ii ajith sir class4
Surveying ii ajith sir class4Surveying ii ajith sir class4
Surveying ii ajith sir class4
 
.remote sensing.Ece 402 unit-2
.remote sensing.Ece 402 unit-2.remote sensing.Ece 402 unit-2
.remote sensing.Ece 402 unit-2
 
Remote sensing
Remote sensingRemote sensing
Remote sensing
 
Remote sensing and aerial photography
Remote sensing and aerial photographyRemote sensing and aerial photography
Remote sensing and aerial photography
 
Introduction to remote sensing pt 1
Introduction to remote sensing pt 1Introduction to remote sensing pt 1
Introduction to remote sensing pt 1
 
Remote Sensin
Remote SensinRemote Sensin
Remote Sensin
 
MAPPING REMOTE PLANTS THROUGH REMOTE SENSING TECHNOLOGY AND GIS
MAPPING REMOTE PLANTS THROUGH REMOTE SENSING TECHNOLOGY AND GISMAPPING REMOTE PLANTS THROUGH REMOTE SENSING TECHNOLOGY AND GIS
MAPPING REMOTE PLANTS THROUGH REMOTE SENSING TECHNOLOGY AND GIS
 
Chapter 5: Remote sensing
Chapter 5: Remote sensingChapter 5: Remote sensing
Chapter 5: Remote sensing
 
Surveying ii ajith sir class1
Surveying ii ajith sir class1Surveying ii ajith sir class1
Surveying ii ajith sir class1
 
spatial resolutionin remote sensing
 spatial resolutionin remote sensing spatial resolutionin remote sensing
spatial resolutionin remote sensing
 
Principles of Remote Sensing
Principles of Remote Sensing Principles of Remote Sensing
Principles of Remote Sensing
 
Basic of Remote Sensing
Basic of Remote SensingBasic of Remote Sensing
Basic of Remote Sensing
 
MOD 5 SVIT NOTES VTU SYLLABUS 2018 SCHEME.pdf
MOD 5 SVIT NOTES VTU SYLLABUS 2018 SCHEME.pdfMOD 5 SVIT NOTES VTU SYLLABUS 2018 SCHEME.pdf
MOD 5 SVIT NOTES VTU SYLLABUS 2018 SCHEME.pdf
 
Remote sensing by jitendra thakor
Remote sensing by jitendra thakorRemote sensing by jitendra thakor
Remote sensing by jitendra thakor
 
Remote Sensing - Fundamentals
Remote Sensing - FundamentalsRemote Sensing - Fundamentals
Remote Sensing - Fundamentals
 
passive and active remote sensing systems, characteristics and operations
passive and active remote sensing systems,  characteristics and operationspassive and active remote sensing systems,  characteristics and operations
passive and active remote sensing systems, characteristics and operations
 

Recently uploaded

Gas measurement O2,Co2,& ph) 04/2024.pptx
Gas measurement O2,Co2,& ph) 04/2024.pptxGas measurement O2,Co2,& ph) 04/2024.pptx
Gas measurement O2,Co2,& ph) 04/2024.pptxDr.Ibrahim Hassaan
 
Planning a health career 4th Quarter.pptx
Planning a health career 4th Quarter.pptxPlanning a health career 4th Quarter.pptx
Planning a health career 4th Quarter.pptxLigayaBacuel1
 
Introduction to ArtificiaI Intelligence in Higher Education
Introduction to ArtificiaI Intelligence in Higher EducationIntroduction to ArtificiaI Intelligence in Higher Education
Introduction to ArtificiaI Intelligence in Higher Educationpboyjonauth
 
Field Attribute Index Feature in Odoo 17
Field Attribute Index Feature in Odoo 17Field Attribute Index Feature in Odoo 17
Field Attribute Index Feature in Odoo 17Celine George
 
Introduction to AI in Higher Education_draft.pptx
Introduction to AI in Higher Education_draft.pptxIntroduction to AI in Higher Education_draft.pptx
Introduction to AI in Higher Education_draft.pptxpboyjonauth
 
Alper Gobel In Media Res Media Component
Alper Gobel In Media Res Media ComponentAlper Gobel In Media Res Media Component
Alper Gobel In Media Res Media ComponentInMediaRes1
 
ECONOMIC CONTEXT - LONG FORM TV DRAMA - PPT
ECONOMIC CONTEXT - LONG FORM TV DRAMA - PPTECONOMIC CONTEXT - LONG FORM TV DRAMA - PPT
ECONOMIC CONTEXT - LONG FORM TV DRAMA - PPTiammrhaywood
 
call girls in Kamla Market (DELHI) 🔝 >༒9953330565🔝 genuine Escort Service 🔝✔️✔️
call girls in Kamla Market (DELHI) 🔝 >༒9953330565🔝 genuine Escort Service 🔝✔️✔️call girls in Kamla Market (DELHI) 🔝 >༒9953330565🔝 genuine Escort Service 🔝✔️✔️
call girls in Kamla Market (DELHI) 🔝 >༒9953330565🔝 genuine Escort Service 🔝✔️✔️9953056974 Low Rate Call Girls In Saket, Delhi NCR
 
Solving Puzzles Benefits Everyone (English).pptx
Solving Puzzles Benefits Everyone (English).pptxSolving Puzzles Benefits Everyone (English).pptx
Solving Puzzles Benefits Everyone (English).pptxOH TEIK BIN
 
Hierarchy of management that covers different levels of management
Hierarchy of management that covers different levels of managementHierarchy of management that covers different levels of management
Hierarchy of management that covers different levels of managementmkooblal
 
AmericanHighSchoolsprezentacijaoskolama.
AmericanHighSchoolsprezentacijaoskolama.AmericanHighSchoolsprezentacijaoskolama.
AmericanHighSchoolsprezentacijaoskolama.arsicmarija21
 
Framing an Appropriate Research Question 6b9b26d93da94caf993c038d9efcdedb.pdf
Framing an Appropriate Research Question 6b9b26d93da94caf993c038d9efcdedb.pdfFraming an Appropriate Research Question 6b9b26d93da94caf993c038d9efcdedb.pdf
Framing an Appropriate Research Question 6b9b26d93da94caf993c038d9efcdedb.pdfUjwalaBharambe
 
Grade 9 Q4-MELC1-Active and Passive Voice.pptx
Grade 9 Q4-MELC1-Active and Passive Voice.pptxGrade 9 Q4-MELC1-Active and Passive Voice.pptx
Grade 9 Q4-MELC1-Active and Passive Voice.pptxChelloAnnAsuncion2
 
Computed Fields and api Depends in the Odoo 17
Computed Fields and api Depends in the Odoo 17Computed Fields and api Depends in the Odoo 17
Computed Fields and api Depends in the Odoo 17Celine George
 
Quarter 4 Peace-education.pptx Catch Up Friday
Quarter 4 Peace-education.pptx Catch Up FridayQuarter 4 Peace-education.pptx Catch Up Friday
Quarter 4 Peace-education.pptx Catch Up FridayMakMakNepo
 
How to do quick user assign in kanban in Odoo 17 ERP
How to do quick user assign in kanban in Odoo 17 ERPHow to do quick user assign in kanban in Odoo 17 ERP
How to do quick user assign in kanban in Odoo 17 ERPCeline George
 
Judging the Relevance and worth of ideas part 2.pptx
Judging the Relevance  and worth of ideas part 2.pptxJudging the Relevance  and worth of ideas part 2.pptx
Judging the Relevance and worth of ideas part 2.pptxSherlyMaeNeri
 
Crayon Activity Handout For the Crayon A
Crayon Activity Handout For the Crayon ACrayon Activity Handout For the Crayon A
Crayon Activity Handout For the Crayon AUnboundStockton
 

Recently uploaded (20)

Gas measurement O2,Co2,& ph) 04/2024.pptx
Gas measurement O2,Co2,& ph) 04/2024.pptxGas measurement O2,Co2,& ph) 04/2024.pptx
Gas measurement O2,Co2,& ph) 04/2024.pptx
 
Planning a health career 4th Quarter.pptx
Planning a health career 4th Quarter.pptxPlanning a health career 4th Quarter.pptx
Planning a health career 4th Quarter.pptx
 
Introduction to ArtificiaI Intelligence in Higher Education
Introduction to ArtificiaI Intelligence in Higher EducationIntroduction to ArtificiaI Intelligence in Higher Education
Introduction to ArtificiaI Intelligence in Higher Education
 
Field Attribute Index Feature in Odoo 17
Field Attribute Index Feature in Odoo 17Field Attribute Index Feature in Odoo 17
Field Attribute Index Feature in Odoo 17
 
Introduction to AI in Higher Education_draft.pptx
Introduction to AI in Higher Education_draft.pptxIntroduction to AI in Higher Education_draft.pptx
Introduction to AI in Higher Education_draft.pptx
 
Alper Gobel In Media Res Media Component
Alper Gobel In Media Res Media ComponentAlper Gobel In Media Res Media Component
Alper Gobel In Media Res Media Component
 
Rapple "Scholarly Communications and the Sustainable Development Goals"
Rapple "Scholarly Communications and the Sustainable Development Goals"Rapple "Scholarly Communications and the Sustainable Development Goals"
Rapple "Scholarly Communications and the Sustainable Development Goals"
 
ECONOMIC CONTEXT - LONG FORM TV DRAMA - PPT
ECONOMIC CONTEXT - LONG FORM TV DRAMA - PPTECONOMIC CONTEXT - LONG FORM TV DRAMA - PPT
ECONOMIC CONTEXT - LONG FORM TV DRAMA - PPT
 
call girls in Kamla Market (DELHI) 🔝 >༒9953330565🔝 genuine Escort Service 🔝✔️✔️
call girls in Kamla Market (DELHI) 🔝 >༒9953330565🔝 genuine Escort Service 🔝✔️✔️call girls in Kamla Market (DELHI) 🔝 >༒9953330565🔝 genuine Escort Service 🔝✔️✔️
call girls in Kamla Market (DELHI) 🔝 >༒9953330565🔝 genuine Escort Service 🔝✔️✔️
 
Solving Puzzles Benefits Everyone (English).pptx
Solving Puzzles Benefits Everyone (English).pptxSolving Puzzles Benefits Everyone (English).pptx
Solving Puzzles Benefits Everyone (English).pptx
 
Hierarchy of management that covers different levels of management
Hierarchy of management that covers different levels of managementHierarchy of management that covers different levels of management
Hierarchy of management that covers different levels of management
 
AmericanHighSchoolsprezentacijaoskolama.
AmericanHighSchoolsprezentacijaoskolama.AmericanHighSchoolsprezentacijaoskolama.
AmericanHighSchoolsprezentacijaoskolama.
 
Raw materials used in Herbal Cosmetics.pptx
Raw materials used in Herbal Cosmetics.pptxRaw materials used in Herbal Cosmetics.pptx
Raw materials used in Herbal Cosmetics.pptx
 
Framing an Appropriate Research Question 6b9b26d93da94caf993c038d9efcdedb.pdf
Framing an Appropriate Research Question 6b9b26d93da94caf993c038d9efcdedb.pdfFraming an Appropriate Research Question 6b9b26d93da94caf993c038d9efcdedb.pdf
Framing an Appropriate Research Question 6b9b26d93da94caf993c038d9efcdedb.pdf
 
Grade 9 Q4-MELC1-Active and Passive Voice.pptx
Grade 9 Q4-MELC1-Active and Passive Voice.pptxGrade 9 Q4-MELC1-Active and Passive Voice.pptx
Grade 9 Q4-MELC1-Active and Passive Voice.pptx
 
Computed Fields and api Depends in the Odoo 17
Computed Fields and api Depends in the Odoo 17Computed Fields and api Depends in the Odoo 17
Computed Fields and api Depends in the Odoo 17
 
Quarter 4 Peace-education.pptx Catch Up Friday
Quarter 4 Peace-education.pptx Catch Up FridayQuarter 4 Peace-education.pptx Catch Up Friday
Quarter 4 Peace-education.pptx Catch Up Friday
 
How to do quick user assign in kanban in Odoo 17 ERP
How to do quick user assign in kanban in Odoo 17 ERPHow to do quick user assign in kanban in Odoo 17 ERP
How to do quick user assign in kanban in Odoo 17 ERP
 
Judging the Relevance and worth of ideas part 2.pptx
Judging the Relevance  and worth of ideas part 2.pptxJudging the Relevance  and worth of ideas part 2.pptx
Judging the Relevance and worth of ideas part 2.pptx
 
Crayon Activity Handout For the Crayon A
Crayon Activity Handout For the Crayon ACrayon Activity Handout For the Crayon A
Crayon Activity Handout For the Crayon A
 

Remote Sensing Principles and Applications Guide

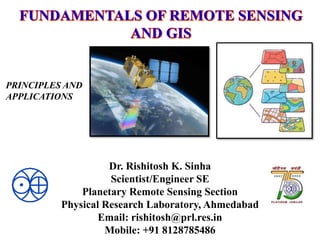
  • 1. Dr. Rishitosh K. Sinha Scientist/Engineer SE Planetary Remote Sensing Section Physical Research Laboratory, Ahmedabad Email: rishitosh@prl.res.in Mobile: +91 8128785486 PRINCIPLES AND APPLICATIONS
  • 2.
  • 3. What is Remote Sensing? Remote sensing is the science (and to some extent, art) of acquiring information about any planet’s surface without actually being in contact with it. This is done by sensing and recording reflected or emitted energy and processing, analyzing, and applying that information. Remote sensing is the process of detecting and monitoring the physical characteristics of an area by measuring its reflected and emitted radiation at a distance (typically from satellite or aircraft).
  • 4. Energy Source or Illumination (A) – the first requirement for remote sensing is to have an energy source which illuminates or provides electromagnetic energy to the target of interest. Radiation and the Atmosphere (B) – as the energy travels from its source to the target, it will come in contact with and interact with the atmosphere it passes through. This interaction may take place a second time as the energy travels from the target to the sensor. Interaction with the Target (C) - once the energy makes its way to the target through the atmosphere, it interacts with the target depending on the properties of both the target and the radiation. Recording of Energy by the Sensor (D) - after the energy has been scattered by, or emitted from the target, we require a sensor (remote - not in contact with the target) to collect and record the electromagnetic radiation. Transmission, Reception, and Processing (E) - the energy recorded by the sensor has to be transmitted, often in electronic form, to a receiving and processing station where the data are processed into an image (hardcopy and/or digital). Interpretation and Analysis (F) - the processed image is interpreted, visually and/or digitally or electronically, to extract information about the target which was illuminated. Application (G)
  • 5. What is Electromagnetic Radiation? The first requirement for remote sensing is to have an energy source to illuminate the target. This energy is in the form of Electromagnetic radiation. The above diagram shows an electromagnetic wave propogating in the x direction, if the electric field is in the y direction and the magnetic in the z direction. Electromagnetic radiation consists of an electrical field (E) which varies in magnitude in a direction perpendicular to the direction in which the radiation is traveling, and a magnetic field (M) oriented at right angles to the electrical field. Both these fields travel at the speed of light (c).
  • 6. What is Electromagnetic Radiation? Low frequency Medium frequency High frequency Inversely proportional Wavelength is the length of one wave cycle. It is measured in nanometers, micrometers etc. Frequency refers to the number of cycles of a wave passing a fixed point per unit of time. It is normally measured in hertz (Hz), equivalent to one cycle per second.
  • 7. What is Electromagnetic Spectrum? The electromagnetic spectrum ranges from the shorter wavelengths (including gamma and x-rays) to the longer wavelengths (including microwaves and broadcast radio waves). There are several regions of the electromagnetic spectrum which are useful for remote sensing. Use in remote sensing:
  • 8. Interactions with the Atmosphere Before radiation used for remote sensing reaches the planet's surface it has to travel through some distance of the planet's atmosphere. Particles and gases in the atmosphere can affect the incoming light and radiation. These effects are caused by the mechanisms of scattering and absorption. Scattering refers to a change in the direction of motion of a particle because of a collision with another particle. How much scattering takes place depends on several factors including the wavelength of the radiation, the abundance of particles or gases, and the distance the radiation travels through the atmosphere. There are three (3) types of scattering which take place. Rayleigh scattering occurs when particles are very small compared to the wavelength of the radiation (small specks of dust or nitrogen and oxygen molecules). Mie scattering occurs when the particles are just about the same size as the wavelength of the radiation (Dust, pollen, smoke and water vapour). The final scattering mechanism of importance is called nonselective scattering. This occurs when the particles are much larger than the wavelength of the radiation (water droplets and dust).
  • 9. The blue colour of the sky results from Rayleigh scattering, as the size of the gas particles in the atmosphere is much smaller than the wavelength of visible light. Rayleigh scattering is much greater for blue light than for other colours due to its shorter wavelength. As sunlight passes through the atmosphere, its blue component is Rayleigh scattered strongly by atmospheric gases but the longer wavelength (e.g. red/yellow) components are not. The sunlight arriving directly from the Sun therefore appears to be slightly yellow, while the light scattered through rest of the sky appears blue. In contrast, the water droplets that make up clouds are of a comparable size to the wavelengths in visible light, and the scattering is described by Mie's model rather than that of Rayleigh. Here, all wavelengths of visible light are scattered approximately identically, and the clouds therefore appear to be white or grey.
  • 11. Target Interactions We refer to two types of reflection, which represent the two extreme ends of the way in which energy is reflected from a target: specular reflection and diffuse reflection.
  • 12.
  • 14.
  • 15. Satellite Characteristics: Orbits and Swaths The path followed by a satellite is referred to as its orbit.
  • 16.
  • 17. Spatial Resolution, Pixel Size, and Scale The detail discernible in an image is dependent on the spatial resolution of the sensor and refers to the size of the smallest possible feature that can be detected. Spatial resolution of passive sensors depends primarily on their Instantaneous Field of View (IFOV). The IFOV is the angular cone of visibility of the sensor (A) and determines the area on the Earth's surface which is "seen" from a given altitude at one particular moment in time (B). The size of the area viewed is determined by multiplying the IFOV by the distance from the ground to the sensor (C). This area on the ground is called the resolution cell and determines a sensor's maximum spatial resolution.
  • 18.
  • 19. Spectral Resolution The higher the number of bands of a remote sensing sensor, the higher the spectral resolution of a satellite. Using several bands for earth observation, these techniques are called multispectral remote sensing. But there are sensors with 200 or more bands as well; those systems are not called multispectral but hyperspectral. Two fundamental conditions have to be considered in order to determine which spectral bands are appropriate for a sensor: On the one hand, the atmospheric window and, on the other hand, the spectral signature of the object in question.
  • 20.
  • 21.
  • 22. Radiometric Resolution Every time an image is acquired on film or by a sensor, its sensitivity to the magnitude of the electromagnetic energy determines the radiometric resolution. The radiometric resolution of an imaging system describes its ability to discriminate very slight differences in energy The finer the radiometric resolution of a sensor, the more sensitive it is to detecting small differences in reflected or emitted energy.
  • 23. Temporal Resolution The revisit period of a satellite sensor is usually several days. Therefore the absolute temporal resolution of a remote sensing system to image the exact same area at the same viewing angle a second time is equal to this period.
  • 24. True and false colour composites
  • 25. Image Analysis – Visual interpretation
  • 26.
  • 34.
  • 35.
  • 37. Digital Image Processing All image interpretation and analysis involves some element of digital processing. In order to process remote sensing imagery digitally, the data must be recorded and available in a digital form suitable for storage on a computer tape or disk. Image processing functions available in image analysis systems can be categorized into the following four categories: • Preprocessing: required prior to analysis/interpretation of the image • Image Enhancement: mainly done to improve the appearance of the image to enhance interpretation from the image (applied to increase differences between features within an image) • Image Transformation: similar to image enhancement; however, the transformation involve combined processing of images from multiple bands • Image Classification and Analysis: used to digitally identify and classify pixels in the data.
  • 38. Preprocessing Landsat – 7 Image Destriping
  • 41.
  • 42.
  • 43. Image Classification There are two broad subdivisions based on the methods used: 1. supervised classification, 2. and unsupervised classification. In a supervised classification, the analyst identifies in the imagery homogeneous representative samples of the different surface cover types (information classes) of interest. These samples are referred to as training areas. The computer uses a special program or algorithm (of which there are several variations), to determine the numerical "signatures" for each training class. Once the computer has determined the signatures for each class, each pixel in the image is compared to these signatures and labeled as the class it most closely "resembles" digitally. Thus, in a supervised classification we are first identifying the information classes which are then used to determine the spectral classes which represent them.
  • 45. In unsupervised classification, spectral classes are grouped first, based solely on the numerical information in the data, and are then matched by the analyst to information classes (if possible). Programs, called clustering algorithms, are used to determine the natural (statistical) groupings or structures in the data. Usually, the analyst specifies how many groups or clusters are to be looked for in the data. The final result of this iterative clustering process may result in some clusters that the analyst will want to subsequently combine, or clusters that should be broken down further - each of these requiring a further application of the clustering algorithm. Thus, unsupervised classification is not completely without human intervention. However, it does not start with a pre-determined set of classes as in a supervised classification.
  • 47. Supervised and Unsupervised Classification
  • 48. Information Technology and Geography 1. What is Information? 2. What is Geographic Information? 3. What are Geographic Information System?
  • 49. What is Information? • Information is data that have been organized (processed) and communicated in a meaningful manner. • Data is converted into information and information is converted into knowledge.
  • 50. What is Information? Quantity Bucket number Item name Quantity of items 25 2 Fruits and vegetables 12 apples+13 potatoes 30 1 Vegetables 12 onions+15 potatoes+3 brinjal 21 5 Fruits 12 mangoes+5 apples+4 oranges 19 7 Eggs 19 eggs 24 3 Fruits, vegetables, and eggs 8 apples+12 potatoes+4 eggs 06 6 Vegetables 6 potatoes 21 4 Fruits and vegetables 15 oranges+6 onions Data
  • 51. Quantity Bucket number Item name Quantity of items 25 2 Fruits and vegetables 12 apples+13 potatoes 30 1 Vegetables 12 onions+15 potatoes+3 brinjal 21 5 Fruits 12 mangoes+5 apples+4 oranges 19 7 Eggs 19 eggs 24 3 Fruits, vegetables, and eggs 8 apples+12 potatoes+4 eggs 06 6 Vegetables 6 potatoes 21 4 Fruits and vegetables 15 oranges+6 onions What is Information? Information Data
  • 52. What is Geographic Information? Geographic information describes: • Physical location from where the information is coming • Relationship between associated objects included in the information Name and location of cities • Population • Temperature • Distance • Density • Land use
  • 53. • Spatially related • Can be assigned coordinates or any spatial reference. • On the surface of the earth. • Involves location and organization. • Scale • Can be from general to specific. • Simple to complex. • Dynamics • Spatial dynamics (variations in space). • Temporal dynamics (variations in time). Coordinate system Scale Time 1 Time 2 What is Geographic Information?
  • 54. What is Geographic Information System? • A geographic information system (GIS) integrates hardware, software, and data for capturing, managing, analyzing, and displaying all forms of geographic information. • GIS allows us to view, understand, question, interpret, and visualize data in many ways that reveal relationships, patterns, and trends in the form of maps, globes, reports, and charts. • A GIS helps you answer questions and solve problems by looking at your data in a way that is quickly understood and easily shared. • GIS technology can be integrated into any enterprise information system framework.
  • 55.
  • 56. What is Geographic Information System? Geographic Information System Encoding • Information Systems • Information system specializing in the input, storage, manipulation, analysis and reporting of geographical (spatially related) information. Management Reporting Analysis Digitizing maps Encoding spatial data (census, vegetation, topography, etc…) Geographic database in a spatial data format Spatial analysis Thematic maps
  • 57. Key features of GIS • Information from different sources  Computer databases  Digital maps  GPS receiver  Satellite image • Data integration • Projection • Information retrieval • Data output • Overlay
  • 58. Key components of GIS Methods People Informa- tion Software Hardware GIS • Hardware Hardware is the computer on which a GIS operates. • Software GIS software provides the functions and tools needed to store, analyze and display the geographic information. • People GIS users range from technical specialists who design and maintain the system, to those who use it to help them do their everyday work. • Methods A successful GIS operates according to a well- designed plan and business rules, which are the models and operating practices unique to each organization. • Information Geographic information and related tabular data can be collected in-house or bought from a commercial data provider. Most GIS employ a DBMS to create and maintain a database to help organize and manage data and information.
  • 59. Data representation in GIS • Raster Data  Represent images as a collection of pixels  A grid of cells covering an image / area  Higher data volume  Example of raster formats  GeoTiff  ARC/INFO ASCII Grid  ARC/INFO GRID  ECW  IMG • Vector Data  Use geometrical shapes (Lines, Points, Polygons)  Low data volume  Example of vector formats  Shape files  MapInfo TAB
  • 60. Data representation in GIS • RASTER • VECTOR • Real World
  • 61. Entity representation in GIS Points - simplest element, no length or Width. Lines (arcs) - set of connected points, must have a beginning and an ending point. Polygons - set of connected lines, can be used to describe a feature as having an area. We typically represent objects in space as three distinct spatial elements: We use these three spatial elements to represent real world features and attach locational information to them.
  • 62. Data types in GIS Spatial/Geospatial/Geographic Data • Latitude and longitude • Street address • x and y coordinates • Range and township • Location shown on a map Non Spatial Data • Name • Gender • Income • ID number
  • 64. Data Assembly Maps RSI Intel Database Direct Entry Keyboard GPS Functions in GIS
  • 65. GIS Desktop GIS Web GIS Mobile GIS Types of GIS The two primary desktop applications for GIS professionals are ArcMap and ArcGIS Pro, and both are part of ArcGIS Desktop. Web GIS is a type of distributed information system, comprising at least a server and a client, where the server is a GIS server and the client is a web browser, desktop application, or mobile application. A mobile GIS allows users out in the field to capture, store, update, manipulate, analyze, and display geospatial data and information.
  • 66. Why to use GIS? If you have a question, a map, tabular data, a computer, and a GIS software application, you can utilize GIS to answer your question. Who uses GIS? GIS are rapidly becoming the essential tools of analysis at all levels of public- and private-sector management, administration and planning. People with the skill to use GIS are in demand across a broad range of professions, in government, business and nonprofit organizations. How to use GIS? GIS provides a set of tools for planning, decision-making, operations management and inventory. GIS has a wide range of applications.
  • 67. What we can do with GIS