
Recommended
More Related Content
Similar to Optimal Decisions Between Closure & Partial Production During a COVID-19 Quarantine
Similar to Optimal Decisions Between Closure & Partial Production During a COVID-19 Quarantine (20)
Recently uploaded
Recently uploaded (20)
Optimal Decisions Between Closure & Partial Production During a COVID-19 Quarantine
- 1. 1 Optimal Decisions Between Closure and Partial Production in an Assembly Vehicle Plant During and After a COVID-19 Quarantine? Application of Real Options and Corporate Strategy to Optimal Respond to a New Vehicle Demand under uncertainty By: Héctor C. Ruiz; MIB, Norwegian School of Economics, www.NHH.no & Rotterdam School of Business, www.RSM.nl, Erasmus University, hcruiz897@gmail.com April, 2020 Abstract By presenting a fictional case in a COVID-19 economic context, I aim to show that Real Option Analisis can be applied to decide when is optimal to close or continue producing vehicles in an assembly plant. The market demand for vehicle segments of an international brand assembly plant suffers because the disposable income to sell new vehicles (exported and domestic) is reduced by unemployed customers and firms with less business activity. The price of vehicles is assumed to be stable due to fair competition, but purchasing orders from dealers are subject to the current market crisis. Under this context of uncertainty about the quarantine duration and the type of recovery, (with a “V” or “U” shape) a plant manager should decide between two basic scenarios; the suspension of activities and, the continuation of activities at a lower production rate, according to the expected dealers demand, but paying a certain percentage of wages to its production line employees. Every 2 weeks, new data is received about: the vehicle quantity to be produced, inputs from suppliers, and the health of human capital technicians and engineers. With such information incorporated into a Real Option Analysis (ROA), the board of directors will know: when it is convenient to keep producing under a "slowdown production" or else, halt production, and when to switch between these two alternatives. The parameters of the scenarios can be easily adjusted with real data every two weeks. The main benefits are firstly, to be able to adjust internal parameters to current circumstances, and secondly, to take decisions following an optimal path under any future scenario. The results show that a Real Option Analysis can be applied to manufacturing cases, (not only to the typical long-term cases in oil fields, mines and sustainable exploitation of natural resources), and then act strategically, ˗in particular, before competitors who do not apply ROA˗, under any future COVID-19 economic landscape.
- 2. 2 Case-Problem The director of an assembly plant (a manufacturing plant) in Mexico, wishes to know under any future conditions, reflected in any of the parameters listed below, when should he halt or continue producing vehicles during or at the end of, the sanitary emergency caused by the COVID-19 virus economic crises. The main uncertainty variable, and for now, the only one, is then, the number of vehicles to be produced. The director can then balance the total cost caused by the quarantine every 2-weeks, with the benefit of keeping the Manufacturing Production Cost reduced, albeit a reduced production (pre-estimated for the second and third quarters of 2020) consistent with a low production rate according to exports mainly from Mexico to North America, and the Mexican country demand. It is assumed that every 2-week periods, information is received from: a) distributors who demand vehicle quantities to be produced b) input suppliers, c) doctors who report the health of team workers involved in direct operations, and d) the state and federal government who may, possibly, offer tax facilities or incentives for sales In the “technical shutdown” scenario.- the plant manager negotiates a wage-cut with the overhead administration, engineers and the union of technicians. In the “continuous, but reduced operation, scenario”.- there is a benefit expressed, eventually, in some “Free Cash Flow” (FCF). The whole firm market risk is reflected in the “Beta” of shares of the case-company and was taken form public reports in the New York Stock Exchange. In building this scenario, financial ratios from the case-firm and other listed corporations within the automakers sectors where searched and compared to the case-firm in order to deduce key parameters, such as: the Opportunity Cost generated while operating under a normal situation (expressed in FCF terms), and the required “Manufacturing Operating Cost” or “Cost of Goods in Manufacture” (CoGM), although adding the partial payment of wages mentioned above. A) Determine, with an expected reduction of 40% in the quantity of vehicles to be produced during a 2-week quarantine, whether it is convenient to keep the plant operating, or else, to close or interrupt production. Assume that new information will be available by the end of the 2-weeks period when it can be re-assessed to reduced production, and decide once again either to shut-down or continue the reduced vehicle production. B) If it is convenient to continue production, determine three strategic parameters and say what value they should have to change the decision from "continue" to "technical shutdown" (or vice versa). Design a financial model to determine the decision change values. C) Consider a COVID-19 quarantine of 2 future periods (4-weeks), and show the optimal path to follow under any future combination of key variables. Assume reasonable increments of variation in the main key variable (FCFs). Show why the result is optimal, for example: close-close-open.
- 3. 3 Data for both scenarios and partial results Both scenarios are summarized in the following variables along with a few partial results. Scenario with Plant Production at a slow pace: Reported; Assembly plant vehicle production = 58,687 On March, 2019 (21 days) *a Assumed; average price per vehicle = $18,000 USD / vehicle Implied; Gross Sales in March 2019 = $1,056 millions USD Reported; Net Income / Total Income = 2.76% Assumed; decision period (weeks in quarantine); T = 2 Weeks Net income in T weeks; 2019 = $0.13 millions USD Assumed; Declining demand rate (including exports) = 40% II & III quarter 2020 estimates Corresponding; Net Income in low production period; 2020 = $0.08 millions USD Reported; FCF / Net Income = 47.7% Assumed; growth rate for next year = - 3.0% -0.12% Per year For 2-weeks FCF in Low Production Period / (Cost of Capital - Growth rate) = Net Profit = VT = $10.422 millions USD Assumed; Risk-free rate in the corporate firm country; rf = 2.0% Annual rate Reported; Firm´s FCF / CoGM = 5.0% Reported; Net income / CoGManufacture = 3.30% Implicit Production-Manufacturing Cost in T-weeks; K = $2.3 millions USD Reported; Beta in the last 5 years (Volatility); =σ 1.23 0.62 Per Month and equivalent to: In 2-weeks *a) www.amia.com.mx/prodtot.html, for Nissan's monthly average, according to production from Jan. to Oct. 2019. Production Closure Scenario: Assumed; wage percentage paid (included in the COGM)= 50% When shutting down. Assumed; Operating Wages / COGM, in Mexico = 8% Assumed; Social Security wage rate = 33% Estimated cost of direct wages paid, included in the COGM = -0.092 millions in T weeks Assumption about Direct Workers in the assembly plant = 1,920 Assumed; average wage cost with health benefits and benefits = $1,307 USD / month Direct Costs in Paid Wages = -$1.255 millions in T weeks Unpaid Direct Salaries = $1.255 millions in T weeks Assumed; Highest marginal tax rate applied in Mexico = 37.58% Fiscal Shield for additional Wages Net Income = $0.472 millions USD Additional FCF from the Wage Fiscal Shield = $0.225 millions in T weeks Net Cost of Quarantine = Wages Paid + Fiscal Shield of Wages = $1.480 millions in T weeks Capital Cost in assembly plant = 12.0% 0.46% Annual & equivalent to in T weeks Present Value (PV) Paid for Quarantine Cost; VP ("Div") = $1.466 millions in T weeks FCFx = Vx = V + VP (Paid Quarantine Cost) = $11.899 millions USD
- 4. 4 Solution A) One calculates the value of “waiting”, or shutting down the plant while the quarantine lasts for T = 2 weeks with the Black-Scholes (B-S) formula, or applying the binomial option pricing model. For now the B-S formula will be used. Before, one needs to deduct the “postponed production” for T-weeks. The first table contains the Production Value in the continue production scenario, which is used as the opportunity cost lost to quarantine with in the next equation. The second table reports the VP of the net cost paid in direct wages during quarantine. Vx = FCF-foregone + VP (Cost Paid in Quarantine) = $11.889 million USD 1 Now the VP of Cost is used to generate production, which would be avoided when shutting down. VP (KT ) = VP (CoGMT ) = $2.271 USD millions The B-S formula is applied to assess the “Call option” or “waiting value” option during the quarantine. = 2.34 y d2 = d1 – √ T = 1.47σ Δ = N(d1) = 0.990 y N(d2) = 0.929 Thus, the value of closing operations or "waiting value" in quarantine implies: C(V) = Vx [N(d1) ] - PV(K) * [N(d2)] = $11.774 - $2.110 = $9.663 million USD In contrast, continuing operations today yields a result of: Net payment for producing vehicles ≈ FCF = $ 10,442 million USD Therefore, it is convenient to produce because the FCF of generating production; $ 10,422 is greater than $9,663 which corresponds to an FCF for shutting down the lines of vehicle production. 1- In financial options the VP of dividends is negative, here it would be unpaid wages, but the paid ones go with a positive sign. d1= (ln( Sx (PV (K) T ) )) (σ √T) + (σ √T ) 2
- 5. 5 Solution B) What parameters can be strategic drivers in the event of an unavoidable quarantine closure? Re-converting or restructuring production lines of vehicle pumps and fans towards the assembly or improved production of ventilators for hospitals that help Covid-19 patients to breathe, is undoubtedly a way to diversify income sources and use the productive capacities strategically in an automotive assembly plant. This is possible because vehicle plants have experience in supply chains, logistics, design and engineering teams, and technical employees capable of developing new skills and products in a short time. Besides this general comment, for the present case one can mention 3 strategic drivers: 1) As already mentioned, the quantity requested to produce, which depends on the income of customers in each market segment will affect the percentage of demand reduction. An internal survey among associated dealers will help the plant manager to adjust the percentage reduction of the units to be produced. In any case, the internal survey will be prioritized against external and general forecasts. 2) Tax incentives that the government grants or offers to all manufactures for an economic recovery reflected, say, in an accelerated investment deductions when replacing old polluting vehicles with new and less-polluting emission vehicles. Also, fiscal authorities can deduce or defer taxes when buying new vehicles, thereby reducing their retail sale price. 3) The cost of capital in the country where the company is located. Also, the stocks´ volatility, that can be affected by an unexpected appearance of an effective treatment to save infected people with COVID-19 and thus, reduce the length of mandatory quarantines. Using the variables in the two previous tables and the financial model in subsection A), the 3 aforementioned strategic parameters driving demand were modified and the results were as follows: One or two modified driver parameters Change value from “Continuation” to Closing operations (or vice versa) Reduction percentage of the number of units to produce 60.6% instead of the initial 40% Reduction percentage in vehicles to be produced and average retail sale price 60.6% instead of the initial 40% and $17,738 instead of the initial $18,000 price per unit Cost of Capital in the country of the corporate parent 155.3% instead of the initial 12% The payment to shareholders of the automaker would have to growth substantially before accepting an interruption of operations for 2-weeks.
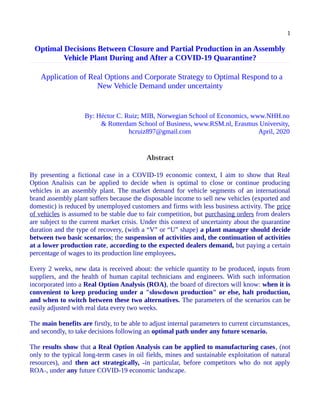
- 6. 6 Graph The graph shows the decision to between Continue or Close production in the vehicle assembly plant, in terms of the precise value in the FCF. The dotted line shows the FCF generated as production continues today. The yellow line reflects the present value of shutting down or interrupting production for two weeks, before deciding whether to continue or close. Therefore, the optimal strategy of investing to continue operations is to do so, only if the Net Payoff generated (FCF) exceeds $ 6,844 million USD. Solution C) The solution will be presented in Blog 2, soon. References For the financial ratios in the Financial Statements, as well as for the comparable values, the well-known site of: Yahoo Finance for: Nissan, Honda and Hyundai, was consulted. • https://es.finance.yahoo.com/quote/NSANY/financials?p=NSANY • https://es.finance.yahoo.com/quote/NSANY/cash-flow?p=NSANY • www.amia.com.mx/prodtot.html, was used for the Nissan Accumulated Production from Jan. to Oct. 2019, to estimate the total sales for March 2019. Also, more than half of units are compact light vehicles and the rest are light trucks. • Berk, J., DeMarzo, P., Corporate Finance, 2017, 4ed. Chap. 22. Consultant e-mail: The financial model to determine the decision change values can be applied to real cases. Readers or managers can send their cases, along with business context to the author to receive a price quotation for consulting services. For feedback or consulting matters please contact the author by mail. hcruiz897@gmail.com $ Net Payoff FCF K= COGManuf $2.3 $6.844 = FCF generated 80% 60.6% 40% = % reduction in sales compared to 2019 Stop Production. Continue Producing