Cheap Call Girls In Hyderabad Phone No 📞 9352988975 📞 Elite Escort Service Av...
Industry table chap.4
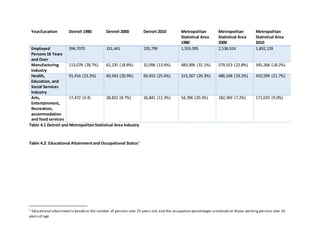
1. Year/Location Detroit 1980 Detroit 2000 Detroit 2010 Metropolitan
Statistical Area
1980
Metropolitan
Statistical Area
2000
Metropolitan
Statistical Area
2010
Employed
Persons16 Years
and Over
394,7070 331,441 235,799 1,555,095 2,538,924 1,892,139
Manufacturing
Industry
113,078 (28.7%) 62,235 (18.8%) 32,096 (13.6%) 483,906 (31.1%) 579,553 (22.8%) 345,268 (18.2%)
Health,
Education, and
Social Services
Industry
91,416 (23.2%) 69,343 (20.9%) 60,455 (25.6%) 315,267 (20.3%) 486,548 (19.2%) 410,599 (21.7%)
Arts,
Entertainment,
Recreation,
accommodation
and food services
17,472 (4.4) 28,822 (8.7%) 26,841 (11.3%) 54,396 (20.3%) 182,369 (7.2%) 171,033 (9.0%)
Table 4.1 Detroit and MetropolitanStatistical Area Industry
Table 4.2: Educational Attainmentand Occupational Status1
1 Educational attainmentis based on the number of persons over 25 years old,and the occupation percentages arebased on those workingpersons over 16
years of age