SlideShare a Scribd company logo
1 of 22
For a simple one floorhealthcare facility,the patientflow throughasingle roomwassimplifiedtothe
following:
Figure:X,patientflowthroughasingle room.
Thisservedasa basisforthe creationof a real time simulation whichoutputswaittimesand patient
throughputforspecificinputsdeterminedbythe user.
Process
Afterthe software isinstalledandexecuted,six variableswill have tobe inputbythe user:
1) Rooms:the numberof roomsavailable foruse.
2) Doctors: the numberof physiciansavailable fortreatingpatients.
3) Nurses:the numberof nursesavailableforpreparingroomswhichhave beenused.
4) TreatmentTime:The average time,inminutes,required forthe treatmentof apatient,taking
intoaccount the patientandphysiciantravel time toreachthe room.
5) RoomPreparationTime:The average time,inminutes,requiredforanurse to prepare a used
room,takingintoaccount the nurse’stravel time toreach the room.
6) PatientsperHour:The amountof patientssetto arrive,distributedevenlythroughouteach
hour.
A fewscreenshotsof the interfaceare showninthe appendix alongwiththe codingstructure.
The followingmightoccurduringthe inputprocess:
1) If a non-integeris enteredatanypoint,the userwill be notified andmustre-inputaninteger
value.
2) If the numberof doctorsis greateror lessthanthe numberof rooms,the userwill be notified.
3) If the numberof nursesisgreaterthan the numberof rooms,the userwill be notified.
4) If the treatmenttime inputismore than300 minutes,the userwill be notifiedand mustre-input
a value lessthan300.
5) If treatmenttime ismore than 2 hours,the userwill be notified.
6) If the roompreparationtime inputismore than300 minutes,the userwillbe notifiedand must
re-inputavalue lessthan300
7) If the roompreparationtime ismore than30 minutes,the userwillbe notified.
8) If the patientflowperhourismore than 600, the userwill be notifiedandmustre-inputavalue
lessthan600.
9) Duringthe inputof patientflowper Hour,the userisnotifiedthatpatientsare distributed
evenlythroughouteachhour. Itisalsoshownthat the simulationrunsfora 12 hourday, and
that patientswhose treatmenttime will exceed6pm will notbe admitted.
10) A recapof all inputsisshown, withthe optionof re-inputtingall variables orstartingthe
simulation.
Whenthe “Start Simulation”optionischosen,atimerstartstickingwhere one minute of simulation
time isequivalenttoone real-life hour.Since patientflow isdistributedevenlythroughoutthe hour,if a
flowof six patientsperhourischosen,the firstpatientwill arrive atthe 10th
minute of simulationtime
(10 secondsreal-time),andevery10minutesafter that.If the patient’streatmenttime will exceedthe
12 hour mark (12th
minute real-time),he will notbe admittedandthe flow stops.
A full roomusage cycle can be illustratedbylookingatfigure X above.If a patientarrivesandbotha
doctor and a roomare available the treatmentbegins. Afterthe treatmenttime iscomplete,the patient
leavesthe systemandthe doctorisready to take ina new patient.A nurse wouldthenprepare the
room inorderto make it available forfurtheruse.Afterthe roompreparationtime iscomplete,the
room isreadyto handle a newpatient.
To explainthis full roomusage cycle insimulation terms,considerthe defaultvalue of “patientswaiting”
inthe interface iszero.Everytime apatientarrives,thisvalue isincreasedby“1”.The defaultvaluesof
“Doctors Idle”and“Rooms Available”are the inputsgivenbythe user.Every6 secondsof simulation
time (0.1 secondsreal-time) the simulationchecksif the three aforementionedvariablesare greater
than zero.If theyare,theyare all decreasedby one. Afterthe value of “treatmenttime”insimulation
minuteshaspassed,the value of “patientspassed”and“DoctorsIdle”inthe interface increasesbyone.
If the value of “NursesIdle”ismore thanzero,it will thendecreasebyone.Afterthe value of “room
preparationtime”insimulationminuteshaspassed,the value of “Roomsavailable” and“NursesIdle”
increasesbyone.
Restrictions
Due to time and codingskill constraints,a numberof restrictionsare inherenttothe simulation.If these
restrictions were tobe removed,the abilitytogainmore meaningful andinsightfuldatawill increase.
Possible improvementsonthe simulationinclude:
- The abilitytoinputpreciselywheneachpatientarrives,or tochange arrivalsinto some set
distribution(e.g. Poisson/normaldistribution).
- The abilitytopause and change a variable while the simulationisrunning,suchasaddinga
doctor,changingtreatmenttime oraddinga suddenpatientinflux atsome pointduringthe
work day.
- Allowingthe simulationtorunfor a variable setof time insteadof a12 hour workday (12
minutesreal-time).
- Automaticgraphingandplotoutputs,tobe writtenintospreadsheetsoftware suchasMicrosoft
Excel.
- The optionto obtaininstantgraphoutputsinsteadof havingtowaitfor the simulation tofinish
runninginreal time,or at leastthe decrease of the ratioof real-timetosimulation-timesothat
it completes inlessthan12 minutes.
- More variable inputs (suchastool availability,roomusage time),andstandarddeviationfactors
for howlongtreatment androom preparationtimeslast.
- Changingthe code so that time valuesare more accurate than approximate.
- The abilityformore than one nurse to workon the same room, in orderto decrease room
preparationtime.
- Individualizedinsteadof cumulative idle andwaittimes;one foreachdoctor,patient,nurse and
room.
These are some of manypossible improvementsthatcanbe implementedtothe real-timesimulation
tool.
Optimization Example
To showhowthe tool can be usedto optimize a system, itisto be appliedona fictional facilitywhich
contains fouravailable treatmentrooms.
 For the firstrun, the followinginputswereset:
Table Y: first run input values
Rooms Doctors Nurses
Treatment Time
(min)
Room Prep Time
(min)
Patients per
Hour
4 3 2 30 10 8
The simulationwasrunfor 4 hours (4 minutesreal-time) while manuallytakingdatavaluesbypausing
every5th
of an hour(12 secondsreal-time).Thisdataisshownin table Z inthe appendix,andwasused
to create the two plots shownbelow.
Figure 1: firstrun variable status
Figure 2: firstrun cumulative idletimes
As can be seenfromthe figuresthe numberof available doctorsandroomsdecreasesovertime tozero
and remainsthere,while the cumulativedoctoridle time remainsata setconstantof about31 minutes.
Thisshowsthat all roomsand doctors are occupiedthroughoutmostof the 4 hours.
The amount of patientswaitingandcumulativepatientwaittime howeverare onan increase
throughoutmostof the 4 hours. There is no reasontocontinue the full runof the simulationasitis
apparentthat the currentinputscannothandle a flow of 8 patientsperhour.
In addition,there isatleastone nurse waitingthroughoutthe 4hours,while the cumulative nurse idle
time ison the rise.Thisindicatesthe systemhasmore nursesthanrequiredtoprepare the 4 roomsfor
thissetof inputs.
Thisrun succeededinpassing20 patients,with8waitingtheirturnbythe 4th
hour.
 In an attemptto maximize patientthroughput,the followinginputswere usedforthe second
run:
Table V: second run input values
Rooms Doctors Nurses
Treatment Time
(min)
Room Prep Time
(min)
Patients per
Hour
4 3 1 25 10 8
The simulationwasonce againrun for4 real-time minutes,while manuallytakingdataevery12 seconds.
Thisdata is shownin table B inthe appendix.
For thisrun,it was assumed5 minuteswere takenoff eachtreatmenttimeaverage inanattemptto
pass more patients.The numberof nurseswasalsodecreasedto1 inlightof the lastrun’sinformation.
Usingthe data intable B to plotthe same graphs yieldsthe followingfigures:
Figure 3 secondrun variable status
Figure 4: secondrun cumulative idle times
As can be seenfromthe figures,the amountof available roomsdecreasestozeroandremainsthere.
However,the numberof idle doctorsreaches1multiple timesthroughoutthe 4 hours,indicatingthat1
nurse wasnot enoughto prepare all 4 roomsin time forthissetof inputs.Thiscan be observedin figure
4, as the doctoridle time isrisingwhile the nurse idle timeflatlines.
Thisrun succeededinpassing21 patients,with7waitingtheirturnbythe 4th
hour.
 In lightof the secondrun,the numberof nursesavailablewasincreasedbackto2 in orderto
deal withthe decreasedtreatmenttime. Table K summarizesthe inputsusedinthe thirdrun:
Table K: third run input values
Rooms Doctors Nurses
Treatment Time
(min)
Room Prep Time
(min)
Patients per
Hour
4 3 2 25 10 8
Data was collectedinthe same methodasforthe firstand secondruns,and yieldedthe datashownin
table Q inthe appendix.The graphsacquiredfromthistable are shownbelow:
0
50
100
150
200
250
0 0.2 0.4 0.6 0.8 1 1.2 1.4 1.6 1.8 2 2.2 2.4 2.6 2.8 3 3.2 3.4 3.6 3.8 4
Time(min)
Time Elapsed (Hour)
Cumulative Patient Wait Time Cumulative Doctor Idle Time Cumulative Nurse Idle Time
Figure 5: thirdrun variable status
Figure 6: thirdrun cumulative idletimes
As can be deducedfrom figure 5,the numberof rooms and doctorsavailable decreasedtozeroand
remainedthere forthe mostpart.The amountof nursesidle remainedatone while the amountof
patientswaitingwas rising.
Eventhoughthe cumulative idle timesplotissimilartothe firstrun,decreasingthe treatmenttime by5
minutesallowedfor24 patientstobe passedinsteadof 20, withonly4 awaitingtreatmentinsteadof 8,
by the 4th
hour.
 For the fourthrun, the amountof doctorswas increasedby1 to testfor a possible increase in
patientthroughput.The follow table summarizesvariable inputsusedinthe fourthrun:
Table W: fourth run input values
Rooms Doctors Nurses
Treatment Time
(min)
Room Prep Time
(min)
Patients per
Hour
4 4 2 25 10 8
The simulationwasruninthe same manneras before,andthe followinggraphswere createdbasedon
table H inthe appendix:
Figure 7 fourthrun variable status
Figure 8 fourthrun cumulative idletimes
The fourthrun’s patientoutputwasidentical tothe thirdrun,butit had at least1 idle doctor
throughoutthe 4 hours,withthe cumulative doctoridle timeonaconstant rise.Thisindicatesthatthe
4th
physicianisnotneededforthissetof inputs,anddoesnothingtoaffectpatientoutput.
So far,the simulationhasshownthatforthissetof inputs,the facility isnotable to handle 8patients
perhour withoutthe costlyadditionof aroom or a furtherdecrease intreatmenttime,bothof which
can be impractical.
 For the fifthsimulationrun,the numberof doctorswasbroughtback to 3, and the simulation
was runto test the facility’sabilitytohandle 7patientsperhourinsteadof 8. The followingset
of data wasused:
Table L: fifth run input values
Rooms Doctors Nurses
Treatment Time
(min)
Room Prep Time
(min)
Patients per
Hour
4 3 2 25 10 7
Thistime,as nosignificantbackupof patientflow wasobserved,the simulationwasallowedtorunfor
the full 12 hours(12 minutesreal-time),while takingvaluesat12 secondintervals.The valuesobtained
are shownin table J in the appendix.Thisdatawasusedto obtainthe followingfigures:
Figure 9 fifthrunvariable status
Figure 10 fifthruncumulative idle times
By observingfigure 9above,itcan be seenthe amountof doctors and roomsdecreasedtozeroand
remainedthere forthe mostpart throughoutthe simulation. The maximumamountof patientsawaiting
treatmentat anygiventime was2.
Eventhoughthe cumulative patientwaittime increasesto501 minutes,all patientswere effectively
passedthroughthe system.Itisworth notingthatthe simulationstoppedthe patientin-flow half way
throughthe final hour(as theirtreatmenttime wouldexceedthe 12th
hour).Bythe 12th
hour,79
patientshave beenpassedwiththe final 2undertreatment.2of the 3 doctors are treatingthe final
patients,while1nurse iscleaninga room. Thiscomesout to 3 outof the 4 roomsare beingoccupied at
the endof the shift.
 A sixthsimulationrunwasconductedtotesthow the facilityhandles6patientsperhourwith
the same inputs.The followinginitial datawasused:
 Table N: sixth run input values
Rooms Doctors Nurses
Treatment Time
(min)
Room Prep Time
(min)
Patients per
Hour
4 3 2 25 10 6
Thisrun was alsoconductedforthe full 12 hours,and the resultsare shownin table E inthe appendix.
These resultswere usedtoplotthe graphsshownbelow:
Figure 11 sixthrunvariable status
Figure 12 fifthruncumulative idle times
As can be observedfrom figure 11,the amountof available roomsandidle doctorsbothcycledbetween
zeroand one,while the amountof idle nursesremainedatone throughoutmostof the simulation.
However,the numberof patientsawaitingtreatmentremainedatzerothroughthe whole duration.
0
1
2
3
4
0 0.8 1.6 2.4 3.2 4 4.8 5.6 6.4 7.2 8 8.8 9.6 10.4 11.2 12
Elapsed Time (Hours)
Rooms Available Doctors Idle Nurses Idle Patients Waiting
0
100
200
300
400
500
600
700
800
0
0.4
0.8
1.4
1.8
2.2
2.6
3
3.4
3.8
4.2
4.6
5
5.4
5.8
6.2
6.6
7
7.4
7.8
8.2
8.6
9
9.4
9.8
10.2
10.6
11
11.4
11.8
Time(min)
Cumulative Patient Wait Time Cumulative Doctor Idle Time Cumulative Nurse Idle Time
Both the doctor andnurse idle time isonthe increase,while the patientwaitingtime isnon-existent. At
the 12th
hour, all 69 patientshave beenpassed,andonly1roomwas occupiedbya nurse. It isworth
notingthat the simulationonce againstoppedadmittingpatientshalf waythroughthe final hourdue to
theirtreatmenttime exceedingthe 12th
hour.
The sixthrun indicatesthatthisfacilityisalmostperfectlyoptimizedforhandlingaflow of 6 patientsper
hour,for thissetof inputs.The patientthroughputismaximizedandpatientwaittime isminimized.
A final setof runswere conductedforthe full 12 hours,to testfor extranursesorphysicians.
 The seventh runinputstestedfor1 lessdoctorand 1 lessnurse:
Table G: seventh run input values
Rooms Doctors Nurses
Treatment Time
(min)
Room Prep Time
(min)
Patients per
Hour
4 2 1 25 10 6
55 patientswere passed,with12still awaitingtreatment.
 The eighthrun inputstestedforonly1lessdoctor:
Table S: seventh run input values
Rooms Doctors Nurses
Treatment Time
(min)
Room Prep Time
(min)
Patients per
Hour
4 2 2 25 10 6
55 patientswere passed,with12still awaitingtreatment.
 The ninthand final runinputstestedforonly1 lessnurse:
Table U: seventh run input values
Rooms Doctors Nurses
Treatment Time
(min)
Room Prep Time
(min)
Patients per
Hour
4 3 1 25 10 6
As withthe sixthrun,all 69 patientswere passed.However,the cumulative nurse idle timedecreased
from717 minutes(almostthe full 12hourduration) downto41 minutes, while the cumulative patient
waittime increasedfromzeroto only 7 minutes. 2roomswere occupiedby2 nursesat the endof the
shift.
Thisfinal iterationprovidesaperfectsetof conditionsforthe fictionalfacilityinquestion.
Appendix
The 4 interface graphsshouldbe here,startingwiththe one Isentthroughemail and continuinginthe
presentation’sorder
Data Tablesfor the optimizationruns,Idle andwaittimesare in“minutes”:
Table Z: first simulation run data output
Rooms
Available
Doctors
Idle
Nurses
Idle
Patients
Waiting
Patients
Passed
Cumulative
Patient
Wait Time
Cumulative
Doctor Idle
Time
Cumulative
Nurse Idle
Time
Time
Passed
(Hours)
4 3 2 0 0 0 0 0 0
3 2 2 0 0 0 10 10 0.2
2 1 2 0 0 0 20 20 0.4
1 0 2 1 0 3 23 33 0.6
0 0 1 1 1 15 23 45 0.8
0 0 1 1 3 27 28 52 1
0 0 1 2 4 40 28 65 1.2
0 0 1 2 5 51 28 76 1.4
0 0 1 3 6 63 31 85 1.6
0 0 1 3 7 75 31 97 1.8
0 0 1 4 8 87 31 109 2
0 0 1 4 10 99 31 121 2.2
0 0 1 4 11 111 31 133 2.4
0 0 1 5 12 123 31 145 2.6
0 0 1 5 13 135 31 157 2.8
0 0 1 6 14 147 31 169 3
0 0 1 6 16 159 31 181 3.2
0 0 1 6 17 171 31 193 3.4
0 0 1 7 18 183 31 205 3.6
0 0 1 7 19 195 31 217 3.8
0 0 1 8 20 207 31 229 4
Table B: second simulation run data output
Rooms
Available
Doctors
Idle
Nurses
Idle
Patients
Waiting
Patients
Passed
Cumulative
Patient
Wait Time
Cumulative
Doctor Idle
Time
Cumulative
Nurse Idle
Time
Time
Passed
(Hours)
4 3 1 0 0 0 0 0 0
3 2 1 0 0 0 9 9 0.2
2 1 1 0 0 0 21 21 0.4
0 0 0 0 1 3 23 33 0.6
0 0 0 0 2 8 25 33 0.8
0 0 0 1 3 19 30 33 1
0 1 0 2 5 31 37 33 1.2
0 1 0 2 6 43 44 33 1.4
0 1 0 3 7 55 51 33 1.6
0 0 0 2 8 67 57 33 1.8
0 0 0 3 9 79 62 33 2
0 0 1 4 11 92 68 33 2.2
0 0 1 4 12 103 75 33 2.4
0 1 0 5 13 115 82 34 2.6
0 0 0 4 14 127 88 34 2.8
0 0 0 5 15 140 94 34 3
0 0 0 6 16 151 99 34 3.2
0 1 0 6 18 163 106 34 3.4
0 1 0 7 19 176 113 34 3.6
0 0 0 6 20 187 120 34 3.8
0 0 0 7 21 199 125 34 4
Table Q: third simulation run data output
Rooms
Available
Doctors
Idle
Nurses
Idle
Patients
Waiting
Patients
Passed
Cumulative
Patient
Wait Time
Cumulative
Doctor Idle
Time
Cumulative
Nurse Idle
Time
Time
Passed
(Hours)
4 3 2 0 0 0 0 0 0
3 2 2 0 0 0 9 9 0.2
2 1 2 0 0 0 21 21 0.4
0 0 1 0 1 3 23 33 0.6
0 0 1 0 2 8 25 42 0.8
0 0 1 1 3 17 28 52 1
0 0 1 1 5 27 28 64 1.2
0 0 1 1 6 39 31 73 1.4
0 0 1 2 7 51 33 83 1.6
0 0 1 1 9 63 33 95 1.8
0 0 1 2 10 75 36 104 2
0 0 1 2 12 87 38 114 2.2
0 0 1 2 13 99 38 126 2.4
0 0 1 3 14 111 41 135 2.6
0 0 1 2 16 123 43 145 2.8
0 0 1 3 17 135 44 157 3
0 1 0 4 19 147 47 166 3.2
0 0 1 3 20 159 49 176 3.4
0 0 1 4 21 171 49 188 3.6
0 1 0 4 23 183 53 196 3.8
0 0 1 4 24 195 54 207 4
Table H: fourth simulation run data output
Rooms
Available
Doctors
Idle
Nurses
Idle
Patients
Waiting
Patients
Passed
Cumulative
Patient
Wait Time
Cumulative
Doctor Idle
Time
Cumulative
Nurse Idle
Time
Time
Passed
(Hours)
4 4 2 0 0 0 0 0 0
3 3 2 0 0 0 9 9 0.2
2 2 2 0 0 0 21 21 0.4
0 1 1 0 1 0 30 33 0.6
0 1 1 0 2 5 42 42 0.8
0 2 0 1 4 14 54 50 1
0 1 1 1 5 22 64 61 1.2
0 1 1 1 6 33 76 71 1.4
0 1 1 1 8 46 88 78 1.6
0 1 1 1 9 58 97 90 1.8
0 1 1 2 10 69 109 99 2
0 1 1 2 12 81 121 106 2.2
0 1 1 2 13 94 131 118 2.4
0 1 1 3 14 105 143 128 2.6
0 1 1 2 16 118 155 135 2.8
0 1 1 3 17 130 165 147 3
0 2 0 4 19 142 176 155 3.2
0 1 1 3 20 154 188 163 3.4
0 1 1 4 21 166 198 175 3.6
0 2 0 4 23 177 210 183 3.8
0 1 1 4 24 190 222 192 4
Table J: fifth simulation run data output
Rooms
Available
Doctors
Idle
Nurses
Idle
Patients
Waiting
Patients
Passed
Cumulative
Patient
Wait Time
Cumulative
Doctor Idle
Time
Cumulative
Nurse Idle
Time
Time
Passed
(Hours)
4 3 2 0 0 0 0 0 0
3 2 2 0 0 0 9 9 0.2
2 1 2 0 0 0 21 21 0.4
1 0 2 0 0 0 26 33 0.6
0 0 1 0 2 1 28 44 0.8
0 0 1 0 3 2 29 54 1
0 1 0 1 5 3 31 64 1.2
0 0 1 0 6 5 33 75 1.4
0 0 1 0 7 6 35 85 1.6
0 0 1 0 9 10 37 95 1.8
0 0 1 0 10 12 38 106 2
0 0 1 1 11 15 40 116 2.2
0 0 1 0 13 19 42 126 2.4
0 0 1 0 14 22 44 137 2.6
0 1 0 1 16 27 45 147 2.8
0 0 1 0 17 32 47 157 3
0 0 1 1 18 36 49 168 3.2
0 1 0 1 20 44 52 177 3.4
0 0 1 0 21 48 52 188 3.6
0 0 1 1 22 55 54 199 3.8
0 0 1 0 24 62 57 208 4
0 0 1 1 25 67 58 219 4.2
0 0 1 1 26 76 59 230 4.4
0 0 1 0 28 84 62 239 4.6
0 0 1 1 29 91 63 250 4.8
0 1 0 1 31 101 65 260 5
0 0 1 1 32 109 68 270 5.2
0 0 1 1 33 119 68 281 5.4
0 0 1 0 35 129 71 291 5.6
0 0 1 1 36 139 73 301 5.8
0 0 1 1 37 149 73 313 6
0 0 1 1 39 160 77 322 6.2
0 0 1 1 40 172 78 332 6.4
0 0 1 1 41 183 79 334 6.6
0 0 1 1 43 195 82 353 6.8
0 0 1 1 44 207 83 363 7
0 1 0 2 46 219 85 374 7.2
0 0 1 1 47 231 87 384 7.4
0 0 1 1 48 243 89 394 7.6
0 0 1 1 50 255 91 404 7.8
0 0 1 1 51 267 92 415 8
0 0 1 2 52 279 94 425 8.2
0 0 1 1 54 291 96 435 8.4
0 0 1 1 55 303 97 446 8.6
0 1 0 2 57 316 99 456 8.8
0 0 1 1 58 327 101 466 9
0 0 1 2 59 339 103 477 9.2
0 0 1 1 61 351 105 487 9.4
0 0 1 1 62 363 107 497 9.6
0 0 1 2 63 375 108 508 9.8
0 0 1 1 65 387 110 518 10
0 0 1 2 66 399 112 528 10.2
0 1 0 2 68 411 113 539 10.4
0 0 1 1 69 423 115 549 10.6
0 0 1 2 70 435 117 559 10.8
0 1 0 2 72 447 119 569 11
0 0 1 2 73 459 120 581 11.2
0 0 1 2 74 471 122 590 11.4
0 0 1 1 76 483 125 600 11.6
0 0 1 1 77 495 125 611 11.8
1 1 1 0 79 501 130 623 12
Table E: sixth simulation run data output
Rooms
Available
Doctors
Idle
Nurses
Idle
Patients
Waiting
Patients
Passed
Cumulative
Patient
Wait Time
Cumulative
Doctor Idle
Time
Cumulative
Nurse Idle
Time
Time
Passed
(Hours)
4 3 2 0 0 0 0 0 0
4 3 2 0 0 0 9 9 0.2
2 1 2 0 0 0 21 21 0.4
1 0 2 0 0 0 30 33 0.6
1 1 1 0 3 0 42 57 0.8
1 1 1 0 4 0 49 69 1.2
0 0 1 0 5 0 55 81 1.4
0 0 1 0 6 0 60 93 1.6
0 0 1 0 7 0 65 105 1.8
1 1 1 0 9 0 72 117 2
1 1 1 0 10 0 79 129 2.2
0 0 1 0 11 0 85 141 2.4
0 0 1 0 12 0 90 153 2.6
0 0 1 0 13 0 95 165 2.8
1 1 1 0 15 0 102 177 3
1 1 1 0 16 0 109 189 3.2
0 0 1 0 17 0 115 201 3.4
0 0 1 0 18 0 120 231 3.6
0 0 1 0 19 0 125 235 3.8
1 1 1 0 21 0 132 237 4
1 1 1 0 22 0 139 249 4.2
0 0 1 0 23 0 145 261 4.4
0 0 1 0 24 0 150 273 4.6
0 0 1 0 25 0 155 285 4.8
1 1 1 0 27 0 162 297 5
1 1 1 0 28 0 169 310 5.2
0 0 1 0 29 0 175 321 5.4
0 0 1 0 30 0 180 333 5.6
0 0 1 0 31 0 185 345 5.8
1 1 1 0 33 0 192 357 6
0 0 1 0 34 0 200 370 6.2
0 0 1 0 35 0 205 381 6.4
0 0 1 0 36 0 210 393 6.6
0 0 1 0 37 0 215 405 6.8
1 1 1 0 39 0 221 417 7
1 1 1 0 40 0 229 429 7.2
0 0 1 0 41 0 235 441 7.4
0 0 1 0 42 0 240 453 7.6
0 0 1 0 43 0 245 465 7.8
1 1 1 0 45 0 251 477 8
1 1 1 0 46 0 258 488 8.2
0 0 1 0 47 0 265 501 8.4
0 0 1 0 48 0 270 513 8.6
0 0 1 0 49 0 275 524 8.8
1 1 1 0 51 0 281 536 9
1 1 1 0 52 0 289 549 9.2
0 0 1 0 53 0 295 561 9.4
0 0 1 0 54 0 300 573 9.6
0 0 1 0 55 0 305 585 9.8
1 1 1 0 57 0 312 597 10
1 1 1 0 58 0 319 609 10.2
0 0 1 0 59 0 325 621 10.4
0 0 1 0 60 0 330 632 10.6
0 0 1 0 61 0 335 644 10.8
1 1 1 0 63 0 341 656 11
1 1 1 0 64 0 348 668 11.2
0 0 1 0 65 0 355 680 11.4
0 0 1 0 66 0 360 692 11.6
1 1 1 0 67 0 369 704 11.8
3 3 1 0 69 0 382 717 12
Real time simulationcode:
The real time simulationwascreatedusing001 game creator v.1.014.001
http://www.engine001.com
 Graphical representationof software initiation(variableinputs):
http://www.engine001.com/script/PtyxFE
 Graphical representationof Timerticks(every0.1secondsonce simulationstarts):
http://www.engine001.com/script/xyp9ZR
 Textual code of software initiation(variableinputs):
SET Actor("main").NonExistent = 1
:g2
MsgBox.Show("Welcome to the Automated Patient System Simulation.¶Please Input Number of Rooms:T")
MsgBox.Hide
SET Rooms = MsgBox.Input
IF Rooms <= 0
MsgBox.Show("Input must be a positive integer not equal to zero.")
MsgBox.Hide
GOTO g2
ELSE
IF Rooms = Math.Multiply(Rooms, 1)
IF Rooms = Math.Round(Rooms, 0)
:g7
MsgBox.Show("Please Input Number of Doctors:T")
MsgBox.Hide
SET Doctors = MsgBox.Input
IF Doctors <= 0
MsgBox.Show("Input must be a positive integer not equal to zero.")
MsgBox.Hide
GOTO g7
ELSE
IF Doctors = Math.Multiply(Doctors, 1)
IF Doctors = Math.Round(Doctors, 0)
IF Doctors > Rooms
MsgBox.Show("Number of Doctors greater than number of rooms." & "Q" & "ok" & "Q" & "Re-input number of Doctors")
MsgBox.Hide
IF MsgBox.SelectedNumber = 0
:g14
MsgBox.Show("Please Input Number of Nurses:T")
MsgBox.Hide
SET Nurses = MsgBox.Input
IF Nurses <= 0
MsgBox.Show("Input must be a positive integer not equal to zero.")
MsgBox.Hide
GOTO g14
ELSE
IF Nurses = Math.Multiply(Nurses, 1)
IF Nurses = Math.Round(Nurses, 0)
IF Nurses > Rooms
MsgBox.Show("Number of Nurses greater than number of rooms." & "Q" & "ok" & "Q" & "Re-input number of
Nurses")
MsgBox.Hide
IF MsgBox.SelectedNumber = 0
:g21
MsgBox.Show("Please Input Treatment Time in Minutes¶Note: please include doctor and patient travel time
to room.T")
MsgBox.Hide
SET Treatment_Time = MsgBox.Input
IF Treatment_Time <= 0
MsgBox.Show("Input must be a positive integer not equal to zero.")
MsgBox.Hide
GOTO g21
ELSE
IF Treatment_Time = Math.Multiply(Treatment_Time, 1)
IF Treatment_Time = Math.Round(Treatment_Time, 0)
IF Treatment_Time > 300
MsgBox.Show("Treatment time cannot be more than 300 minutes.")
MsgBox.Hide
GOTO g21
ELSE
IF Treatment_Time > 120
MsgBox.Show("Treatment Time is more than 2 hours." & "Q" & "Ok" & "Q" & "Re-input
Treatment Time")
MsgBox.Hide
IF MsgBox.SelectedNumber = 0
:g30
MsgBox.Show("Please Input Room Preparation Time in Minutes¶Note: please include
Nurse travel time to room.T")
MsgBox.Hide
SET Room_Prep_Time = MsgBox.Input
IF Room_Prep_Time <= 0
MsgBox.Show("Input must be a positive integer not equal to zero.")
MsgBox.Hide
GOTO g30
ELSE
IF Room_Prep_Time = Math.Multiply(Room_Prep_Time, 1)
IF Room_Prep_Time = Math.Round(Room_Prep_Time, 0)
IF Room_Prep_Time > 300
MsgBox.Show("Room Preparation cannot be more than 300
minutes.")
MsgBox.Hide
GOTO g30
ELSE
IF Room_Prep_Time > 30
MsgBox.Show("Room Preparation is more than 30 minutes." &
"Q" & "Ok" & "Q" & "Re-input Room Preparation Time")
MsgBox.Hide
IF MsgBox.SelectedNumber = 0
:g39
MsgBox.Show("Please Input Patient Arrivals Per
Hour.¶Note: Patient arrivals will be distributed evenly throughout each hour.¶Note: Simulation runs for a 12 hour day.¶Note: Simulation does not admit
patients whose treatment times will exceed 6 pm.T")
MsgBox.Hide
SET PPH = MsgBox.Input
IF PPH <= 0
MsgBox.Show("Input must be a positive integer not
equal to zero.")
MsgBox.Hide
GOTO g39
ELSE
IF PPH = Math.Multiply(PPH, 1)
IF PPH = Math.Round(PPH, 0)
IF PPH > 600
MsgBox.Show("Patient Arrivals per hour
must be 600 or below.")
MsgBox.Hide
GOTO g39
ELSE
IF PPH > Math.Multiply(Rooms, 2)
MsgBox.Show("Patient arrivals per
hour is more than double the number of rooms" & "Q" & "Ok" & "Q" & "Re-input Patient Arrivals per Hour")
MsgBox.Hide
IF MsgBox.SelectedNumber = 0
:g48
SET Spawn("|this:1").Delay =
Math.Divide(60000, PPH)
SET Spawn("|this:1").Interval =
Math.Divide(60000, PPH)
SET Spawn("|this:1").Count =
Math.Multiply(PPH, 12)
Interface("start").Show(1, 1,
1)
MsgBox.Show("Variable Input
Complete." & "Q" & "Start Simulation" & "Q" & "Re-input Variables")
MsgBox.Hide
IF MsgBox.SelectedNumber = 0
Interface("start").Show(0,
1, 1)
Interface("sim
running").Show(1, 1, 1)
SET Spawn("|this:0").Paused
= 0
SET Spawn("|this:1").Paused
= 0
ELSEIF MsgBox.SelectedNumber =
1
Interface("start").Show(0,
1, 1)
GOTO g2
ENDIF
ELSEIF MsgBox.SelectedNumber = 1
GOTO g39
ENDIF
ELSE
GOTO g48
ENDIF
ENDIF
ELSE
MsgBox.Show("Input must be a positive
integer not equal to zero.")
MsgBox.Hide
GOTO g39
ENDIF
ELSE
MsgBox.Show("Input must be a positive integer
not equal to zero.")
MsgBox.Hide
GOTO g39
ENDIF
ENDIF
ELSEIF MsgBox.SelectedNumber = 1
GOTO g30
ENDIF
ELSE
GOTO g39
ENDIF
ENDIF
ELSE
MsgBox.Show("Input must be a positive integer not equal to zero.")
MsgBox.Hide
GOTO g30
ENDIF
ELSE
MsgBox.Show("Input must be a positive integer not equal to zero.")
MsgBox.Hide
GOTO g30
ENDIF
ENDIF
ELSEIF MsgBox.SelectedNumber = 1
GOTO g21
ENDIF
ELSE
GOTO g30
ENDIF
ENDIF
ELSE
MsgBox.Show("Input must be a positive integer not equal to zero.")
MsgBox.Hide
GOTO g21
ENDIF
ELSE
MsgBox.Show("Input must be a positive integer not equal to zero.")
MsgBox.Hide
GOTO g21
ENDIF
ENDIF
ELSEIF MsgBox.SelectedNumber = 1
GOTO g14
ENDIF
ELSE
GOTO g21
ENDIF
ELSE
MsgBox.Show("Input must be a positive integer not equal to zero.")
MsgBox.Hide
GOTO g14
ENDIF
ELSE
MsgBox.Show("Input must be a positive integer not equal to zero.")
MsgBox.Hide
GOTO g14
ENDIF
ENDIF
ELSEIF MsgBox.SelectedNumber = 1
GOTO g7
ENDIF
ELSE
IF Doctors < Rooms
MsgBox.Show("Number of Doctors less than number of rooms." & "Q" & "ok" & "Q" & "Re-input number of Doctors")
MsgBox.Hide
IF MsgBox.SelectedNumber = 0
GOTO g14
ELSEIF MsgBox.SelectedNumber = 1
GOTO g7
ENDIF
ELSE
GOTO g14
ENDIF
ENDIF
ELSE
MsgBox.Show("Input must be a positive integer not equal to zero.")
MsgBox.Hide
GOTO g7
ENDIF
ELSE
MsgBox.Show("Input must be a positive integer not equal to zero.")
MsgBox.Hide
GOTO g7
ENDIF
ENDIF
ELSE
MsgBox.Show("Input must be a positive integer not equal to zero.")
MsgBox.Hide
GOTO g2
ENDIF
ELSE
MsgBox.Show("Input must be a positive integer not equal to zero.")
MsgBox.Hide
GOTO g2
ENDIF
ENDIF
 Textual code of Timerticks:
IF Nurses > 0
SET Spawn("|this:4").Paused = 0
:g3
IF Patients > 0
SET Spawn("|this:2").Paused = 0
IF Rooms > 0
IF Doctors > 0
SET Spawn("|this:3").Paused = 0
SET Doctors = Doctors - (1)
SET Patients = Patients - (1)
SET Rooms = Rooms - (1)
IF Patients > 0
SET Spawn("|this:2").Paused = 0
:g13
IF Doctors > 0
SET Spawn("|this:3").Paused = 0
:g15
Pause(Math.Multiply(Treatment_Time, 1000))
SET Patients_Passed = Patients_Passed + (1)
SET Doctors = Doctors + (1)
IF Doctors > 0
SET Spawn("|this:3").Paused = 0
:g20
IF Nurses > 0
SET Spawn("|this:4").Paused = 0
SET Nurses = Nurses - (1)
IF Nurses > 0
SET Spawn("|this:4").Paused = 0
:g25
Pause(Math.Multiply(Room_Prep_Time, 1000))
SET Rooms = Rooms + (1)
SET Nurses = Nurses + (1)
IF Nurses > 0
SET Spawn("|this:4").Paused = 0
ELSE
SET Spawn("|this:4").Paused = 1
ENDIF
ELSE
SET Spawn("|this:4").Paused = 1
GOTO g25
ENDIF
ELSE
SET Spawn("|this:4").Paused = 1
Pause(100)
GOTO g20
ENDIF
ELSE
SET Spawn("|this:3").Paused = 1
GOTO g20
ENDIF
ELSE
SET Spawn("|this:3").Paused = 1
GOTO g15
ENDIF
ELSE
SET Spawn("|this:2").Paused = 1
GOTO g13
ENDIF
ELSE
SET Spawn("|this:3").Paused = 1
ENDIF
ELSE
:g38
IF Doctors > 0
SET Spawn("|this:3").Paused = 0
ELSE
SET Spawn("|this:3").Paused = 1
ENDIF
ENDIF
ELSE
SET Spawn("|this:2").Paused = 1
GOTO g38
ENDIF
ELSE
SET Spawn("|this:4").Paused = 1
GOTO g3
ENDIF
Interface designandidle/waittimercodeswere omitted.

More Related Content

Similar to Interdisciplinary design Simulation section

Analytics in Healthcare - Using queuing theory to improve patient flow
Analytics in Healthcare - Using queuing theory to improve patient flowAnalytics in Healthcare - Using queuing theory to improve patient flow
Analytics in Healthcare - Using queuing theory to improve patient flow
Sawad thotathil
 
O PTIMISATION B ASED ON S IMULATION : A P ATIENT A DMISSION S CHEDULING ...
O PTIMISATION  B ASED ON  S IMULATION : A P ATIENT  A DMISSION  S CHEDULING  ...O PTIMISATION  B ASED ON  S IMULATION : A P ATIENT  A DMISSION  S CHEDULING  ...
O PTIMISATION B ASED ON S IMULATION : A P ATIENT A DMISSION S CHEDULING ...
IJCI JOURNAL
 
Six Sigma Presentation
Six Sigma PresentationSix Sigma Presentation
Six Sigma Presentation
Hatem Osama
 
Buad 311 west_coast_case_analysis
Buad 311 west_coast_case_analysisBuad 311 west_coast_case_analysis
Buad 311 west_coast_case_analysis
twoniga1990
 
Project Report_Waiting time ER
Project Report_Waiting time ERProject Report_Waiting time ER
Project Report_Waiting time ER
Alireza Ahmadi
 

Similar to Interdisciplinary design Simulation section (20)

Analytics in Healthcare - Using queuing theory to improve patient flow
Analytics in Healthcare - Using queuing theory to improve patient flowAnalytics in Healthcare - Using queuing theory to improve patient flow
Analytics in Healthcare - Using queuing theory to improve patient flow
 
O PTIMISATION B ASED ON S IMULATION : A P ATIENT A DMISSION S CHEDULING ...
O PTIMISATION  B ASED ON  S IMULATION : A P ATIENT  A DMISSION  S CHEDULING  ...O PTIMISATION  B ASED ON  S IMULATION : A P ATIENT  A DMISSION  S CHEDULING  ...
O PTIMISATION B ASED ON S IMULATION : A P ATIENT A DMISSION S CHEDULING ...
 
SHS_ASQ 2010 Conference: Poster The Use of Simulation for Surgical Expansion ...
SHS_ASQ 2010 Conference: Poster The Use of Simulation for Surgical Expansion ...SHS_ASQ 2010 Conference: Poster The Use of Simulation for Surgical Expansion ...
SHS_ASQ 2010 Conference: Poster The Use of Simulation for Surgical Expansion ...
 
Final Report
Final ReportFinal Report
Final Report
 
dutyroaster.pptx
dutyroaster.pptxdutyroaster.pptx
dutyroaster.pptx
 
Contingency Tables
Contingency TablesContingency Tables
Contingency Tables
 
Six Sigma Presentation
Six Sigma PresentationSix Sigma Presentation
Six Sigma Presentation
 
Surgical scheduling rasha tarawneh
Surgical scheduling  rasha tarawnehSurgical scheduling  rasha tarawneh
Surgical scheduling rasha tarawneh
 
operation research at medical emergency at AIIMS
operation research at medical emergency at AIIMSoperation research at medical emergency at AIIMS
operation research at medical emergency at AIIMS
 
Hospital Statistics
Hospital StatisticsHospital Statistics
Hospital Statistics
 
Hospitalstatistics 170916093605
Hospitalstatistics 170916093605Hospitalstatistics 170916093605
Hospitalstatistics 170916093605
 
Contingency tables
Contingency tables  Contingency tables
Contingency tables
 
Hysterectomy Data Analysis & Surgery Cost Prediction
Hysterectomy Data Analysis & Surgery Cost PredictionHysterectomy Data Analysis & Surgery Cost Prediction
Hysterectomy Data Analysis & Surgery Cost Prediction
 
A parallel patient treatment time prediction algorithm and its applications i...
A parallel patient treatment time prediction algorithm and its applications i...A parallel patient treatment time prediction algorithm and its applications i...
A parallel patient treatment time prediction algorithm and its applications i...
 
SHS_ASQ 2010 Conference Poster
SHS_ASQ 2010 Conference PosterSHS_ASQ 2010 Conference Poster
SHS_ASQ 2010 Conference Poster
 
STAFFING AND SCHEDULING for NURSES
STAFFING AND SCHEDULING for NURSESSTAFFING AND SCHEDULING for NURSES
STAFFING AND SCHEDULING for NURSES
 
Buad 311 west_coast_case_analysis
Buad 311 west_coast_case_analysisBuad 311 west_coast_case_analysis
Buad 311 west_coast_case_analysis
 
Flow queue analysis co4.pptx business process management
Flow  queue analysis co4.pptx business process managementFlow  queue analysis co4.pptx business process management
Flow queue analysis co4.pptx business process management
 
MA610 Presentation
MA610 PresentationMA610 Presentation
MA610 Presentation
 
Project Report_Waiting time ER
Project Report_Waiting time ERProject Report_Waiting time ER
Project Report_Waiting time ER
 

Interdisciplinary design Simulation section

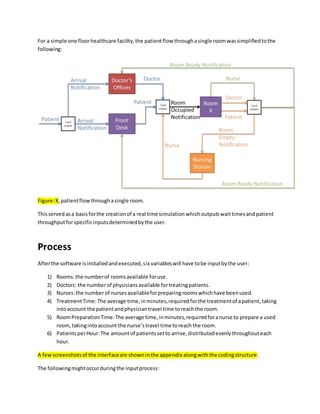
  • 1. For a simple one floorhealthcare facility,the patientflow throughasingle roomwassimplifiedtothe following: Figure:X,patientflowthroughasingle room. Thisservedasa basisforthe creationof a real time simulation whichoutputswaittimesand patient throughputforspecificinputsdeterminedbythe user. Process Afterthe software isinstalledandexecuted,six variableswill have tobe inputbythe user: 1) Rooms:the numberof roomsavailable foruse. 2) Doctors: the numberof physiciansavailable fortreatingpatients. 3) Nurses:the numberof nursesavailableforpreparingroomswhichhave beenused. 4) TreatmentTime:The average time,inminutes,required forthe treatmentof apatient,taking intoaccount the patientandphysiciantravel time toreachthe room. 5) RoomPreparationTime:The average time,inminutes,requiredforanurse to prepare a used room,takingintoaccount the nurse’stravel time toreach the room. 6) PatientsperHour:The amountof patientssetto arrive,distributedevenlythroughouteach hour. A fewscreenshotsof the interfaceare showninthe appendix alongwiththe codingstructure. The followingmightoccurduringthe inputprocess:
  • 2. 1) If a non-integeris enteredatanypoint,the userwill be notified andmustre-inputaninteger value. 2) If the numberof doctorsis greateror lessthanthe numberof rooms,the userwill be notified. 3) If the numberof nursesisgreaterthan the numberof rooms,the userwill be notified. 4) If the treatmenttime inputismore than300 minutes,the userwill be notifiedand mustre-input a value lessthan300. 5) If treatmenttime ismore than 2 hours,the userwill be notified. 6) If the roompreparationtime inputismore than300 minutes,the userwillbe notifiedand must re-inputavalue lessthan300 7) If the roompreparationtime ismore than30 minutes,the userwillbe notified. 8) If the patientflowperhourismore than 600, the userwill be notifiedandmustre-inputavalue lessthan600. 9) Duringthe inputof patientflowper Hour,the userisnotifiedthatpatientsare distributed evenlythroughouteachhour. Itisalsoshownthat the simulationrunsfora 12 hourday, and that patientswhose treatmenttime will exceed6pm will notbe admitted. 10) A recapof all inputsisshown, withthe optionof re-inputtingall variables orstartingthe simulation. Whenthe “Start Simulation”optionischosen,atimerstartstickingwhere one minute of simulation time isequivalenttoone real-life hour.Since patientflow isdistributedevenlythroughoutthe hour,if a flowof six patientsperhourischosen,the firstpatientwill arrive atthe 10th minute of simulationtime (10 secondsreal-time),andevery10minutesafter that.If the patient’streatmenttime will exceedthe 12 hour mark (12th minute real-time),he will notbe admittedandthe flow stops. A full roomusage cycle can be illustratedbylookingatfigure X above.If a patientarrivesandbotha doctor and a roomare available the treatmentbegins. Afterthe treatmenttime iscomplete,the patient leavesthe systemandthe doctorisready to take ina new patient.A nurse wouldthenprepare the room inorderto make it available forfurtheruse.Afterthe roompreparationtime iscomplete,the room isreadyto handle a newpatient. To explainthis full roomusage cycle insimulation terms,considerthe defaultvalue of “patientswaiting” inthe interface iszero.Everytime apatientarrives,thisvalue isincreasedby“1”.The defaultvaluesof “Doctors Idle”and“Rooms Available”are the inputsgivenbythe user.Every6 secondsof simulation time (0.1 secondsreal-time) the simulationchecksif the three aforementionedvariablesare greater than zero.If theyare,theyare all decreasedby one. Afterthe value of “treatmenttime”insimulation minuteshaspassed,the value of “patientspassed”and“DoctorsIdle”inthe interface increasesbyone. If the value of “NursesIdle”ismore thanzero,it will thendecreasebyone.Afterthe value of “room preparationtime”insimulationminuteshaspassed,the value of “Roomsavailable” and“NursesIdle” increasesbyone.
  • 3. Restrictions Due to time and codingskill constraints,a numberof restrictionsare inherenttothe simulation.If these restrictions were tobe removed,the abilitytogainmore meaningful andinsightfuldatawill increase. Possible improvementsonthe simulationinclude: - The abilitytoinputpreciselywheneachpatientarrives,or tochange arrivalsinto some set distribution(e.g. Poisson/normaldistribution). - The abilitytopause and change a variable while the simulationisrunning,suchasaddinga doctor,changingtreatmenttime oraddinga suddenpatientinflux atsome pointduringthe work day. - Allowingthe simulationtorunfor a variable setof time insteadof a12 hour workday (12 minutesreal-time). - Automaticgraphingandplotoutputs,tobe writtenintospreadsheetsoftware suchasMicrosoft Excel. - The optionto obtaininstantgraphoutputsinsteadof havingtowaitfor the simulation tofinish runninginreal time,or at leastthe decrease of the ratioof real-timetosimulation-timesothat it completes inlessthan12 minutes. - More variable inputs (suchastool availability,roomusage time),andstandarddeviationfactors for howlongtreatment androom preparationtimeslast. - Changingthe code so that time valuesare more accurate than approximate. - The abilityformore than one nurse to workon the same room, in orderto decrease room preparationtime. - Individualizedinsteadof cumulative idle andwaittimes;one foreachdoctor,patient,nurse and room. These are some of manypossible improvementsthatcanbe implementedtothe real-timesimulation tool. Optimization Example To showhowthe tool can be usedto optimize a system, itisto be appliedona fictional facilitywhich contains fouravailable treatmentrooms.  For the firstrun, the followinginputswereset: Table Y: first run input values Rooms Doctors Nurses Treatment Time (min) Room Prep Time (min) Patients per Hour 4 3 2 30 10 8
  • 4. The simulationwasrunfor 4 hours (4 minutesreal-time) while manuallytakingdatavaluesbypausing every5th of an hour(12 secondsreal-time).Thisdataisshownin table Z inthe appendix,andwasused to create the two plots shownbelow. Figure 1: firstrun variable status Figure 2: firstrun cumulative idletimes As can be seenfromthe figuresthe numberof available doctorsandroomsdecreasesovertime tozero and remainsthere,while the cumulativedoctoridle time remainsata setconstantof about31 minutes. Thisshowsthat all roomsand doctors are occupiedthroughoutmostof the 4 hours.
  • 5. The amount of patientswaitingandcumulativepatientwaittime howeverare onan increase throughoutmostof the 4 hours. There is no reasontocontinue the full runof the simulationasitis apparentthat the currentinputscannothandle a flow of 8 patientsperhour. In addition,there isatleastone nurse waitingthroughoutthe 4hours,while the cumulative nurse idle time ison the rise.Thisindicatesthe systemhasmore nursesthanrequiredtoprepare the 4 roomsfor thissetof inputs. Thisrun succeededinpassing20 patients,with8waitingtheirturnbythe 4th hour.  In an attemptto maximize patientthroughput,the followinginputswere usedforthe second run: Table V: second run input values Rooms Doctors Nurses Treatment Time (min) Room Prep Time (min) Patients per Hour 4 3 1 25 10 8 The simulationwasonce againrun for4 real-time minutes,while manuallytakingdataevery12 seconds. Thisdata is shownin table B inthe appendix. For thisrun,it was assumed5 minuteswere takenoff eachtreatmenttimeaverage inanattemptto pass more patients.The numberof nurseswasalsodecreasedto1 inlightof the lastrun’sinformation. Usingthe data intable B to plotthe same graphs yieldsthe followingfigures: Figure 3 secondrun variable status
  • 6. Figure 4: secondrun cumulative idle times As can be seenfromthe figures,the amountof available roomsdecreasestozeroandremainsthere. However,the numberof idle doctorsreaches1multiple timesthroughoutthe 4 hours,indicatingthat1 nurse wasnot enoughto prepare all 4 roomsin time forthissetof inputs.Thiscan be observedin figure 4, as the doctoridle time isrisingwhile the nurse idle timeflatlines. Thisrun succeededinpassing21 patients,with7waitingtheirturnbythe 4th hour.  In lightof the secondrun,the numberof nursesavailablewasincreasedbackto2 in orderto deal withthe decreasedtreatmenttime. Table K summarizesthe inputsusedinthe thirdrun: Table K: third run input values Rooms Doctors Nurses Treatment Time (min) Room Prep Time (min) Patients per Hour 4 3 2 25 10 8 Data was collectedinthe same methodasforthe firstand secondruns,and yieldedthe datashownin table Q inthe appendix.The graphsacquiredfromthistable are shownbelow: 0 50 100 150 200 250 0 0.2 0.4 0.6 0.8 1 1.2 1.4 1.6 1.8 2 2.2 2.4 2.6 2.8 3 3.2 3.4 3.6 3.8 4 Time(min) Time Elapsed (Hour) Cumulative Patient Wait Time Cumulative Doctor Idle Time Cumulative Nurse Idle Time
  • 7. Figure 5: thirdrun variable status Figure 6: thirdrun cumulative idletimes As can be deducedfrom figure 5,the numberof rooms and doctorsavailable decreasedtozeroand remainedthere forthe mostpart.The amountof nursesidle remainedatone while the amountof patientswaitingwas rising. Eventhoughthe cumulative idle timesplotissimilartothe firstrun,decreasingthe treatmenttime by5 minutesallowedfor24 patientstobe passedinsteadof 20, withonly4 awaitingtreatmentinsteadof 8, by the 4th hour.  For the fourthrun, the amountof doctorswas increasedby1 to testfor a possible increase in patientthroughput.The follow table summarizesvariable inputsusedinthe fourthrun:
  • 8. Table W: fourth run input values Rooms Doctors Nurses Treatment Time (min) Room Prep Time (min) Patients per Hour 4 4 2 25 10 8 The simulationwasruninthe same manneras before,andthe followinggraphswere createdbasedon table H inthe appendix: Figure 7 fourthrun variable status Figure 8 fourthrun cumulative idletimes
  • 9. The fourthrun’s patientoutputwasidentical tothe thirdrun,butit had at least1 idle doctor throughoutthe 4 hours,withthe cumulative doctoridle timeonaconstant rise.Thisindicatesthatthe 4th physicianisnotneededforthissetof inputs,anddoesnothingtoaffectpatientoutput. So far,the simulationhasshownthatforthissetof inputs,the facility isnotable to handle 8patients perhour withoutthe costlyadditionof aroom or a furtherdecrease intreatmenttime,bothof which can be impractical.  For the fifthsimulationrun,the numberof doctorswasbroughtback to 3, and the simulation was runto test the facility’sabilitytohandle 7patientsperhourinsteadof 8. The followingset of data wasused: Table L: fifth run input values Rooms Doctors Nurses Treatment Time (min) Room Prep Time (min) Patients per Hour 4 3 2 25 10 7 Thistime,as nosignificantbackupof patientflow wasobserved,the simulationwasallowedtorunfor the full 12 hours(12 minutesreal-time),while takingvaluesat12 secondintervals.The valuesobtained are shownin table J in the appendix.Thisdatawasusedto obtainthe followingfigures: Figure 9 fifthrunvariable status
  • 10. Figure 10 fifthruncumulative idle times By observingfigure 9above,itcan be seenthe amountof doctors and roomsdecreasedtozeroand remainedthere forthe mostpart throughoutthe simulation. The maximumamountof patientsawaiting treatmentat anygiventime was2. Eventhoughthe cumulative patientwaittime increasesto501 minutes,all patientswere effectively passedthroughthe system.Itisworth notingthatthe simulationstoppedthe patientin-flow half way throughthe final hour(as theirtreatmenttime wouldexceedthe 12th hour).Bythe 12th hour,79 patientshave beenpassedwiththe final 2undertreatment.2of the 3 doctors are treatingthe final patients,while1nurse iscleaninga room. Thiscomesout to 3 outof the 4 roomsare beingoccupied at the endof the shift.  A sixthsimulationrunwasconductedtotesthow the facilityhandles6patientsperhourwith the same inputs.The followinginitial datawasused:  Table N: sixth run input values Rooms Doctors Nurses Treatment Time (min) Room Prep Time (min) Patients per Hour 4 3 2 25 10 6
  • 11. Thisrun was alsoconductedforthe full 12 hours,and the resultsare shownin table E inthe appendix. These resultswere usedtoplotthe graphsshownbelow: Figure 11 sixthrunvariable status Figure 12 fifthruncumulative idle times As can be observedfrom figure 11,the amountof available roomsandidle doctorsbothcycledbetween zeroand one,while the amountof idle nursesremainedatone throughoutmostof the simulation. However,the numberof patientsawaitingtreatmentremainedatzerothroughthe whole duration. 0 1 2 3 4 0 0.8 1.6 2.4 3.2 4 4.8 5.6 6.4 7.2 8 8.8 9.6 10.4 11.2 12 Elapsed Time (Hours) Rooms Available Doctors Idle Nurses Idle Patients Waiting 0 100 200 300 400 500 600 700 800 0 0.4 0.8 1.4 1.8 2.2 2.6 3 3.4 3.8 4.2 4.6 5 5.4 5.8 6.2 6.6 7 7.4 7.8 8.2 8.6 9 9.4 9.8 10.2 10.6 11 11.4 11.8 Time(min) Cumulative Patient Wait Time Cumulative Doctor Idle Time Cumulative Nurse Idle Time
  • 12. Both the doctor andnurse idle time isonthe increase,while the patientwaitingtime isnon-existent. At the 12th hour, all 69 patientshave beenpassed,andonly1roomwas occupiedbya nurse. It isworth notingthat the simulationonce againstoppedadmittingpatientshalf waythroughthe final hourdue to theirtreatmenttime exceedingthe 12th hour. The sixthrun indicatesthatthisfacilityisalmostperfectlyoptimizedforhandlingaflow of 6 patientsper hour,for thissetof inputs.The patientthroughputismaximizedandpatientwaittime isminimized. A final setof runswere conductedforthe full 12 hours,to testfor extranursesorphysicians.  The seventh runinputstestedfor1 lessdoctorand 1 lessnurse: Table G: seventh run input values Rooms Doctors Nurses Treatment Time (min) Room Prep Time (min) Patients per Hour 4 2 1 25 10 6 55 patientswere passed,with12still awaitingtreatment.  The eighthrun inputstestedforonly1lessdoctor: Table S: seventh run input values Rooms Doctors Nurses Treatment Time (min) Room Prep Time (min) Patients per Hour 4 2 2 25 10 6 55 patientswere passed,with12still awaitingtreatment.  The ninthand final runinputstestedforonly1 lessnurse: Table U: seventh run input values Rooms Doctors Nurses Treatment Time (min) Room Prep Time (min) Patients per Hour 4 3 1 25 10 6 As withthe sixthrun,all 69 patientswere passed.However,the cumulative nurse idle timedecreased from717 minutes(almostthe full 12hourduration) downto41 minutes, while the cumulative patient waittime increasedfromzeroto only 7 minutes. 2roomswere occupiedby2 nursesat the endof the shift. Thisfinal iterationprovidesaperfectsetof conditionsforthe fictionalfacilityinquestion.
  • 13. Appendix The 4 interface graphsshouldbe here,startingwiththe one Isentthroughemail and continuinginthe presentation’sorder Data Tablesfor the optimizationruns,Idle andwaittimesare in“minutes”: Table Z: first simulation run data output Rooms Available Doctors Idle Nurses Idle Patients Waiting Patients Passed Cumulative Patient Wait Time Cumulative Doctor Idle Time Cumulative Nurse Idle Time Time Passed (Hours) 4 3 2 0 0 0 0 0 0 3 2 2 0 0 0 10 10 0.2 2 1 2 0 0 0 20 20 0.4 1 0 2 1 0 3 23 33 0.6 0 0 1 1 1 15 23 45 0.8 0 0 1 1 3 27 28 52 1 0 0 1 2 4 40 28 65 1.2 0 0 1 2 5 51 28 76 1.4 0 0 1 3 6 63 31 85 1.6 0 0 1 3 7 75 31 97 1.8 0 0 1 4 8 87 31 109 2 0 0 1 4 10 99 31 121 2.2 0 0 1 4 11 111 31 133 2.4 0 0 1 5 12 123 31 145 2.6 0 0 1 5 13 135 31 157 2.8 0 0 1 6 14 147 31 169 3 0 0 1 6 16 159 31 181 3.2 0 0 1 6 17 171 31 193 3.4 0 0 1 7 18 183 31 205 3.6 0 0 1 7 19 195 31 217 3.8 0 0 1 8 20 207 31 229 4 Table B: second simulation run data output Rooms Available Doctors Idle Nurses Idle Patients Waiting Patients Passed Cumulative Patient Wait Time Cumulative Doctor Idle Time Cumulative Nurse Idle Time Time Passed (Hours) 4 3 1 0 0 0 0 0 0 3 2 1 0 0 0 9 9 0.2
  • 14. 2 1 1 0 0 0 21 21 0.4 0 0 0 0 1 3 23 33 0.6 0 0 0 0 2 8 25 33 0.8 0 0 0 1 3 19 30 33 1 0 1 0 2 5 31 37 33 1.2 0 1 0 2 6 43 44 33 1.4 0 1 0 3 7 55 51 33 1.6 0 0 0 2 8 67 57 33 1.8 0 0 0 3 9 79 62 33 2 0 0 1 4 11 92 68 33 2.2 0 0 1 4 12 103 75 33 2.4 0 1 0 5 13 115 82 34 2.6 0 0 0 4 14 127 88 34 2.8 0 0 0 5 15 140 94 34 3 0 0 0 6 16 151 99 34 3.2 0 1 0 6 18 163 106 34 3.4 0 1 0 7 19 176 113 34 3.6 0 0 0 6 20 187 120 34 3.8 0 0 0 7 21 199 125 34 4 Table Q: third simulation run data output Rooms Available Doctors Idle Nurses Idle Patients Waiting Patients Passed Cumulative Patient Wait Time Cumulative Doctor Idle Time Cumulative Nurse Idle Time Time Passed (Hours) 4 3 2 0 0 0 0 0 0 3 2 2 0 0 0 9 9 0.2 2 1 2 0 0 0 21 21 0.4 0 0 1 0 1 3 23 33 0.6 0 0 1 0 2 8 25 42 0.8 0 0 1 1 3 17 28 52 1 0 0 1 1 5 27 28 64 1.2 0 0 1 1 6 39 31 73 1.4 0 0 1 2 7 51 33 83 1.6 0 0 1 1 9 63 33 95 1.8 0 0 1 2 10 75 36 104 2 0 0 1 2 12 87 38 114 2.2 0 0 1 2 13 99 38 126 2.4 0 0 1 3 14 111 41 135 2.6 0 0 1 2 16 123 43 145 2.8 0 0 1 3 17 135 44 157 3 0 1 0 4 19 147 47 166 3.2
  • 15. 0 0 1 3 20 159 49 176 3.4 0 0 1 4 21 171 49 188 3.6 0 1 0 4 23 183 53 196 3.8 0 0 1 4 24 195 54 207 4 Table H: fourth simulation run data output Rooms Available Doctors Idle Nurses Idle Patients Waiting Patients Passed Cumulative Patient Wait Time Cumulative Doctor Idle Time Cumulative Nurse Idle Time Time Passed (Hours) 4 4 2 0 0 0 0 0 0 3 3 2 0 0 0 9 9 0.2 2 2 2 0 0 0 21 21 0.4 0 1 1 0 1 0 30 33 0.6 0 1 1 0 2 5 42 42 0.8 0 2 0 1 4 14 54 50 1 0 1 1 1 5 22 64 61 1.2 0 1 1 1 6 33 76 71 1.4 0 1 1 1 8 46 88 78 1.6 0 1 1 1 9 58 97 90 1.8 0 1 1 2 10 69 109 99 2 0 1 1 2 12 81 121 106 2.2 0 1 1 2 13 94 131 118 2.4 0 1 1 3 14 105 143 128 2.6 0 1 1 2 16 118 155 135 2.8 0 1 1 3 17 130 165 147 3 0 2 0 4 19 142 176 155 3.2 0 1 1 3 20 154 188 163 3.4 0 1 1 4 21 166 198 175 3.6 0 2 0 4 23 177 210 183 3.8 0 1 1 4 24 190 222 192 4 Table J: fifth simulation run data output Rooms Available Doctors Idle Nurses Idle Patients Waiting Patients Passed Cumulative Patient Wait Time Cumulative Doctor Idle Time Cumulative Nurse Idle Time Time Passed (Hours) 4 3 2 0 0 0 0 0 0 3 2 2 0 0 0 9 9 0.2 2 1 2 0 0 0 21 21 0.4 1 0 2 0 0 0 26 33 0.6
  • 16. 0 0 1 0 2 1 28 44 0.8 0 0 1 0 3 2 29 54 1 0 1 0 1 5 3 31 64 1.2 0 0 1 0 6 5 33 75 1.4 0 0 1 0 7 6 35 85 1.6 0 0 1 0 9 10 37 95 1.8 0 0 1 0 10 12 38 106 2 0 0 1 1 11 15 40 116 2.2 0 0 1 0 13 19 42 126 2.4 0 0 1 0 14 22 44 137 2.6 0 1 0 1 16 27 45 147 2.8 0 0 1 0 17 32 47 157 3 0 0 1 1 18 36 49 168 3.2 0 1 0 1 20 44 52 177 3.4 0 0 1 0 21 48 52 188 3.6 0 0 1 1 22 55 54 199 3.8 0 0 1 0 24 62 57 208 4 0 0 1 1 25 67 58 219 4.2 0 0 1 1 26 76 59 230 4.4 0 0 1 0 28 84 62 239 4.6 0 0 1 1 29 91 63 250 4.8 0 1 0 1 31 101 65 260 5 0 0 1 1 32 109 68 270 5.2 0 0 1 1 33 119 68 281 5.4 0 0 1 0 35 129 71 291 5.6 0 0 1 1 36 139 73 301 5.8 0 0 1 1 37 149 73 313 6 0 0 1 1 39 160 77 322 6.2 0 0 1 1 40 172 78 332 6.4 0 0 1 1 41 183 79 334 6.6 0 0 1 1 43 195 82 353 6.8 0 0 1 1 44 207 83 363 7 0 1 0 2 46 219 85 374 7.2 0 0 1 1 47 231 87 384 7.4 0 0 1 1 48 243 89 394 7.6 0 0 1 1 50 255 91 404 7.8 0 0 1 1 51 267 92 415 8 0 0 1 2 52 279 94 425 8.2 0 0 1 1 54 291 96 435 8.4 0 0 1 1 55 303 97 446 8.6 0 1 0 2 57 316 99 456 8.8 0 0 1 1 58 327 101 466 9 0 0 1 2 59 339 103 477 9.2
  • 17. 0 0 1 1 61 351 105 487 9.4 0 0 1 1 62 363 107 497 9.6 0 0 1 2 63 375 108 508 9.8 0 0 1 1 65 387 110 518 10 0 0 1 2 66 399 112 528 10.2 0 1 0 2 68 411 113 539 10.4 0 0 1 1 69 423 115 549 10.6 0 0 1 2 70 435 117 559 10.8 0 1 0 2 72 447 119 569 11 0 0 1 2 73 459 120 581 11.2 0 0 1 2 74 471 122 590 11.4 0 0 1 1 76 483 125 600 11.6 0 0 1 1 77 495 125 611 11.8 1 1 1 0 79 501 130 623 12 Table E: sixth simulation run data output Rooms Available Doctors Idle Nurses Idle Patients Waiting Patients Passed Cumulative Patient Wait Time Cumulative Doctor Idle Time Cumulative Nurse Idle Time Time Passed (Hours) 4 3 2 0 0 0 0 0 0 4 3 2 0 0 0 9 9 0.2 2 1 2 0 0 0 21 21 0.4 1 0 2 0 0 0 30 33 0.6 1 1 1 0 3 0 42 57 0.8 1 1 1 0 4 0 49 69 1.2 0 0 1 0 5 0 55 81 1.4 0 0 1 0 6 0 60 93 1.6 0 0 1 0 7 0 65 105 1.8 1 1 1 0 9 0 72 117 2 1 1 1 0 10 0 79 129 2.2 0 0 1 0 11 0 85 141 2.4 0 0 1 0 12 0 90 153 2.6 0 0 1 0 13 0 95 165 2.8 1 1 1 0 15 0 102 177 3 1 1 1 0 16 0 109 189 3.2 0 0 1 0 17 0 115 201 3.4 0 0 1 0 18 0 120 231 3.6 0 0 1 0 19 0 125 235 3.8 1 1 1 0 21 0 132 237 4 1 1 1 0 22 0 139 249 4.2 0 0 1 0 23 0 145 261 4.4
  • 18. 0 0 1 0 24 0 150 273 4.6 0 0 1 0 25 0 155 285 4.8 1 1 1 0 27 0 162 297 5 1 1 1 0 28 0 169 310 5.2 0 0 1 0 29 0 175 321 5.4 0 0 1 0 30 0 180 333 5.6 0 0 1 0 31 0 185 345 5.8 1 1 1 0 33 0 192 357 6 0 0 1 0 34 0 200 370 6.2 0 0 1 0 35 0 205 381 6.4 0 0 1 0 36 0 210 393 6.6 0 0 1 0 37 0 215 405 6.8 1 1 1 0 39 0 221 417 7 1 1 1 0 40 0 229 429 7.2 0 0 1 0 41 0 235 441 7.4 0 0 1 0 42 0 240 453 7.6 0 0 1 0 43 0 245 465 7.8 1 1 1 0 45 0 251 477 8 1 1 1 0 46 0 258 488 8.2 0 0 1 0 47 0 265 501 8.4 0 0 1 0 48 0 270 513 8.6 0 0 1 0 49 0 275 524 8.8 1 1 1 0 51 0 281 536 9 1 1 1 0 52 0 289 549 9.2 0 0 1 0 53 0 295 561 9.4 0 0 1 0 54 0 300 573 9.6 0 0 1 0 55 0 305 585 9.8 1 1 1 0 57 0 312 597 10 1 1 1 0 58 0 319 609 10.2 0 0 1 0 59 0 325 621 10.4 0 0 1 0 60 0 330 632 10.6 0 0 1 0 61 0 335 644 10.8 1 1 1 0 63 0 341 656 11 1 1 1 0 64 0 348 668 11.2 0 0 1 0 65 0 355 680 11.4 0 0 1 0 66 0 360 692 11.6 1 1 1 0 67 0 369 704 11.8 3 3 1 0 69 0 382 717 12
  • 19. Real time simulationcode: The real time simulationwascreatedusing001 game creator v.1.014.001 http://www.engine001.com  Graphical representationof software initiation(variableinputs): http://www.engine001.com/script/PtyxFE  Graphical representationof Timerticks(every0.1secondsonce simulationstarts): http://www.engine001.com/script/xyp9ZR  Textual code of software initiation(variableinputs): SET Actor("main").NonExistent = 1 :g2 MsgBox.Show("Welcome to the Automated Patient System Simulation.¶Please Input Number of Rooms:T") MsgBox.Hide SET Rooms = MsgBox.Input IF Rooms <= 0 MsgBox.Show("Input must be a positive integer not equal to zero.") MsgBox.Hide GOTO g2 ELSE IF Rooms = Math.Multiply(Rooms, 1) IF Rooms = Math.Round(Rooms, 0) :g7 MsgBox.Show("Please Input Number of Doctors:T") MsgBox.Hide SET Doctors = MsgBox.Input IF Doctors <= 0 MsgBox.Show("Input must be a positive integer not equal to zero.") MsgBox.Hide GOTO g7 ELSE IF Doctors = Math.Multiply(Doctors, 1) IF Doctors = Math.Round(Doctors, 0) IF Doctors > Rooms MsgBox.Show("Number of Doctors greater than number of rooms." & "Q" & "ok" & "Q" & "Re-input number of Doctors") MsgBox.Hide IF MsgBox.SelectedNumber = 0 :g14 MsgBox.Show("Please Input Number of Nurses:T") MsgBox.Hide SET Nurses = MsgBox.Input IF Nurses <= 0 MsgBox.Show("Input must be a positive integer not equal to zero.") MsgBox.Hide GOTO g14 ELSE IF Nurses = Math.Multiply(Nurses, 1) IF Nurses = Math.Round(Nurses, 0) IF Nurses > Rooms MsgBox.Show("Number of Nurses greater than number of rooms." & "Q" & "ok" & "Q" & "Re-input number of Nurses") MsgBox.Hide IF MsgBox.SelectedNumber = 0 :g21 MsgBox.Show("Please Input Treatment Time in Minutes¶Note: please include doctor and patient travel time to room.T") MsgBox.Hide SET Treatment_Time = MsgBox.Input IF Treatment_Time <= 0 MsgBox.Show("Input must be a positive integer not equal to zero.") MsgBox.Hide GOTO g21 ELSE IF Treatment_Time = Math.Multiply(Treatment_Time, 1) IF Treatment_Time = Math.Round(Treatment_Time, 0) IF Treatment_Time > 300 MsgBox.Show("Treatment time cannot be more than 300 minutes.") MsgBox.Hide GOTO g21 ELSE IF Treatment_Time > 120 MsgBox.Show("Treatment Time is more than 2 hours." & "Q" & "Ok" & "Q" & "Re-input Treatment Time") MsgBox.Hide IF MsgBox.SelectedNumber = 0 :g30 MsgBox.Show("Please Input Room Preparation Time in Minutes¶Note: please include Nurse travel time to room.T") MsgBox.Hide SET Room_Prep_Time = MsgBox.Input IF Room_Prep_Time <= 0 MsgBox.Show("Input must be a positive integer not equal to zero.") MsgBox.Hide GOTO g30 ELSE IF Room_Prep_Time = Math.Multiply(Room_Prep_Time, 1) IF Room_Prep_Time = Math.Round(Room_Prep_Time, 0) IF Room_Prep_Time > 300 MsgBox.Show("Room Preparation cannot be more than 300 minutes.") MsgBox.Hide GOTO g30 ELSE IF Room_Prep_Time > 30
  • 20. MsgBox.Show("Room Preparation is more than 30 minutes." & "Q" & "Ok" & "Q" & "Re-input Room Preparation Time") MsgBox.Hide IF MsgBox.SelectedNumber = 0 :g39 MsgBox.Show("Please Input Patient Arrivals Per Hour.¶Note: Patient arrivals will be distributed evenly throughout each hour.¶Note: Simulation runs for a 12 hour day.¶Note: Simulation does not admit patients whose treatment times will exceed 6 pm.T") MsgBox.Hide SET PPH = MsgBox.Input IF PPH <= 0 MsgBox.Show("Input must be a positive integer not equal to zero.") MsgBox.Hide GOTO g39 ELSE IF PPH = Math.Multiply(PPH, 1) IF PPH = Math.Round(PPH, 0) IF PPH > 600 MsgBox.Show("Patient Arrivals per hour must be 600 or below.") MsgBox.Hide GOTO g39 ELSE IF PPH > Math.Multiply(Rooms, 2) MsgBox.Show("Patient arrivals per hour is more than double the number of rooms" & "Q" & "Ok" & "Q" & "Re-input Patient Arrivals per Hour") MsgBox.Hide IF MsgBox.SelectedNumber = 0 :g48 SET Spawn("|this:1").Delay = Math.Divide(60000, PPH) SET Spawn("|this:1").Interval = Math.Divide(60000, PPH) SET Spawn("|this:1").Count = Math.Multiply(PPH, 12) Interface("start").Show(1, 1, 1) MsgBox.Show("Variable Input Complete." & "Q" & "Start Simulation" & "Q" & "Re-input Variables") MsgBox.Hide IF MsgBox.SelectedNumber = 0 Interface("start").Show(0, 1, 1) Interface("sim running").Show(1, 1, 1) SET Spawn("|this:0").Paused = 0 SET Spawn("|this:1").Paused = 0 ELSEIF MsgBox.SelectedNumber = 1 Interface("start").Show(0, 1, 1) GOTO g2 ENDIF ELSEIF MsgBox.SelectedNumber = 1 GOTO g39 ENDIF ELSE GOTO g48 ENDIF ENDIF ELSE MsgBox.Show("Input must be a positive integer not equal to zero.") MsgBox.Hide GOTO g39 ENDIF ELSE MsgBox.Show("Input must be a positive integer not equal to zero.") MsgBox.Hide GOTO g39 ENDIF ENDIF ELSEIF MsgBox.SelectedNumber = 1 GOTO g30 ENDIF ELSE GOTO g39 ENDIF ENDIF ELSE MsgBox.Show("Input must be a positive integer not equal to zero.") MsgBox.Hide GOTO g30 ENDIF ELSE MsgBox.Show("Input must be a positive integer not equal to zero.") MsgBox.Hide GOTO g30 ENDIF ENDIF ELSEIF MsgBox.SelectedNumber = 1 GOTO g21 ENDIF ELSE GOTO g30 ENDIF ENDIF ELSE MsgBox.Show("Input must be a positive integer not equal to zero.") MsgBox.Hide GOTO g21 ENDIF ELSE MsgBox.Show("Input must be a positive integer not equal to zero.") MsgBox.Hide GOTO g21 ENDIF ENDIF ELSEIF MsgBox.SelectedNumber = 1 GOTO g14
  • 21. ENDIF ELSE GOTO g21 ENDIF ELSE MsgBox.Show("Input must be a positive integer not equal to zero.") MsgBox.Hide GOTO g14 ENDIF ELSE MsgBox.Show("Input must be a positive integer not equal to zero.") MsgBox.Hide GOTO g14 ENDIF ENDIF ELSEIF MsgBox.SelectedNumber = 1 GOTO g7 ENDIF ELSE IF Doctors < Rooms MsgBox.Show("Number of Doctors less than number of rooms." & "Q" & "ok" & "Q" & "Re-input number of Doctors") MsgBox.Hide IF MsgBox.SelectedNumber = 0 GOTO g14 ELSEIF MsgBox.SelectedNumber = 1 GOTO g7 ENDIF ELSE GOTO g14 ENDIF ENDIF ELSE MsgBox.Show("Input must be a positive integer not equal to zero.") MsgBox.Hide GOTO g7 ENDIF ELSE MsgBox.Show("Input must be a positive integer not equal to zero.") MsgBox.Hide GOTO g7 ENDIF ENDIF ELSE MsgBox.Show("Input must be a positive integer not equal to zero.") MsgBox.Hide GOTO g2 ENDIF ELSE MsgBox.Show("Input must be a positive integer not equal to zero.") MsgBox.Hide GOTO g2 ENDIF ENDIF  Textual code of Timerticks: IF Nurses > 0 SET Spawn("|this:4").Paused = 0 :g3 IF Patients > 0 SET Spawn("|this:2").Paused = 0 IF Rooms > 0 IF Doctors > 0 SET Spawn("|this:3").Paused = 0 SET Doctors = Doctors - (1) SET Patients = Patients - (1) SET Rooms = Rooms - (1) IF Patients > 0 SET Spawn("|this:2").Paused = 0 :g13 IF Doctors > 0 SET Spawn("|this:3").Paused = 0 :g15 Pause(Math.Multiply(Treatment_Time, 1000)) SET Patients_Passed = Patients_Passed + (1) SET Doctors = Doctors + (1) IF Doctors > 0 SET Spawn("|this:3").Paused = 0 :g20 IF Nurses > 0 SET Spawn("|this:4").Paused = 0 SET Nurses = Nurses - (1) IF Nurses > 0 SET Spawn("|this:4").Paused = 0 :g25 Pause(Math.Multiply(Room_Prep_Time, 1000)) SET Rooms = Rooms + (1) SET Nurses = Nurses + (1) IF Nurses > 0 SET Spawn("|this:4").Paused = 0 ELSE SET Spawn("|this:4").Paused = 1 ENDIF ELSE SET Spawn("|this:4").Paused = 1 GOTO g25 ENDIF ELSE SET Spawn("|this:4").Paused = 1 Pause(100) GOTO g20 ENDIF ELSE SET Spawn("|this:3").Paused = 1 GOTO g20 ENDIF ELSE SET Spawn("|this:3").Paused = 1 GOTO g15 ENDIF ELSE
  • 22. SET Spawn("|this:2").Paused = 1 GOTO g13 ENDIF ELSE SET Spawn("|this:3").Paused = 1 ENDIF ELSE :g38 IF Doctors > 0 SET Spawn("|this:3").Paused = 0 ELSE SET Spawn("|this:3").Paused = 1 ENDIF ENDIF ELSE SET Spawn("|this:2").Paused = 1 GOTO g38 ENDIF ELSE SET Spawn("|this:4").Paused = 1 GOTO g3 ENDIF Interface designandidle/waittimercodeswere omitted.