An ultrahot gas-giant exoplanet with a stratosphere
poster-2014-09-11
1. The Atomic-to-Molecular Hydrogen Transition in Giant
Molecular Clouds
Elijah Bernstein-Cooper1
, Snežana Stanimirović1
, Min-Young Lee2
, Robert Lindner1
, Paul Goldsmith3
, Jouni Kainulainen4
1
University of Wisconsin Madison, USA 2
Commissariat à l’Énergie Atomique et aux Énergies Alternatives, France 3
Jet Propulsion Laboratory, USA
4
Max-Planck Institute for Astronomy, Germany
Abstract
Lee et al. (2012) used H i and infrared data to esti-
mate the H2 distribution across the Perseus molec-
ular cloud at sub-pc resolution, finding a saturation
in the H i surface density, ΣH i, of 6–8 M pc−2
.
The observed saturation agrees with the steady-
state model of H2 formation by Krumholz et al.
(2009) which predicts that a saturation of ΣH i is
required to shield H2 against photodissociation. As
Perseus is a relatively low-mass and quiescent cloud
however, we investigate California and Taurus which
differ in both mass and star formation rates by a fac-
tor of 2–4 relative to Perseus (Lada et al., 2010).
Our conclusions:
1 We use Planck AV and GALFA-H i data to
simultaneously estimate the dust-to-gas ratio
(DGR) and the H i velocity width by modeling
diffuse dust (AV < 1 mag). With AV , N (H i)
and the DGR we estimate the H2 surface density,
ΣH2, and select core regions which trace the
steepest AV gradient. This method can be
applied to other GMCs in a systematic way. We
reproduce the results of Lee et al. (2012) with
this method.
2 The model of Krumholz et al. (2009) fits the
molecular fraction (H2 / H i) as a function of the
total gas density of regions in all three GMCs
reasonably well. However, we find variations in
the saturation ΣH i; Taurus shows a lower ΣH i
saturation. Further investigations of the CNM
temperature using H i absorption spectra will
offer insight to the lower ΣH i saturation.
Data
• N (H i ): Galactic Arecibo L-band Feed Array
(GALFA)-H i survey at 3.8 resolution (Peek et al.,
2011).
• AV : Planck survey color excess with a resolution of
5 (Planck Collaboration et al., 2011). We assume
RV = 3.1 (Weingartner & Draine, 2001).
• N (H2 ): Assume that the dust column, traced by
AV , scales with the gas column such that N (H2) =
1
2
AV
DGR − N (H i) . See Figure 1.
• 12
CO: Data from Dame et al. (2001) with a
resolution of 8 .
Figure 1: Plot of likelihood of DGR and H i integration velocity
width for modeling the diffuse dust column, AV < 1 mag, with H i
in California. The 68% and 95% confidence intervals are shown as
contours. The plots above and to the right represent the marginal
probability density functions, where the dotted line is the mean, the
maximum likelihood estimate, and the shaded region is the 68%
confidence interval. We set the H i velocity center at the 12
CO
peak.
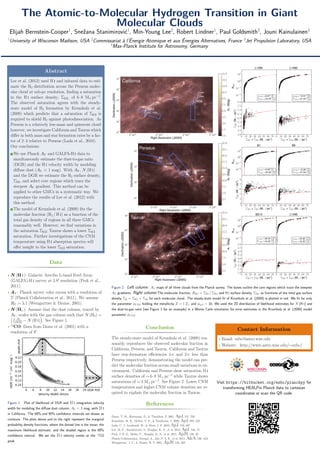
Figure 2: Left column: AV maps of all three clouds from the Planck survey. The boxes outline the core regions which trace the steepest
AV gradients. Right column:The molecular fraction, RH2 = ΣH2 / ΣHi, and H i surface density, ΣHi, as functions of the total gas surface
density ΣH = ΣH2 + ΣHi for each molecular cloud. The steady-state model fit of Krumholz et al. (2009) is plotted in red. We fit for only
the parameter φCNM holding the metallicity Z = 1 Z and φmol = 10. We used the 2D distribution of likelihood estimates for N (H i) and
the dust-to-gas ratio (see Figure 1 for an example) in a Monte Carlo simulation for error estimates in the Krumholz et al. (2009) model
parameter φCNM.
Conclusion
The steady-state model of Krumholz et al. (2009) rea-
sonably reproduces the observed molecular fraction in
California, Perseus, and Taurus. California and Taurus
have star-formation efficiencies 4× and 2× less than
Perseus respectively, demonstrating the model can pre-
dict the molecular fraction across small variations in en-
vironment. California and Perseus show saturation H i
surface densities of ∼ 6–8 M pc−2
while Taurus shows
saturations of ∼ 3 M pc−2
. See Figure 2. Lower CNM
temperatures and higher CNM volume densities are re-
quired to explain the molecular fraction in Taurus.
References
Dame, T. M., Hartmann, D., & Thaddeus, P. 2001, ApJ, 547, 792
Krumholz, M. R., McKee, C. F., & Tumlinson, J. 2009, ApJ, 693, 216
Lada, C. J., Lombardi, M., & Alves, J. F. 2010, ApJ, 724, 687
Lee, M.-Y., Stanimirović, S., Douglas, K. A., et al. 2012, ApJ, 748, 75
Peek, J. E. G., Heiles, C., Douglas, K. A., et al. 2011, ApJS, 194, 20
Planck Collaboration, Abergel, A., Ade, P. A. R., et al. 2011, A&A, 536, A24
Weingartner, J. C., & Draine, B. T. 2001, ApJS, 134, 263
Contact Information
• Email: ezbc@astro.wisc.edu
• Website: http://www.astro.wisc.edu/∼ezbc/
Visit https://bitbucket.org/ezbc/planckpy for
transforming HEALPix Planck data to cartesian
coordinates or scan the QR code.