The relation between_gas_and_dust_in_the_taurus_molecular_cloud
Narrow C+ Emission from Hot Stars Discovered by Herschel
1. A Model for Narrow C+ Emission Discovered By Herschel
J.M. Hughes
Williams College
2014 Summer Student at Space Telescope Science Institute
hughes.jmb@gmail.com
1. Introduction
CII is an important element of the interstellar medium (ISM) because, in theory, it is a major
coolant of the ISM. Readily observed at 158 µm , CII can be observed in nearly every phase of
the ISM, from warm molecular clouds to cool neutral hydrogen. In the past, surveys of CII have
been conducted either using non-pointed or low spectral (i.e. Nakagawa et al. (1998)) resolution
instruments. Using the HIFI instrument (de Graauw et al. 2010) on the Herschel space observatory
(Pilbratt et al. 2010), Pineda et al. (2013) observed with 12” angular resolution, 0.8 km/s spectral
resolution, and 0.1 K average rms noise as part of the Herschel Open Time Key Project Galactic
Observations of Terahertz C+ (GOT C+).
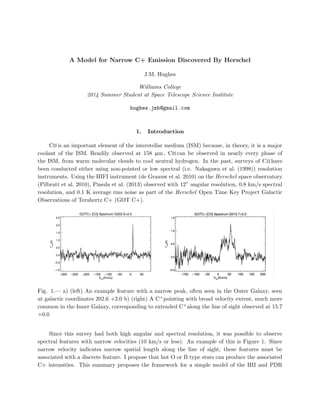
Fig. 1.— a) (left) An example feature with a narrow peak, often seen in the Outer Galaxy, seen
at galactic coordinates 202.6 +2.0 b) (right) A C+pointing with broad velocity extent, much more
common in the Inner Galaxy, corresponding to extended C+along the line of sight observed at 15.7
+0.0
Since this survey had both high angular and spectral resolution, it was possible to observe
spectral features with narrow velocities (10 km/s or less). An example of this is Figure 1. Since
narrow velocity indicates narrow spatial length along the line of sight, these features must be
associated with a discrete feature. I propose that hot O or B type stars can produce the associated
C+ intensities. This summary proposes the framework for a simple model of the HII and PDR
2. – 2 –
regions around OB stars. This paper discusses the Outer Galaxy while there are some isolate
narrow features in the Inner Galaxy.
l b Vel.[km/s] Intensity[K km/s]
87.2 -0.5 +6.3 2.7
109.8 +0.0 -49.7 2.1
109.8 +2.0 -9.8 9.2
150.6 -1.0 -21.4 18.5
202.6 +2.0 +10.4 3.7
207.2 -2.0 +15.1 8.2
261.5 +0.0 +7.5 3.1
265.5 -2.0 +91.8 3.3
Table 1: This comprehensive list of the isolated and bright narrow features in the Outer Galaxy
details the longitude, latitude, maximum line velocity, and the integrated intensity.
2. Model Structure
The region surrounding the OB-type star is layered containing, in this simplification, three
distinct layers: the ionized region consisting of HII , CIII , and CIV ; the atomic region consisting of
HI and C+; and the molecular region consisting of HI , C+, C, and CO.
The inner ionized region is approximated to contain no CII but instead more ionized C (i.e. CIII ,
CIV , ...). The atomic region between the ionization front and the dissociation front is approximated
as only CII and HI . Beyond the dissociation front, the molecular region will predominantly be C,
CO, and H2 . This investigation estimates the C+ emission due to the collision between CII and
HI between the ionization and dissociation fronts.
The inner HII region radius was first studied by Stromgren in 1938. This region contains only
HII except for some HI at the edges close the ionization front.
RS =
3NLY C
4πn2αB
1/3
(1)
NLY C is the number of ionizing photons emitted by the central star. αB ≈ 2.56×10⁻¹³T−0.83
4 cm3s−1
(Draine 2011)
The distance the photodissociation front extends in equilibrium conditions is (Diaz-Miller et
al. 1998):
3. – 3 –
Fig. 2.— The HII and PDR structure associated with a hot O or B type star
RPDR = RS 1 +
< p > ND
NLYC
n2
eαB
f0n2
totαf
1/3
(2)
f0 is the fraction of the PDR region in atomic hydrogen form, f0 =
nH0
nH0 +nH2
. ND is the
number of dissociating photons emitted from the central star. αf is the rate HI forms H2 on dust
grains. According to Diaz-Miller et al. (1998),
αf ∼ 3 × 10⁻¹⁷ T
1/2
2
1 + 0.4T
1/2
2 + 0.2T2 + 0.08T2
2
cm3
s−1
(3)
NLY C and ND come from Diaz-Miller in a private communication similar to Diaz-Miller et al.
(1998).
This allows one to estimate the size of just the CII region as RC = RPDR − RS. Using this
as the approximate radius in the sphere, the column density along a line of sight through the
sphere would be NCII ≈ nCII × RC = [C]/[H] × RCcm−2. In the local ISM, [C]/[H] = 1.4 × 10⁻⁴
(Cardelli et al. 1996). Pineda et al. (2013) extend this as a function of Galactocentric distance as
[C]/[H] = 5.5 × 10−410−0.07/Rgal
4. – 4 –
Fig. 3.— The blue line is the ionizing (greater than 13.6 eV) flux from a zero-age main sequence
star with the given effective temperature. The red line is the dissociating flux (grater than 11.2 eV
but less than 13.6 eV).
The resulting intensity is (Pineda et al. 2013):
ICII = NCII 3.05 × 10¹⁵
1 + 0.5 1 +
Aul
Ruln
e91.21/Tkin
−1
(4)
Since this paper discusses the HI /CII layer, the adopted collision rate is Rul(H0) = 7.6 ×
10−10(Tkin/100)0.14cm3s−1 (Goldsmith et al. 2012). Alternatively collision rates between H2 and
e− are available in Goldsmith et al. (2012) and Wiesenfeld & Goldsmith (2014). This equation
ultimately depends on four parameters: the electron density in the HI /CII layer, the hydrogen
volume density, the temperature in the HI /CII layer, and the spectral type of the input star. The
dissociating and ionizing photon count from zero-age main sequence stars with effective tempratures
from 7500 to 50000 K is taken from Diaz-Miller et al. (1998).
The model discussed above lacks a detailed account of how the CII layer actually corresponds
with the various phases of hydrogen. To confirm that our estimate of the CII thickness corresponds
with the H2 thickness, I looked at Diaz-Miller et al. (1998). Note in Figures 5 how the HI layer
generally aligns with the CII layer confirming that this approximation is at first attempt acceptable.
For more accurate results, we need a more detailed investigation where the structure is plotted
5. – 5 –
Fig. 4.— Using ne = 300 cm−3, the HII temperature of 104 K, the atomic temperature of 103,
the green line represents nH = 103cm−3, the blue line represents nH = 104cm−3, and the red line
represents nH = 105cm−3.
for each density and spectral type.
3. Physical Comparison
Recalling the line intensities presented in the example features at the beginning, it is clear that
even cooler stars can provide this amount of ionization. To test this, we need to show the closeness
of a star. Figure 6 indicates that hot stars are close enough to the C+pointing.
This particular example seen at 150.6, -1.0 is especially convincing. Crampton & Fisher (1974)
show that SH2-206 IRS 1 at 150.6028, -00.9426 is type O6. Using these parameters, we can predict
the C+intensity in 103cm−3 as about 85 K km/s. If we decrease the size of the C+region as
presented in Figure 5 according to dust, we can decrease the prediction to a more reasonable 20
K km/s. (Note the possible error because a change of hydrogen density.) Our prediction is not
unreasonable.
6. – 6 –
Fig. 5.— A) (left)Taken from Diaz-Miller et al. (1998) as representative of an O6V star: ”HII region
and PDR structures, with and without dust, for a star with Teff = 5 × 10⁴ K and a density of
105cm−3 The ionization structures of each element H, He, C, O, and N are plotted in two panels.
The top panel corresponds to the dust-free gas and the bottom panel to a dusty region.” b) (right)
Taken from Diaz-Miller et al. (1998) as representative of a B5V star: HII region and PDR structures,
with and without dust, for a star with Teff = 1.6 × 10⁴ K and a density of 105cm−3 The ionization
structures of each element H, He, C, O, and C are plotted. For H and C, the top panel corresponds
to the dust-free gas and the bottom panel to a dusty region. For He, O, and N, the dusty and
dust-free regions are coincident.
7. – 7 –
Fig. 6.— 1420 MHz image from the Canadian Galactic Plane Survey overlaid with a black circle
centered at the nearby O6 main sequence star. The radius of the figure is the resulting PDR radius
(which could be larger with slightly different parameters). The white cross indicates the closeness
of the C+pointing, within range of the PDR. The 1420 MHz tracks thermal radio emission and
shows the extent of the ionization.
4. Additional Physical Comparison
There are more regions we can inspect just in the Outer Galaxy:
87.2, -0.5 Nearby (in angular sense) star TYC 3588-1942-1, no known spectral type, near NGC
7000
109.8, +0.0 3 stars within 250 arcseconds, no konwn spectral type on any
109.8, +2.0 6 YSOs within 300 arcseconds
150.6, -1.0 Very compelling case, known radio source S206 at location, NGC 1491 nearby, SH
2-206 within PDR region is type 06
202.6, +2.0 Near NGC 2264, a few candidate stars, only one with spectral type known (A3V)
207.2, -2.0 Possibly associated with Rosette Nebula
261.5, +0.0 Vela Molecular Ridge
8. – 8 –
5. Future Ideas
This is by no means a complete idea and requires future investigation. Some future ideas are:
• Examine the OH measures that accompany four of the CII pointings
• Apply the model to some of the narrow Inner Galaxy pointings
• Consider the variable density and temperature case
• Predict the emission measures and compare to the known measures
• Consider the effects of dust decreasing the size of the PDR and HII region
• Determine the ionization structure for a given spectral type and hydrogen density
6. Conclusions
It is not unreasonable to attribute the narrow C+emission to O and B type stars. Due to the
high abundance of B stars, it’s possible some of the Inner Galay extended emission results from
multiple B stars along the line of sight. This could make C+a less effective tracer for CO-dark H2 .
9. – 9 –
REFERENCES
Cardelli, J.A., Meyer, D.M., Jura, M., & Savage, B. D. 1996, ApJ, 467, 334
Crampton & Fisher 1974, Pub. of the Dominion Astrophyscial Observatory Victoria, 14, 283
Covarrubias, R. I. D. 1998, Thesis at Universidad Nacional Autonoma De Mexico
de Graauw, T., Helmich, F.P., Philips, T. G., et al. 2010, A&A, 518, L6
Diaz-Miller, R., Franco, J., & Shore, S. N. 1998, ApJ, 501, 192
Draine, B. T. 2011, Physics of the Interstellar and Intergalactic Medium (Princeton, NJ)
Goldsmith, P. F., Langer, W. D., Pineda, J. L., & Velusamy, T. 2012, ApJ, 203, 13
Nakagawa, T., Yui, Y. Y., Doi, Y., et al. 1998, ApJS, 115, 259
Pilbratt, G.L., Riedinger, J. R., Passvogel, T., et al. 2010, A&A, 543, A103
Pineda, J.L., Langer, W.D., Velusamy, T., & Goldsmith, P.F. 2013, A&A, 554, A103
Tielens, A.G.G.M. 2005, The Physics and Chemistry of the Interstellar Medium, BOOK
Wiesenfeld, L. & Goldsmith, P. F. 2014, ApJ, 780, 183
This preprint was prepared with the AAS LATEX macros v5.2.

![– 2 –
regions around OB stars. This paper discusses the Outer Galaxy while there are some isolate
narrow features in the Inner Galaxy.
l b Vel.[km/s] Intensity[K km/s]
87.2 -0.5 +6.3 2.7
109.8 +0.0 -49.7 2.1
109.8 +2.0 -9.8 9.2
150.6 -1.0 -21.4 18.5
202.6 +2.0 +10.4 3.7
207.2 -2.0 +15.1 8.2
261.5 +0.0 +7.5 3.1
265.5 -2.0 +91.8 3.3
Table 1: This comprehensive list of the isolated and bright narrow features in the Outer Galaxy
details the longitude, latitude, maximum line velocity, and the integrated intensity.
2. Model Structure
The region surrounding the OB-type star is layered containing, in this simplification, three
distinct layers: the ionized region consisting of HII , CIII , and CIV ; the atomic region consisting of
HI and C+; and the molecular region consisting of HI , C+, C, and CO.
The inner ionized region is approximated to contain no CII but instead more ionized C (i.e. CIII ,
CIV , ...). The atomic region between the ionization front and the dissociation front is approximated
as only CII and HI . Beyond the dissociation front, the molecular region will predominantly be C,
CO, and H2 . This investigation estimates the C+ emission due to the collision between CII and
HI between the ionization and dissociation fronts.
The inner HII region radius was first studied by Stromgren in 1938. This region contains only
HII except for some HI at the edges close the ionization front.
RS =
3NLY C
4πn2αB
1/3
(1)
NLY C is the number of ionizing photons emitted by the central star. αB ≈ 2.56×10⁻¹³T−0.83
4 cm3s−1
(Draine 2011)
The distance the photodissociation front extends in equilibrium conditions is (Diaz-Miller et
al. 1998):](data:image/gif;base64,R0lGODlhAQABAIAAAAAAAP///yH5BAEAAAAALAAAAAABAAEAAAIBRAA7)