A Bio-Inspired Pressure Compensating Emitter for Low-Cost Drip Irrigation Sys...
SD2_Poster
1. Load Cell Components
● The load cell is the part of the system that measures flow force
through the attached strain gauges. Its components include:
➔ 1) Outer support and pressure gauge mount
➔ 2) Leading pipe
➔ 3) Cantilever beams (8) made of stainless steel (spring steel)
◆ A full-bridge sensing configuration is used for each side of load cell
◆ Silicon is used to attach the membrane to the inner and outer supports.
➔ 4) Pressure measurement connections
➔ 5) Central floating member / test segment (model blood vessel)
Sensor to Measure Direct Wall Shear Stress in Blood Vessels
Team: Ilia Goldshtein, Matthew Humbert, Charles Mitchell, Paul Romanov
Faculty Advisor: Dr. Kurosh Darvish
Problem Statement
● The main objective for this project was to design and produce a
testing mechanism that accurately measures shear stress in a model
environment.
● Currently, measurement of shear stress in blood vessels is mostly done by
simulation and approximation. Blood flow rates can be measured by MRI and
shear stress can be approximated assuming Poiseuille flow. Based on current
literature, this shear stress can range from 2.5 - 10 dyn/cm2. Reynolds numbers
for flow through blood vessels range from 500 - 7500.
● Abnormal shear stress on blood vessel walls can lead to changes in the
structure of the blood vessel and various cardiovascular diseases.
● Our design modeled only the straight portion of an aorta.
Methodology
● For various flow rates, wall shear stress was calculated based on Poiseuille’s
equation of flow.
● By converting shear stress to force for different flow rates, we were able to
optimise the strain-gauge-equipped cantilever beams for maximum strain
measurements and kept the system as small as possible.
○ Formulas used to calculate shear stress:
● Floating member was kept near the dimensions of a real aorta (25-30 mm)
● A spreadsheet was created for flow rates ranging from 0-200 GPH. (beam
dimensions and material could be changed)
○ This was used to optimize the cantilever beams to record the maximum
strain levels possible.
○ Beam dimensions and materials could be changed in the spreadsheet to
obtain different results.
○ When using the actual viscosity value of water, shear stress level is very
similar to that found in professional simulations.
● A full 3D model was built in SolidWorks. Calculated strain was compared to
strain obtained from SolidWorks simulations (SimulationXpress). After
verification, the apparatus was built.
● A data acquisition system was created to obtain strain from the experimental
procedures
○ System measured strain and pressure values simultaneously.
● To validate the shear stress results from strain, we measured the pressure drop
across the floating member, which should produce the same shear level as
calculated by Poiseuille flow.
● Because of low force magnitudes, the system was tested on a vibration
isolation table, which reduced the noise levels in the gauges by approximately
90%.
Design Overview
● The final developed design consists of a central floating member and cantilever beam load cell setup.
○ Previous design concepts included:
■ Using deformable fittings connecting the floating member and the leading pipe to measure
strain.
■ Using a disc-shaped membrane instead of cantilever beams.
● As the flow moves through the floating member, a shear force is created due to the friction force of the
pipe wall. The force acting on the pipe causes the system to shift and the cantilever beams to bend.
Strain gauges attached to each cantilever beam measure the strain created by the shear force.
Results Discussion
This design is a model of a relatively inexpensive and simple system for
direct measurement of wall shear stress. Though it is an early prototype,
the apparatus produced impressive results. With refinement, this device
can be very useful in applications that would otherwise require extensive
simulation or indirect testing methods to estimate shear stress.
At completion, this project resulted in:
● A fully functioning test apparatus
● A calibrated data acquisition setup and test system, capable of
measuring accurate data from:
○ Strain gauge bridge connections
○ Pressure differential transmitter connection
● A custom LabView program to organize and record data in real time.
○ Using this program, strain vs. time and pressure vs. time outputs
can be recorded simultaneously.
○ Capacity to transfer data to spreadsheet, where plotting and
analysis is done.
Team number: 38
Website:
sites.google.com/a/temple.edu/PreciSense
1
2
3
4
5
Example of simulation results
of time-averaged wall shear
stress in an aorta.
(Wall shear stress in a subject specific
human aorta - Influence of fluid-structure
interaction, 2011, International Journal of
Applied Mechanics, (3), 4, 759-778.)
Our design focused on the
straight portion of the aorta
(blue, lower shear).
Limitations
● The system approximates laminar flow through a smooth, rigid vessel,
therefore, results obtained are expected to be comparable to those given by
Poiseuille’s equation for flow.
○ In contrast, real blood vessels stretch, change in diameter throughout their
length and have variable surface textures. Flow is 2-D instead of the 1-D
flow that Poiseuille's equation approximates.
● In this apparatus, shear stress is measured over a set length of tubing. An
ideal future sensor would measure shear stress locally at a specific point.
○ System size dictates the lengths of blood vessel measurable.
● System precision depends on component manufacturing. More advanced
production and calibration methods would allow for greater accuracy.
Section of spreadsheet showing theoretical
outputs for an 85 GPH flow rate, using
blood and water as the moving fluids.
WATER
BLOOD
Sample of
a fine
mesh
study
around the
cantilever
beams.
● Tests were completed using different fluids and various
flow rates.
○ The two main fluids used were air and water.
○ The water pump used in the project was not capable
of producing the expected flow rate.
● Data was collected using our custom LabView program.
○ Pressure drop and strain readings were recorded
simultaneously for each test run.
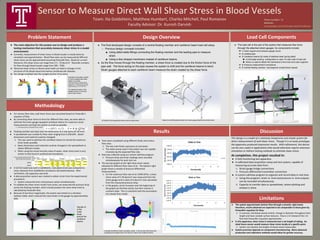
● The top two graphs at the right show strain values
obtained for different flow rates of air. The bottom-right
graph shows a sample of pressure differential
measurements.
○ For the maximum flow rate of air (3400 GPH), a shear
stress value of 5.78 dyn/cm2 was measured from the
strain gauges and a value of 6 dyn/cm2 was calculated
from the measured pressure drop.
○ In the graphs, strain increases near the beginning of
the graphs (as the flow starts), but then reaches a
constant state. This is consistent with the assumption
of a steady-flow model.
A sample SolidWorks strain simulation model. It can be seen that the points
undergoing the highest strain are near the roots of the cantilever beams.
3D Model of test apparatus without sensor attachment. Detail of central floating member with strain gauge attachment points shown.