Global warming, sea level rise and coastal inundation
Thermokarst Lake Dynamics in Siberia
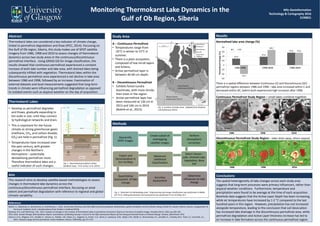
1. Results
Normalised lake area change (%)
There is a spatial difference between Continuous (C) and Discontinuous (DC)
permafrost regions between 1986 and 1998 – lake area increased within C and
decreased within DC, before both experienced high increases after 1998.
Continuous Permafrost Study Region – small lakes combine together.
Discontinuous Permafrost Study Region – lakes drain away, others expand.
Monitoring Thermokarst Lake Dynamics in the
Gulf of Ob Region, Siberia
MSc Geoinformation
Technology & Cartography 2016
2190831
Abstract
Thermokarst lakes are considered a key indicator of climate change,
linked to permafrost degradation and thaw (IPCC, 2014). Focussing on
the Gulf of Ob region, Siberia, this study makes use of SPOT satellite
imagery from 1986, 1998 and 2010 to assess changes of thermokarst
dynamics across two study areas in the continuous/discontinuous
permafrost interface. Using GRASS GIS for image classification, the
results showed that continuous permafrost experienced a constant
increase of both lake number and lake area, with drained lakes being
subsequently infilled with vegetation. Thermokarst lakes within the
discontinuous permafrost zone experienced a net decline in lake area
between 1986 and 1998, followed by an increase. Examination of
external datasets and local measurements suggested that long-term
trends in climate were influencing permafrost degradation as opposed
to isolated events such as atypical weather on the day of acquisition.
Thermokarst Lakes
• Develop as permafrost degrades
and thaws, gradually expanding to
km-scale in size, until they connect
to hydrological networks and drain.
• This is important for the future
climate as strong greenhouse gases
(methane, CH4, and carbon dioxide,
CO2) are held in permafrost (Fig. 1).
• Temperatures have increased over
the past century, with greater
changes in the Northern
Hemisphere – potentially
destabilising permafrost more.
Therefore thermokarst lakes are a
useful indicator of such changes.
Aim
This research aims to develop satellite-based methodologies to assess
changes in thermokarst lake dynamics across the
continuous/discontinuous permafrost interface, focussing on areal
extent and permafrost degradation with reference to regional and global
climatic variability.
Fig. 1. Generalised permafrost carbon
feedback loops. From Schuur et al. (2015)
Study Area
A – Continuous Permafrost
• Temperatures range from
-25°C in winter to 15°C in
summer.
• There is a plain ecosystem,
composed of low shrub layers
and lichens.
• Active permafrost layer is
between 40-60 cm depth.
B – Discontinuous Permafrost
• Exhibits forest-tundra
bioclimate, with more shrubs
than trees in the region.
• Active permafrost layer has
been measured at 136 cm in
2013 and 166 cm in 2014
(Bobrik et al., 2015).
Fig. 2. Location of study areas. Adapted from Bryksina
and Polishchuk (2015).
Methods
Georectify
SPOT images
Create subset of
overlapping
satellite images
Perform
atmospheric
correction
Select classes -
Lake, Drained Lake,
Vegetation, Bare
Soil
Maximum
Likelihood
Classification
Export and
Generalisation in
Esri ArcMap
Quantitative
assessment of lake
change
Accuracy
Assessment
Determine
influences on lake
change
Fig. 3. Flowchart of methodology used. Preprocessing and image classification was performed in GRASS
GIS 7.0.4, while generalisation and assessment was performed in Esri ArcMap 10.3
29.2
37.6
55.8
-39.7
68.2
55.6
-60
-40
-20
0
20
40
60
80
1986-1998 1998-2010 1986-2010
NormalisedChange(%)
C DC
1986 1998 2010
1986 1998 2010
High : 1
Low : -1
Conclusions
The spatial heterogeneity of lake changes across each study area
suggests that long-term processes were primary influencers, rather than
atypical weather conditions. Furthermore, temperature and
precipitation were found to be average at the time of each acquisition.
Borehole data suggests that the Active Layer Depth has been increasing,
while air temperatures have increased by 1-2 °C compared to the last
hundred years in this region. However, precipitation has not increased
alongside temperature, leading to the conclusion that soil desiccation
has increased lake drainage in the discontinuous permafrost area, while
permafrost degradation and Active Layer thickness increase has led to
an increase in lake formation across the continuous permafrost region.
NDVI
References
Bobrik, A., Matyshak, G., Goncharova, O. and Ryzhova, I., 2015. Active layer thickness and CO2 efflux of frozen peatlands: Relationship, spatial variability, trend of climate change (CALM R1, western Siberia, Russia). Longyearbyen &
Hornsund, Svalbard, Arctic: Interdisciplinary Polar Studies in Svalbard (IPSiS)
Bryksina, N.A. and Polishchuk, Y.M., 2015. Analysis of changes in the number of thermokarst lakes in permafrost od western Siberia on the basis of satellite images. Kriosfera Zemli, 19(2), pp.100–105.
IPCC, 2014. Cimate Change 2014 Synthesis Report. Contribution of Working Grousp I II and III to the Fifth Assessment Report of the Intergovernmental Panel on Climate Change. Geneva, Switzerland: IPCC.
Schuur, E.A.G., Maguire, A.D., Schadel, C., Grosse, G., Harden, J.W., Hayes, D.J., Hugelius, G., Koven, C.D., Kuhry, P., Lawrence, D.M., Natali, S.M., Oleldt, D., Romanovsky, V.E., Schaefer, K., Turetsky, M.R., Treat, C.C. and Vonk, J.E.,
2015. Climate change and the permafrost carbon feedback. Nature, 520(7546), pp.171–179.