Electrolux Consolidated Results 2013
•
0 likes•1,477 views

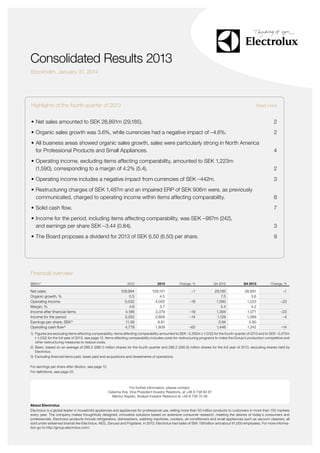
Highlights of the fourth quarter of 2013. Net sales amounted to SEK 28,891m (29,185). Organic sales growth was 3.6%, while currencies had a negative impact of –4.6%.

Recommended
Recommended
More Related Content
What's hot
What's hot (15)
Viewers also liked
Viewers also liked (20)
Similar to Electrolux Consolidated Results 2013
Similar to Electrolux Consolidated Results 2013 (20)
More from Electrolux Group
More from Electrolux Group (16)
Recently uploaded
Recently uploaded (20)
Electrolux Consolidated Results 2013
- 1. XXamounreporte Consolidated Results 2013 Stockholm, January 31, 2014 Highlights of the fourth quarter of 2013 Read more • Net sales amounted to SEK 28,891m (29,185). 2 • Organic sales growth was 3.6%, while currencies had a negative impact of –4.6%. 2 • ll business areas showed organic sales growth, sales were particularly strong in North America A for Professional Products and Small Appliances. 4 • perating income, excluding items affecting comparability, amounted to SEK 1,223m O (1,590), corresponding to a margin of 4.2% (5.4). 2 • perating income includes a negative impact from currencies of SEK –442m. O 3 • estructuring charges of SEK 1,487m and an impaired ERP of SEK 906m were, as previously R communicated, charged to operating income within items affecting comparability. 8 • Solid cash flow. 7 • ncome for the period, including items affecting comparability, was SEK –987m (242), I and earnings per share SEK –3.44 (0.84). 3 • The Board proposes a dividend for 2013 of SEK 6.50 (6.50) per share. 9 Financial overview SEKm1) Net sales Organic growth, % Operating income Margin, % Income after financial items Income for the period Earnings per share, SEK 2) Operating cash flow3) 2012 2013 Change, % Q4 2012 Q4 2013 Change, % 109,994 5.5 5,032 4.6 4,186 3,252 11.36 4,779 109,151 4.5 4,055 3.7 3,379 2,809 9.81 1,809 –1 29,185 7.5 1,590 5.4 1,394 1,129 3.94 1,446 28,891 3.6 1,223 4.2 1,071 1,089 3.80 1,242 –1 –19 –19 –14 –62 –23 –23 –4 –14 1) Figures are excluding items affecting comparability. Items affecting comparability amounted to SEK –2,393m (–1,032) for the fourth quarter of 2013 and to SEK –2,475m (–1,032) for the full year of 2013, see page 12. Items affecting comparability includes costs for restructuring programs to make the Group’s production competitive and other restructuring measures to reduce costs. 2) asic, based on an average of 286.2 (286.1) million shares for the fourth quarter and 286.2 (285.9) million shares for the full year of 2013, excluding shares held by B Electrolux. 3) Excluding financial items paid, taxes paid and acquisitions and divestments of operations. For earnings per share after dilution, see page 12. For definitions, see page 22. For further information, please contact: Catarina Ihre, Vice President Investor Relations, at +46 8 738 60 87 Merton Kaplan, Analyst Investor Relations at +46 8 738 70 06 About Electrolux Electrolux is a global leader in household appliances and appliances for professional use, selling more than 50 million products to customers in more than 150 markets every year. The company makes thoughtfully designed, innovative solutions based on extensive consumer research, meeting the desires of today’s consumers and professionals. Electrolux products include refrigerators, dishwashers, washing machines, cookers, air-conditioners and small appliances such as vacuum cleaners, all sold under esteemed brands like Electrolux, AEG, Zanussi and Frigidaire. In 2013, Electrolux had sales of SEK 109 billion and about 61,000 employees. For more information go to http://group.electrolux.com/.
- 2. 2 Consolidated results 2013 Market overview Market demand for core appliances in North America increased by 10%. Demand in Western Europe declined by 1% and in Eastern Europe by 2%. Market demand in Australia is estimated to have declined somewhat. Demand in Southeast Asia and China continued to show growth. Demand for appliances in Brazil declined, while other Latin American markets showed growth. Industry shipments of core appliances in Europe* % 10 Industry shipments of core appliances in the US* Western Europe % 10 Eastern Europe 5 5 0 0 –5 –10 Q1 Q2 Q3 Q4 Q1 Q2 Q3 Q2 Q3 Q4 Q1 Q2 Q3 –10 Q4 * Units, year-overyear, %. –5 Q4 * Units, year-overyear, %. 2012 Q1 2012 2013 2013 Sources: Europe: GfK. North America: AHAM. For other markets there are no comprehensive market statistics. The fourth quarter in summary* 2012 2013 Change, % Q4 2012 Q4 2013 Change, % 109,994 109,151 –0.8 29,185 28,891 –1.0 – – – – 4.5 –5.3 – – – – 3.6 –4.6 1,105 1,452 1,590 746 461 588 –910 347 2,136 979 467 391 510 –775 –69 47 –38 –37 –15 –13 15 335 337 657 211 219 155 –324 227 453 224 96 227 172 –176 –32 34 –66 –55 4 11 46 5,032 4.6 –1,032 4,000 3.6 4,055 3.7 –2,475 1,580 1.4 –19 1,590 5.4 –1,032 558 1.9 1,223 4.2 –2,393 –1,170 –4.0 –23 SEKm Net sales Change in net sales, %, whereof Organic growth Changes in exchange rates Operating income Major Appliances Europe, Middle East and Africa Major Appliances North America Major Appliances Latin America Major Appliances Asia/Pacific Small Appliances Professional Products Other, common Group costs, etc. Operating income, excluding items affecting comparability Margin, % Items affecting comparability Operating income Margin, % –61 –310 * All comments are excluding items affecting comparability. For items affecting comparability, see page 12. • Organic growth of 3.6%. • Organic sales growth in all business areas. • Continued strong growth in North America. • Good performance for Professional Products and Small Appliances. • Continued price pressure and unfavorable currency movements impacted operations in Europe. • Negative impact from currency movements affected earnings across all business areas, particularly in emerging markets. Net sales for the Electrolux Group decreased by 1.0% in the fourth quarter of 2013. Organic growth was 3.6%, while changes in exchange rates had a negative impact of –4.6%. The organic sales growth was mainly attributable to Professional Products, the operations in North America, Asia/Pacific and Small Appliances. Operating income declined to SEK 1,223m (1,590), corresponding to a margin of 4.2% (5.4), including unfavorable currency movements of SEK –442m. In Europe, a continued weak market environment and price pressure in several of the Group’s core markets had an adverse impact on operating income. Electrolux applies the amended standard for pension accounting, IAS 19 Employee Benefits, as of January 1, 2013. Reported figures for 2012 have been restated to enable comparison. The impact on Electrolux financial statements for 2012 was released in March 2013, see page 11 and http://www.electrolux.com/ias19/.
- 3. 3 Consolidated results 2013 Operating income in Latin America was negatively impacted by negative currency movements and lower volumes related to the fire in September 2013 in the warehouse for refrigerators and freezers in Curitiba, Brazil. Increased marketing spend related to the product launch in China, the Group’s largest launch in 2013 and 2014, impacted earnings for Asia/Pacific for the quarter. Earnings and margins for Major Appliances North America stayed on a very healthy level, excluding positive one-offs, and increased slightly in local currency. Manufacturing underabsorption due to inventory reduction and negative customer mix impacted earnings. Professional Products and Small Appliances showed a continued positive development in earnings. Effects of changes in exchange rates Exchange-rate movements had a negative impact of SEK –442m on operating income year-over-year in the quarter. The impact of transaction effects was SEK –375m, results from hedging operations SEK 50m and translation effects SEK –117m. Operations in Latin America, Asia/Pacific and Europe, Middle East and Africa were impacted by a stronger US dollar and euro against local currencies, especially in emerging markets. Financial net Net financial items for the fourth quarter of 2013 improved to SEK –152m (–196), mainly due to lower interest rates. Income for the period Income for the period amounted to SEK –987m (242), corresponding to SEK –3.44 (0.84) in earnings per share, see page 12. Events during the fourth quarter of 2013 November 13. Electrolux Capital Markets Day At Electrolux capital markets day, a status update on the Group’s strategy, focusing on actions to drive profitable growth and further improve operational excellence was presented. The program included an overview of the current business environment and expectations for next year. Total market demand is still anticipated to be slightly positive in the fourth quarter. Market demand in 2014 is also expected to be slightly positive, with growth in North America and Asia/Pacific partly offset by a flat market in Europe and a slowdown in Brazil from the high levels seen in 2013. Other factors affecting Electrolux in 2014 include a slightly positive price/mix development, with a negative price trend in Europe mitigated by a positive product mix. Cost savings will be approximately SEK 1 billion for the full year. Investments in RD and marketing will be slightly higher than in 2013, mainly as a result of marketing costs related to product launches in Asia and higher global RD spending. The impact on earnings from raw-material costs is estimated to be roughly flat. November 28. Launch of premium appliances range in China Electrolux has launched a full range of kitchen and laundry appliances exclusively designed for the Chinese market. It is the Group’s largest product launch this year and is a key initiative for growth in this important market. The new range covers more than 60 products and includes refrigerators, washing machines, cooking hobs, hoods and dish sterilizers. November 29. Stefano Marzano retired from Electrolux The Chief Design Officer Stefano Marzano, member of Group Management, announced the retirement from his position as of year-end 2013. Read more on page 10. Full year of 2013 Net sales for the Electrolux Group in the full year of 2013 amounted to SEK 109,151m (109,994). Net sales declined by 0.8%. Organic growth was 4.5%, while changes in exchange rates had a negative impact of –5.3%. Operating income declined to SEK 4,055m (5,032), corresponding to a margin of 3.7% (4.6), including unfavorable currency movements of SEK –1,460m. Increased sales volumes and product-mix improvements contributed to operating income, while continued weak markets in Europe and unfavorable currency development had an adverse impact on operating income. Income after financial items amounted to SEK 3,379m (4,186). Income for the period was SEK 2,809m (3,252), corresponding to SEK 9.81 (11.36) in earnings per share. Share of sales by business area for the full year 2013 Consumer Durables, 95% Europe, Middle East and Africa, 31% North America, 29% Latin America, 19% Asia/Pacific, 8% Operating income and margin* SEKm 2,000 % 10 1,600 8 1,200 6 800 4 400 2 Small Appliances, 8% Professional Products, 5% 0 Q1 Q2 Q3 2012 EBIT Q4 Q1 EBIT margin Q2 Q3 2013 Q4 0 * Excluding items affecting comparability.
- 4. 4 Consolidated results 2013 Business areas Major Appliances Europe, Middle East and Africa Industry shipments of core appliances in Europe, units, year-over-year, % Western Europe Eastern Europe (excluding Turkey) Total Europe 2012 2013 Q4 2012 Q4 2013 –2 3 –1 –1 0 –1 –2 2 –1 –1 –2 –1 34,278 –0.9 1,105 3.2 33,436 –0.2 347 1.0 9,216 –2.5 335 3.6 9,281 1.1 227 2.4 SEKm Net sales Organic growth, % Operating income Operating margin, % In the fourth quarter of 2013, the overall market for core appliances in Europe declined year-over-year. Demand in Western Europe declined by 1% compared with the preceding year. Demand declined in for Electrolux important markets as the Nordic countries, Italy, France and Benelux, while Germany and the UK saw some growth. Demand in Eastern Europe declined by 2%, driven by a slowdown in Russia. Demand improved somewhat in Poland. Organic sales in Europe increased somewhat year-over-year. The product mix improved, but this was offset by a continued price pressure. The new products under the Electrolux brand, The Inspiration Range, continued to improve the product mix. In the quarter, market shares increased in several regions under own strategic brands. Operating income declined in the fourth quarter. Unfavorable currency movements and price pressure were the main factors. During the fourth quarter, actions were initiated to reduce overhead costs and to improve the competitiveness within manufacturing, as previously announced, see page 8. SEKm % 600 6 400 4 200 2 0 Q1 Q2 Q3 Q4 Q1 2012 Q2 Q3 Q4 0 2013 EBIT EBIT margin Major Appliances North America Industry shipments of appliances in the US, units, year-over-year, % Core appliances Microwave ovens and home comfort products Total Major Appliances 2012 2013 Q4 2012 Q4 2013 –2 1 0 9 –6 5 –2 1 0 10 –3 7 30,684 6.9 1,452 4.7 31,864 7.6 2,136 6.7 7,207 17.7 337 4.7 7,573 7.6 453 6.0 SEKm Net sales Organic growth, % Operating income Operating margin, % In the fourth quarter, market demand for core appliances in North America rose by approximately 10% year-over-year. Market demand for major appliances including microwave ovens and home comfort products, such as room air-conditioners, increased by 7% during the quarter. In the fourth quarter, the organic sales growth in North America was 7.6%, due to higher volumes of core appliances. The favorable market environment, previous launches of new products and new distribution channels had a positive impact on sales. Electrolux sales volumes rose in several of the core appliance product categories and the Group continued to capture market shares in these categories. Operating income increased somewhat in local currency, excluding positive one-offs. Volume growth contributed positively. Lower manufacturing volumes, due to inventory reduction, led to underabsorption, which together with changed customer mix affected the operating income negatively. In the quarter, agreements were settled with participants in pen- % SEKm 800 8 600 6 400 4 200 2 0 Q1 Q2 Q3 Q4 Q1 2012 EBIT Q2 Q3 Q4 0 2013 EBIT margin sion plans to receive a lump-sum payment for accrued pension rights and thereby leave the plan. This resulted in an accounting gain of SEK 133m, which is included in the operating income for the quarter, see page 10.
- 5. 5 Consolidated results 2013 Major Appliances Latin America 2012 2013 Q4 2012 Q4 2013 22,044 20.6 1,590 7.2 20,695 6.1 979 4.7 6,411 19.2 657 10.2 5,639 0.4 224 4.0 SEKm Net sales Organic growth, % Operating income Operating margin, % In the fourth quarter of 2013, market demand for core appliances in Latin America is estimated to have declined year-over-year, mainly as a result of a continued slowdown in Brazil. The market demand for the corresponding period last year was partly driven by the government’s incentive program for appliances. In Latin America, the Group showed slightly positive organic growth year-over-year, mainly driven by price increases and an improved mix. The fire in September 2013, at Electrolux warehouse for refrigerators and freezers in Curitiba, Brazil, impacted volumes negatively in the fourth quarter. Operating income declined for the fourth quarter, partly due to the volume losses related to the fire in the warehouse in Brazil. Continued headwinds from currency movements also impacted the results as the Brazilian real and other Latin American currencies weakened versus the US dollar. Negative currency movements affected the overall profit with about SEK –130m, but was to some extent offset by price increases. SEKm % 700 15 560 12 420 9 280 6 140 3 0 Q1 Q2 Q3 Q4 Q1 2012 EBIT Q2 Q3 Q4 0 2013 EBIT margin Major Appliances Asia/Pacific 2012 2013 Q4 2012 Q4 2013 8,405 2.9 746 8.9 8,653 10.8 467 5.4 2,259 3.4 211 9.3 2,157 4.3 96 4.5 SEKm Net sales Organic growth, % Operating income Operating margin, % In the fourth quarter of 2013, market demand for major appliances in Southeast Asia and China is estimated to have grown year-over-year, while market demand in Australia declined somewhat. The organic sales growth during the quarter was due to price increases and an improved product mix. Sales increased in all regions. Operating income developed well in the quarter in Australia and New Zealand, but was under pressure in Southeast Asia due to startup costs in the new refrigerator plant in Rayong in Thailand. In China, Electrolux intensified the launch of the new range of products for the Chinese market. The launch was the Group’s largest in 2013, and it continues well through 2014, with more than 60 new products for kitchen and laundry in the important growth market China. The cost for these launch activities had an adverse impact on earnings, but the underlying operating profit margin continued to improve. The negative currency development continued during the quarter as the US dollar strengthened against the Australian dollar and several other currencies in emerging markets. The product mix improved though, due to new products in China and Southeast Asia, which contributed to operating income. SEKm % 300 15 240 12 180 9 120 6 60 3 0 Q1 Q2 Q3 Q4 Q1 2012 EBIT Q2 Q3 2013 EBIT margin Q4 0
- 6. 6 Consolidated results 2013 Small Appliances 2012 2013 Q4 2012 Q4 2013 9,011 6.0 461 5.1 8,952 4.4 391 4.4 2,689 7.5 219 8.1 2,697 4.8 227 8.4 SEKm Net sales Organic growth, % Operating income Operating margin, % In the fourth quarter of 2013, market demand for vacuum cleaners in Europe is estimated to have declined, while demand in North America is estimated to have increased year-over-year. Group sales increased year-over-year in the fourth quarter due to higher volumes, higher prices and an improved product mix. Sales volumes of small domestic appliances and handheld vacuum cleaners were strong and increased in most regions, particularly in Asia/ Pacific and Europe. The significance of sales related to small domestic appliances is increasing. Operating income for the fourth quarter improved year-over-year. Product-mix improvements and higher prices contributed to the good earnings trend in the quarter. 2013 was an intensive launch year and the new products have improved the mix. SEKm % 300 15 240 12 180 9 120 6 60 3 0 Q1 Q2 Q3 Q4 Q1 Q2 2012 EBIT Q3 0 Q4 2013 EBIT margin Professional Products 2012 Net sales Organic growth, % Operating income Operating margin, % In the fourth quarter, market demand in Southern and Northern Europe, where Electrolux holds a strong position, remained weak and declined year-over-year, while demand in emerging markets and in the US increased somewhat. Electrolux sales increased strongly year-over-year in the fourth quarter particularly due to higher volumes. This is a result of the Group’s strategic initiatives to grow in new markets and segments. Sales were particularly strong in emerging markets and in the US. Both sales of professional food-service equipment and professional laundry equipment increased. Operating income in the fourth quarter improved year-over-year, primarily as a result of higher sales volumes. Price increases also positively impacted results. Investments in new products to promote growth in new markets and channels also impacted results. The market introduction of the ultra-luxury product range, Electrolux Grand Cuisine, continued throughout the year. 2013 Q4 2012 Q4 2013 5,571 –3.9 588 10.6 SEKm 5,550 1.7 510 9.2 1,402 –8.9 155 11.1 1,544 10.6 172 11.1 SEKm % 250 15 200 12 150 9 100 6 50 3 0 Q1 Q2 Q3 Q4 Q1 2012 EBIT Q2 Q3 Q4 2013 EBIT margin 0
- 7. 7 Consolidated results 2013 Cash flow SEKm Operations Change in operating assets and liabilities Capital expenditure Operating cash flow Acquisitions and divestments of operations Financial items paid, net Taxes paid Cash flow from operations and investments Dividend Sale of shares Total cash flow, excluding change in loans and short-term investments Cash flow from operations and investments in the fourth quarter of 2013 was in line with the previous year and amounted to SEK 712m (758). The trend for the cash flow and working capital in the fourth quarter of 2013 reflects a normal seasonal pattern with increased sales and declining inventories. The positive cash flow during the second, third and fourth quarters has not fully compensated for the negative cash flow in the first quarter. Payments for the ongoing restructuring and cost-cutting programs amounted to SEK 259m in the quarter and to SEK 603m in the full year of 2013. Investments in the fourth quarter mainly related to investments within manufacturing facilities for new products. Major projects are the cooker plant in Memphis, Tennessee, in the US and the refrigerator plant in Rayong in Thailand. The cooker plant in Memphis is receiving investment support from state authorities. 2012 2013 Q4 2012 Q4 2013 7,789 1,528 –4,538 4,779 –164 –673 –1,564 7,013 –675 –4,529 1,809 –205 –540 –1,343 2,359 437 –1,350 1,446 — –223 –465 1,801 837 –1,396 1,242 –3 –122 –405 2,378 –1,868 212 –279 –1,860 — 758 — — 712 — — 722 –2,139 758 712 Cash flow from operations and investments SEKm 4,000 3,000 2,000 1,000 0 Q2 Q1 Q3 Q4 Q1 Q3 Q2 Q4 –1,000 –2,000 –3,000 –4,000 2012 2013 Financial position Net debt Dec. 31, 2012 Dec. 31, 2013 13,088 7,403 5,685 4,479 10,164 0.65 15,726 54.96 14.4 23.2 SEKm 14,905 7,232 7,673 2,980 10,653 0.74 14,308 49.99 4.4 20.8 Borrowings Liquid funds Financial net debt Net provisions for post-employment benefits Net debt Net debt/equity ratio Equity Equity per share, SEK Return on equity, % Equity/assets ratio, % Cash flow and change in financial net debt Financial net debt December 31, 2012 Operations Operating assets and liabilities Investments Acquisitions/divestments Financial net and tax Dividend 00 ,0 10 00 0 5, 00 ,0 –5 0, 00 0 Other Financial net debt December 31, 2013 0 Sale of shares –1 The financial net debt increased by SEK 1,988m during the year as a result of the negative cash flow from operations and investments as well as the dividend payment. Net provision for post-employment benefits declined by SEK 1,499m. Net debt increased somewhat compared to 2012. Long-term borrowings as of December 31, 2013, including longterm borrowings with maturities within 12 months, amounted to SEK 12,207m with average maturity of 3.3 years, compared to SEK 11,005m and 3.1 years at the end of 2012. During 2014 and 2015, long-term borrowings in the amount of SEK 3,067m will mature. Liquid funds as of December 31, 2013, amounted to SEK 7,232m (7,403), excluding short-term back-up facilities. Electrolux has two unused committed back-up facilities. One EUR 500m multi-currency revolving credit facility, approximately SEK 4,400m, maturing in 2018 and a credit facility of SEK 3,400m maturing in 2017. SEKm
- 8. 8 Consolidated results 2013 Net assets and working capital Average net assets for the year amounted to SEK 27,148m (27,070). Net assets as of December 31, 2013, amounted to SEK 24,961m (25,890). Adjusted for items affecting comparability, i.e., restructuring provisions, average net assets amounted to SEK 28,915m (28,112), corresponding to 26.5% (25.6) of net sales. Working capital as of December 31, 2013, amounted to SEK –5,800m (–6,505), corresponding to –5.1% (–5.7) of annualized net sales. The return on net assets was 5.8% (14.8), and 14.0% (17.9), excluding items affecting comparability. Structural changes As communicated in the Q3 report in October 2013, Electrolux is taking actions to reduce annual costs by SEK 1.8bn for a charge of SEK 3.4bn. Costs savings are planned to be achieved through manufacturing footprint restructuring as well as overhead-cost reductions. These actions relate mainly to Major Appliances Europe, Middle East and Africa, but also to other business areas and Group Staff. In the fourth quarter of 2013, restructuring costs amounting to SEK 1.5bn were charged to operating income within items affecting comparability. In addition, in the fourth quarter operating income within items affecting comparability was impacted by an impairment of parts of an IT platform in the amount of SEK 0.9bn, see page 12. The remaining part of the total charges approximately SEK 2,0bn is expected to be taken during 2014.
- 9. 9 Consolidated results 2013 Annual General Meeting 2014 The Annual General Meeting of AB Electrolux will be held on Wednesday, March 26, 2014, at the Stockholm Waterfront Congress Centre, Nils Ericsons Plan 4, Stockholm, Sweden. Proposed dividend The Board of Directors proposes a dividend for 2013 of SEK 6.50 (6.50) per share, for a total dividend payment of approximately SEK 1,860m (1,860). The proposed dividend corresponds to approximately 66% (57) of income for the period, excluding items affecting comparability. Monday, March 31, 2014, is proposed as record date for the dividend. The Group’s goal is for the dividend to correspond to at least 30% of income for the period, excluding items affecting comparability. Historically, Electrolux dividend rate has been considerably higher than 30%. Electrolux has a long tradition of high total distribution to shareholders that includes repurchases and redemptions of shares as well as dividends. Proposal for resolution on acquisition of own shares Electrolux has previously, on the basis of authorizations by the Annual General Meetings, acquired own shares. The purpose of the repurchase programs has been to adapt the Group’s capital structure, thus contributing to increased shareholder value and to use these shares to finance potential company acquisitions and as a hedge for the company’s share-related incentive programs. The Board of Directors makes the assessment that it continues to be advantageous for the company to be able to adapt the company’s capital structure, thereby contributing to increased shareholder value, and to continue to be able to use repurchased shares on account of potential company acquisitions and the company’s share-related incentive programs. The Board of Directors proposes the Annual General Meeting 2014 to authorize the Board of Directors, for the period until the next Annual General Meeting, to resolve on acquisitions of shares in the company and that the company may acquire as a maximum so many B shares that, following each acquisition, the company holds at a maximum 10% of all shares issued by the company. As of January 31, 2014, Electrolux holds 22,708,321 B shares in Electrolux, corresponding to 7.4% of the total number of shares in the company. Nomination Committee In accordance with decision by the Annual General Meeting, Electrolux Nomination Committee shall consist of six members. The members should be one representative of each of the four largest shareholders in terms of voting rights that wish to participate in the committee, together with the Chairman of the Electrolux Board and one additional Board member. The members of the Nomination Committee have been appointed based on the ownership structure as of August 31, 2013. Börje Ekholm, Investor AB, is the Chairman of the committee. The other owner representatives are Kaj Thorén, Alecta, Marianne Nilsson, Swedbank Robur funds, and Johan Sidenmark, AMF. The committee also includes Marcus Wallenberg and Torben Ballegaard Sørensen, Chairman and Director, respectively, of Electrolux. The Nomination Committee will prepare proposals for the Annual General Meeting in 2014 regarding Chairman of the Annual General Meeting, Board members, Chairman of the Board, remuneration for Board members, Auditor, Auditor’s fees and, to the extent deemed necessary, proposal regarding amendments of the current instruction for the Nomination Committee. Shareholders who wish to submit proposals to the Nomination Committee should send an email to nominationcommittee@electrolux.com.
- 10. 10 Consolidated results 2013 Other items Pension agreement in the US In the fourth quarter of 2013, Electrolux made an agreement with pension plan participants in the US to accept a lump-sum payment of SEK 880m in total in lieu of accrued pension rights and thereby leave the plan. This has reduced Electrolux defined benefit obligation by SEK 1,020m. The difference between the agreed payment and the obligation led to an accounting gain of approximately SEK 140m, which has been reported within operating income. This had no impact on the cash flow. Conversion of shares According to the company’s articles of association, owners of Class A shares have the right to have such shares converted to Class B shares. Conversion reduces the total number of votes in the company. When such a conversion has occurred, the company is obligated by law to disclose any such changes. In October 2013, at the request of shareholders, 20,186 Class A shares were converted to Class B shares. The total number of votes thereafter amounts to 38,265,316. The total number of registered shares in the company amounts to 308,920,308 shares, of which 8,192,539 are Class A shares and 300,727,769 are Class B shares. Asbestos litigation in the US Litigation and claims related to asbestos are pending against the Group in the US. Almost all of the cases refer to externally supplied components used in industrial products manufactured by discontinued operations prior to the early 1970s. The cases involve plaintiffs who have made substantially identical allegations against other defendants who are not part of the Electrolux Group. As of December 31, 2013, the Group had a total of 2,980 (2,864) cases pending, representing approximately 3,040 (approximately 2,936) plaintiffs. During the fourth quarter of 2013, 253 new cases with 253 plaintiffs were filed and 226 pending cases with approximately 226 plaintiffs were resolved. It is expected that additional lawsuits will be filed against Electrolux. It is not possible to predict the number of future lawsuits. In addition, the outcome of asbestos lawsuits is difficult to predict and Electrolux cannot provide any assurances that the resolution of these types of lawsuits will not have a material adverse effect on its business or on results of operations in the future. Changes in Group Management Chief Design Officer Stefano Marzano, member of Group Management, left his position at year-end 2013. The new head of design will report to Chief Technology Officer Jan Brockmann in Group Management. Risks and uncertainty factors As an international group with a wide geographic spread, Electrolux is exposed to a number of business and financial risks. The business risks can be divided into strategic, operational and legal risks. The financial risks are related to such factors as exchange rates, interest rates, liquidity, the giving of credit and financial instruments. Risk management in Electrolux aims to identify, control and reduce risks. This work begins with the description of risks and risk management, see the 2012 Annual Report on page 74. No significant risks other than the risks described there are judged to have occurred. Risks, risk management and risk exposure are described in more detail in the Annual Report 2012, www.electrolux.com/annualreport2012. Press releases 2013 January 31 Electrolux recognized in three prestigious sustainability rankings February 1 Consolidated results 2012 and CEO Keith McLoughlin’s comments February 15 Notice convening the Annual General Meeting of AB Electrolux February 15 Bert Nordberg proposed as new Board Member of AB Electrolux February 22 Electrolux Annual Report 2012 is published March 25 Electrolux restated figures for 2012 following the change in pension accounting standards March 26 Electrolux issues bond loan March 27 Bulletin from AB Electrolux Annual General Meeting 2013 April 4 Electrolux Sustainability Report 2012 now available online April 25 Interim report January-March 2013 and CEO Keith McLoughlin’s comments July 19 Interim report January-June 2013 and CEO Keith McLoughlin’s comments July 23 Electrolux appoints new Head of Investor Relations September 13 Dates for financial reports from Electrolux in 2014 September 16 Electrolux ranked Household Durables Industry Leader in the Dow Jones Sustainability World Index September 24 Nomination committee appointed for Electrolux Annual General Meeting 2014 October 8 Electrolux praised for action and reporting on emissions October 25 Interim report January-September 2013 and CEO Keith McLoughlin’s comments October 31 Conversion of shares in AB Electrolux November 13 Electrolux Capital Markets Day 2013 November 28 Electrolux unveils premium appliances range in China November 29 Chief Design Officer Stefano Marzano to retire from Electrolux
- 11. 11 Consolidated results 2013 Parent Company AB Electrolux The Parent Company comprises the functions of the Group’s head office, as well as five companies operating on a commission basis for AB Electrolux. As from 2013, the main financial flows for the business area Major Appliances Europe, Middle East and Africa are included in the Parent Company reporting, which affects the financial statements significantly. Net sales for the Parent Company, AB Electrolux, for the full year of 2013 amounted to SEK 28,856m (6,125) of which SEK 23,484m (2,959) referred to sales to Group companies and SEK 5,372m (3,166) to external customers. Income after financial items was SEK –1,861m (948), including dividends from subsidiaries in the amount of SEK 2,004m (1,259). Income for the period amounted to SEK –909m (1,119). The Parent Company reports group contribution in the income statement as appropriations for the first time in 2013. Corresponding changes have been made in the 2012 financial statements. Capital expenditure in tangible and intangible assets was SEK 524m (320). Liquid funds at the end of the period amounted to SEK 2,795m, as against SEK 1,986 at the start of the year. Undistributed earnings in the Parent Company at the end of the period amounted to SEK 12,531m, as against SEK 15,269m at the start of the year. Dividend payment to shareholders for 2013 amounted to SEK 1,860m. The income statement and balance sheet for the Parent Company are presented on page 20. Stockholm, January 31, 2014 Keith McLoughlin President and CEO New pension accounting standards as of 2013 Electrolux applies the amended standard for pension accounting, IAS 19 Employee Benefits, as of January 1, 2013. The main change is that the option to use the corridor approach – previously applied by Electrolux – has been removed. Opening balances for 2013 and reported figures for 2012 have been restated to enable comparison. The impact of the restatement on the financial statements, operating income per business area and key ratios of Electrolux for 2012 was presented in a press release on March 25, 2013. An Excel sheet comprising restated figures in more detail including the interim periods is available for download at http:// www.electrolux.com/ias19/. All historical unrecognized actuarial gains or losses are included in the measurement of the net defined benefit liability. This increases the net pension liability for 2012 by SEK 4,618m and reduces equity by SEK 4,098m. Operating income for 2012 is reduced by SEK 150m, which is a result of interest costs and return on pension liabilities and -assets no longer being reported within operating income and that amortization of the actuarial losses no longer are used. Financing costs for the net pension liability are reported within the financial net which deteriorates by SEK 174m. Income for the period after tax declines by SEK 234m. The restatement has no impact on the cash flow. A short description of the amended standard is presented below. See also Note 1 in Electrolux Annual Report for 2012, www.electrolux.com/annualreport2012. The amended standard requires the present value of defined benefit obligations and the fair value of plan assets to be recognized in the financial statements as a net defined benefit liability. Following the amendment, the reported net defined benefit liability corresponds to the actual net obligations for pensions for Electrolux. As in the past, service costs are reported within operating income. Electrolux classifies the net pension obligation as a financial liability and report financing costs in the financial net. The discount rate is used to calculate the financing costs of the net pension obligation. The standard thereby removes the use of an expected return on the plan assets. Future changes in the net defined benefit liability as a result of, for example, adjustments to discount rates, mortality rates as well as return on plan assets deviating from the discount rate are presented in other comprehensive income as they occur. Accounting and valuation principles Electrolux applies International Financial Reporting Standards (IFRS) as adopted by the European Union. This report has been prepared in accordance with IAS 34, Interim Financial Reporting, and ÅRL, the Swedish Annual Accounts Act and recommendation RFR 2, Accounting for legal entities, issued by the Swedish Financial Reporting Board. There are no changes in the Group’s accounting and valuation principles compared with the accounting and valuation principles described in Note 1 of the Annual Report 2012. This report has not been audited.
- 12. 12 Consolidated results 2013 Consolidated income statement 2012 Income for the period attributable to: Equity holders of the Parent Company Non-controlling interests Total Total comprehensive income for the period attributable to: Equity holders of the Parent Company Non-controlling interests Total Earnings per share, SEK Diluted, SEK Number of shares after buy-backs, million Average number of shares after buy-backs, million Diluted, million 29,185 –22,970 6,215 –3,227 –1,402 4 –1,032 558 1.9 –196 362 1.2 –120 242 28,891 –23,187 5,704 –3,149 –1,350 18 –2,393 –1,170 –4.0 –152 –1,322 –4.6 335 –987 –917 51 1,851 –636 –653 –12 182 –160 1,215 –665 22 23 34 –1,532 –2 –69 41 –1,518 29 32 37 –71 –3 –1 92 –109 –4 –1,517 –5 –22 –2,343 22 –302 370 –670 –428 0 –987 2,362 3 2,365 671 1 672 241 1 242 –987 — –987 26 –4 22 374 –4 370 –427 –1 –428 –986 –1 –987 8.26 8.24 286.1 285.9 286.6 2.35 2.34 286.2 286.2 287.3 0.84 0.83 286.1 286.1 287.0 –3.44 –3.43 286.2 286.2 287.7 20131) Q4 2012 Q4 2013 -1,032 -594 -1,032 -512 – -975 – -975 – -1,032 Other comprehensive income, net of tax Total comprehensive income for the period 109,151 –87,892 21,259 –11,564 –5,646 6 –2,475 1,580 1.4 –676 904 0.8 –232 672 2012 Items that may be reclassified subsequently to income for the period: Available for sale instruments Cash flow hedges Exchange-rate differences on translation of foreign operations Income tax relating to items that may be reclassified Q4 2013 –1,477 Items that will not be reclassified to income for the period: Remeasurement of provisions for post-employment benefits Income tax relating to items that will not be reclassified Q4 2012 –866 Net sales Cost of goods sold Gross operating income Selling expenses Administrative expenses Other operating income/expenses Items affecting comparability Operating income Margin, % Financial items, net Income after financial items Margin, % Taxes Income for the period 2013 109,994 –87,807 22,187 –11,673 –5,541 59 –1,032 4,000 3.6 –846 3,154 2.9 –789 2,365 SEKm -906 -2,475 – -1,032 -906 -2,393 Items affecting comparability SEKm Restructuring provisions and write-downs Manufacturing footprint restructuring Program for reduction of overhead costs Impairment of ERP system Total 1) Of the total restructuring measures of SEK 2,5bn in 2013 approximately SEK 1,4bn will have a cash flow impact. Financial data quarterly and yearly can be downloaded and viewed at www.electrolux.com/ir. There is a graph section where you can view trends as well as compare financial items.
- 13. 13 Consolidated results 2013 Consolidated balance sheet SEKm Assets Property, plant and equipment Goodwill Other intangible assets Investments in associates Deferred tax assets Financial assets Pension plan assets Other non–current assets Total non–current assets Inventories Trade receivables Tax assets Derivatives Other current assets Short–term investments Cash and cash equivalents Total current assets Total assets Dec. 31, 2012 Dec. 31, 2013 16,693 5,541 5,079 16 4,156 333 286 481 32,585 12,963 18,288 609 184 3,607 123 6,835 42,609 75,194 17,264 4,875 4,011 221 4,385 279 445 752 32,232 12,154 19,441 746 268 4,405 148 6,607 43,769 76,001 1,545 2,905 –1,146 12,381 15,685 41 15,726 10,005 1,117 4,765 4,551 20,438 20,590 1,287 11,971 2,795 241 2,146 39,030 75,194 1,545 2,905 –2,658 12,482 14,274 34 14,308 11,935 1,026 3,425 4,522 20,908 20,607 1,331 12,886 2,733 194 3,034 40,785 76,001 1,610 1,458 Equity and liabilities Equity attributable to equity holders of the Parent Company Share capital Other paid–in capital Other reserves Retained earnings Total equity Non–controlling interests Total equity Long–term borrowings Deferred tax liabilities Provisions for post–employment benefits Other provisions Total non–current liabilities Accounts payable Tax liabilities Short–term liabilities Short–term borrowings Derivatives Other provisions Total current liabilities Total equity and liabilities Contingent liabilities Change in consolidated equity Dec. 31, 2012 Dec. 31, 2013 Opening balance Changes in accounting policy1) 20,644 –2,998 15,726 – Restated opening balance Total comprehensive income for the period Share–based payment Sale of shares Dividend Dividend to non–controlling interests Acquisition of operations Total transactions with equity holders Closing balance 17,646 22 –141 212 –1,860 — –153 –1,942 15,726 15,726 370 77 — –1,860 — –5 –1,788 14,308 SEKm 1) The effect of the amended standard for pension accounting, IAS 19 Employee Benefits, as of January 1, 2013.
- 14. 14 Consolidated results 2013 Consolidated cash flow statement 2012 2013 Q4 2012 Q4 2013 4,000 3,251 457 81 –673 –1,564 1,580 3,356 1,855 222 –540 –1,343 558 796 924 81 –223 –465 –1,170 876 2,141 –46 –122 –405 5,552 5,130 1,671 1,274 –1,710 –119 3,086 165 –1,932 609 993 –435 296 1,306 –974 –217 271 483 –417 722 1,528 7,080 –675 4,455 437 2,108 837 2,111 –164 –205 — –3 –4,090 –3,535 –1,275 –1,189 –477 –574 –442 –514 –180 –177 –95 –61 603 –4,702 –38 –4,734 282 –1,350 –51 –1,399 2,378 –279 758 712 Financing Change in short-term investments Change in short-term borrowings New long-term borrowings Amortization of long-term borrowings 206 –325 2,569 –3,063 –25 1,151 3,039 –1,851 366 148 1,512 –2,744 9 1,065 – –5 Dividend Sale of shares Cash flow from financing –1,868 212 –2,269 –1,860 — 454 — — –718 — — 1,069 109 175 40 1,781 6,966 6,835 6,836 4,971 –240 –403 –41 –145 6,835 6,607 6,835 6,607 SEKm Operations Operating income Depreciation and amortization Restructuring provisions Other non-cash items Financial items paid, net Taxes paid Cash flow from operations, excluding change in operating assets and liabilities Change in operating assets and liabilities Change in inventories Change in trade receivables Change in accounts payable Change in other operating assets, liabilities and provisions Cash flow from change in operating assets and liabilities Cash flow from operations Investments Acquisition of operations1) Capital expenditure in property, plant and equipment Capital expenditure in product development Capital expenditure in software Other2) Cash flow from investments Cash flow from operations and investments Total cash flow Cash and cash equivalents at beginning of period Exchange-rate differences referring to cash and cash equivalents Cash and cash equivalents at end of period 1) Includes the purchase and subsequent divestment of the Electrolux head-office building. Electrolux remaining investment in the real estate company is SEK 200m. 2) Includes grants related to investments of SEK 20m for Q4 of 2013 and SEK 222m for the full year of 2013.
- 15. 15 Consolidated results 2013 Key ratios 2012 2013 Q4 2012 Q4 2013 109,994 5.5 –1,032 4,000 3.6 3,154 2,365 109,151 4.5 –2,475 1,580 1.4 904 672 29,185 7.5 –1,032 558 1.9 362 242 28,891 3.6 –2,393 –1,170 –4.0 –1,322 –987 –4,090 4,779 8.26 54.96 4.1 14.8 14.4 10,164 0.65 –3,535 1,809 2.35 49.99 4.0 5.8 4.4 10,653 0.74 –1,275 1,446 0.84 — — — — — — –1,189 1,242 –3.44 — — — — — — 285.9 59,478 286.2 60,754 286.1 61,047 286.2 61,228 5,032 4.6 11.36 3.9 17.9 4,055 3.7 9.81 3.8 14.0 1,590 5.4 3.94 — — 1,223 4.2 3.80 — — SEKm unless otherwise stated Net sales Organic growth, % Items affecting comparability Operating income Margin, % Income after financial items Income for the period Capital expenditure, property, plant and equipment Operating cash flow Earnings per share, SEK1) Equity per share, SEK Capital–turnover rate, times/year Return on net assets, % Return on equity, % Net debt Net debt/equity ratio Average number of shares excluding shares owned by Electrolux, million Average number of employees Excluding items affecting comparability Operating income Margin, % Earnings per share, SEK¹) Capital–turnover rate, times/year Return on net assets, % 1) Basic, based on average number of shares, excluding shares owned by Electrolux. For definitions, see page 22. Shares Number of shares Number of shares as of January 1, 2013 Conversion of A–shares into B–shares Sale of shares Shares allotted to senior managers under the Performance Share Program Number of shares as of December 31 2013 , As % of total number of shares Outstanding A–shares Outstanding B–shares Outstanding shares, total Shares held by Electrolux Shares held by other shareholders 8,212,725 –20,186 — 300,707,583 20,186 — 308,920,308 — — 22,785,490 286,134,818 — — — 8,192,539 — 300,727,769 — 308,920,308 –77,169 22,708,321 7.4% 77,169 286,211,987 Exchange rates Dec. 31, 2012 Dec. 31, 2013 AUD, average 6.99 6.29 AUD, end of period 6.76 5.75 BRL, average 3.46 3.03 SEK BRL, end of period 3.19 2.76 CAD, average 6.74 6.32 CAD, end of period 6.55 6.04 EUR, average 8.70 8.67 EUR, end of period 8.58 8.91 10.69 10.23 GBP, average GBP, end of period 10.48 10.67 HUF, average 0.0300 0.0292 HUF, end of period 0.0295 0.0300 USD, average 6.73 6.52 USD, end of period 6.52 6.47
- 16. 16 Consolidated results 2013 Net sales by business area SEKm Major Appliances Europe, Middle East and Africa Major Appliances North America Major Appliances Latin America Major Appliances Asia/Pacific Small Appliances Professional Products Other Total 2012 2013 Q4 2012 Q4 2013 34,278 30,684 22,044 8,405 9,011 5,571 1 109,994 33,436 31,864 20,695 8,653 8,952 5,550 1 109,151 9,216 7,207 6,411 2,259 2,689 1,402 1 29,185 9,281 7,573 5,639 2,157 2,697 1,544 — 28,891 2012 2013 Q4 2012 Q4 2013 Operating income by business area SEKm Major Appliances Europe, Middle East and Africa Margin, % Major Appliances North America Margin, % Major Appliances Latin America Margin, % Major Appliances Asia/Pacific Margin, % Small Appliances Margin, % Professional Products Margin, % Common Group costs, etc. Total Group, excluding items affecting comparability Margin, % 1,105 3.2 1,452 4.7 1,590 7.2 746 8.9 461 5.1 588 10.6 –910 347 1.0 2,136 6.7 979 4.7 467 5.4 391 4.4 510 9.2 –775 335 3.6 337 4.7 657 10.2 211 9.3 219 8.1 155 11.1 –324 227 2.4 453 6.0 224 4.0 96 4.5 227 8.4 172 11.1 –176 5,032 4.6 4,055 3.7 1,590 5.4 1,223 4.2 Items affecting comparability Operating income Margin, % –1,032 4,000 3.6 –2,475 1,580 1.4 –1,032 558 1.9 –2,393 –1,170 –4.0 Change in net sales by business area Year–over–year, % 2013 2013 in comparable currencies Q4 2013 Q4 2013 in comparable currencies Major Appliances Europe, Middle East and Africa Major Appliances North America Major Appliances Latin America Major Appliances Asia/Pacific Small Appliances Professional Products Total change –2.5 3.8 –6.1 3.0 –0.7 –0.4 –0.8 –0.2 7.6 6.1 10.8 4.4 1.7 4.5 0.7 5.1 –12.0 –4.5 0.3 10.1 –1.0 1.1 7.6 0.4 4.3 4.8 10.6 3.6 Change in operating income by business area Year–over–year, % Major Appliances Europe, Middle East and Africa Major Appliances North America Major Appliances Latin America Major Appliances Asia/Pacific Small Appliances Professional Products Total change, excluding items affecting comparability 2013 2013 in comparable currencies Q4 2013 Q4 2013 in comparable currencies –68.6 47.1 –38.4 –37.4 –15.2 –13.3 –19.4 –68.7 52.1 –30.1 –32.3 –11.0 –11.8 –14.4 –32.2 34.4 –65.9 –54.5 3.7 11.0 –23.1 –31.6 49.3 –59.7 –49.6 11.3 11.7 –17.0
- 17. 17 Consolidated results 2013 Working capital and net assets SEKm Dec. 31, 2012 Inventories Trade receivables Accounts payable Provisions Prepaid and accrued income and expenses Taxes and other assets and liabilities Working capital Property, plant and equipment Goodwill Other non–current assets Deferred tax assets and liabilities Net assets Average net assets Average net assets, excluding items affecting comparability % of annualized net sales 12,963 18,288 –20,590 –6,697 –7,467 –3,002 –6,505 16,693 5,541 8,003 2,158 25,890 27,070 11.3 15.9 –17.9 28,112 Dec. 31, 2013 % of annualized net sales 10.6 17.0 –18.0 22.5 24.6 12,154 19,441 –20,607 –7,556 –7,933 –1,299 –5,800 17,264 4,875 5,263 3,359 24,961 27,148 25.6 28,915 26.5 –5.7 –5.1 21.8 24.9 Net assets by business area SEKm Major Appliances Europe, Middle East and Africa Major Appliances North America Major Appliances Latin America Major Appliances Asia/Pacific Small Appliances Professional Products Other1) Total operating assets and liabilities Liquid funds Interest-bearing receivables Interest-bearing liabilities Pension assets and liabilities Equity Total Assets Dec. 31, 2012 Dec. 31, 2013 22,800 12,106 13,337 4,933 4,528 2,664 7,137 22,936 12,886 12,875 4,866 4,756 2,720 7,285 67,505 7,403 — — 286 — 75,194 68,324 7,232 — — 445 — 76,001 1) Includes common functions, tax items and restructuring provisions. Equity and liabilities Dec. 31, 2012 Dec. 31, 2013 Net assets Dec. 31, 2012 Dec. 31, 2013 14,067 7,293 6,601 2,708 2,973 1,681 6,292 14,408 7,606 6,321 2,852 3,202 1,760 7,214 8,733 4,813 6,736 2,225 1,555 983 845 8,528 5,280 6,554 2,014 1,554 960 71 41,615 — — 13,088 4,765 15,726 75,194 43,363 — — 14,905 3,425 14,308 76,001 25,890 — — — — — — 24,961 — — — — — —
- 18. 18 Consolidated results 2013 Net sales and income per quarter SEKm Q1 2012 Q2 2012 Q3 2012 Q4 2012 Full year 2012 Q1 2013 Q2 2013 Q3 2013 Q4 2013 Full year 2013 Net sales Operating income Margin, % Operating income, excluding items affecting comparability Margin, % Income after financial items Income after financial items, excluding items affecting comparability Income for the period Earnings per share, SEK1) Earnings per share, SEK, excluding items affecting comparability1) 25,875 907 3.5 27,763 1,112 4.0 27,171 1,423 5.2 29,185 558 1.9 109,994 4,000 3.6 25,328 638 2.5 27,674 1,037 3.7 27,258 1,075 3.9 28,891 –1,170 –4.0 109,151 1,580 1.4 907 3.5 712 1,112 4.0 910 1,423 5.2 1,170 1,590 5.4 362 5,032 4.6 3,154 720 2.8 483 1,037 3.7 859 1,075 3.9 884 1,223 4.2 –1,322 4,055 3.7 904 712 499 1.76 910 701 2.44 1,170 923 3.22 1,394 242 0.84 4,186 2,365 8.26 565 361 1.26 859 642 2.24 884 656 2.29 1,071 –987 –3.44 3,379 672 2.35 1.76 2.44 3.22 3.94 11.36 1.48 2.24 2.29 3.80 9.81 — — — –1,032 –1,032 –82 — — –2,393 –2,475 286.1 286.1 286.1 286.1 286.1 286.2 286.2 286.2 286.2 286.2 285.4 286.1 286.1 286.1 285.9 286.2 286.2 286.2 286.2 286.2 Items affecting comparability2) Number of shares after buy-backs, million Average number of shares after buy-backs, million 1) Basic, based on average number of shares, excluding shares owned by Electrolux. 2) Restructuring provisions, write-downs and capital loss on divestments. Net sales and operating income by business area per quarter Q1 2012 Q2 2012 Q3 2012 Q4 2012 Full year 2012 Q1 2013 Q2 2013 Q3 2013 Q4 2013 Full year 2013 8,265 271 8,216 205 8,581 294 9,216 335 34,278 1,105 7,595 11 8,040 –2 8,520 111 9,281 227 33,436 347 3.3 2.5 3.4 3.6 3.2 0.1 0.0 1.3 2.4 1.0 7,107 131 1.8 8,599 488 5.7 7,771 496 6.4 7,207 337 4.7 30,684 1,452 4.7 7,678 457 6.0 8,448 663 7.8 8,165 563 6.9 7,573 453 6.0 31,864 2,136 6.7 Net sales Operating income Margin, % 5,149 278 5.4 5,183 316 6.1 5,301 339 6.4 6,411 657 10.2 22,044 1,590 7.2 4,885 251 5.1 5,472 261 4.8 4,699 243 5.2 5,639 224 4.0 20,695 979 4.7 Major Appliances Asia/Pacific Net sales Operating income Margin, % 1,841 155 8.4 2,198 172 7.8 2,107 208 9.9 2,259 211 9.3 8,405 746 8.9 1,948 106 5.4 2,227 148 6.6 2,321 117 5.0 2,157 96 4.5 8,653 467 5.4 Small Appliances Net sales Operating income Margin, % 2,105 93 4.4 2,105 25 1.2 2,112 124 5.9 2,689 219 8.1 9,011 461 5.1 2,020 17 0.8 2,104 50 2.4 2,131 97 4.6 2,697 227 8.4 8,952 391 4.4 Professional Products Net sales Operating income Margin, % 1,408 130 9.2 1,462 154 10.5 1,299 149 11.5 1,402 155 11.1 5,571 588 10.6 1,201 59 4.9 1,383 112 8.1 1,422 167 11.7 1,544 172 11.1 5,550 510 9.2 — –151 — –248 — –187 1 –324 1 –910 1 –181 — –195 — –223 — –176 1 –775 25,875 907 3.5 27,763 1,112 4.0 27,171 1,423 5.2 29,185 1,590 5.4 109,994 5,032 4.6 25,328 720 2.8 27,674 1,037 3.7 27,258 1,075 3.9 28,891 1,223 4.2 109,151 4,055 3.7 — — — –1,032 –1,032 –82 — — –2,393 –2,475 25,875 907 3.5 27,763 1,112 4.0 27,171 1,423 5.2 29,185 558 1.9 109,994 4,000 3.6 25,328 638 2.5 27,674 1,037 3.7 27,258 1,075 3.9 28,891 –1,170 –4.0 109,151 1,580 1.4 SEKm Major Appliances Europe, Middle East and Africa Net sales Operating income Margin, % Major Appliances North America Net sales Operating income Margin, % Major Appliances Latin America Other Net sales Operating income, common group costs, etc. Total Group, excluding items affecting comparability Net sales Operating income Margin, % Items affecting comparability Total Group Net sales Operating income Margin, %
- 19. 19 Consolidated results 2013 Fair value and carrying amount on financial assets and liabilities Full year 2012 Carrying Fair value amount SEKm Per category Financial assets at fair value through profit and loss Available-for-sale Loans and receivables Cash Total financial assets Financial liabilities at fair value through profit and loss Financial liabilities measured at amortized cost Total financial liabilities 1,853 229 20,406 3,493 25,981 241 33,524 33,765 Fair value estimation Valuation of financial instruments at fair value is done at the most accurate market prices available. Instruments which are quoted on the market, e.g., the major bond and interest-rate future markets, are all marked-to-market with the current price. The foreignexchange spot rate is used to convert the value into SEK. For instruments where no reliable price is available on the market, cash flows are discounted using the deposit/swap curve of the cash flow currency. If no proper cash flow schedule is available, e.g., as in the case with forward-rate agreements, the underlying schedule is used for valuation purposes. To the extent option instruments are used, the valuation is based on the Black Scholes’ formula. The carrying value less impairment 1,853 229 20,406 3,493 25,981 241 33,390 33,631 Q4 2013 Q4 2012 Fair value Carrying amount Fair value Carrying amount 1,853 229 20,406 3,493 25,981 241 33,524 33,765 1,853 229 20,406 3,493 25,981 241 33,390 33,631 2,021 160 20,664 3,871 26,716 171 35,405 35,576 2,021 160 20,664 3,871 26,716 171 35,275 35,446 provision of trade receivables and payables are assumed to approximate their fair values. The fair value of financial liabilities is estimated by discounting the future contractual cash flows at the current market-interest rate that is available to the Group for similar financial instruments. The Group’s financial assets and liabilities are measured according to the following hierarchy: Level 1: Quoted prices in active markets for identical assets or liabilities. Level 2: Inputs other than quoted prices included in Level 1 that are observable for assets or liabilities either directly or indirectly. Level 3: Inputs for the assets or liabilities that are not entirely based on observable market data. Fair value measurement hierarchy Full year 2012 Financial assets, SEKm Financial assets Financial assets at fair value through profit and loss Available for sale Derivatives Derivatives for which hedge accounting is not applied, i.e., held for trading Derivatives for which hedge accounting is applied Short-term investments and cash equivalents Financial assets at fair value through profit and loss Total financial assets Financial liabilities Derivatives Derivatives for which hedge accounting is not applied, i.e., held for trading Derivatives for which hedge accounting is applied Total financial liabilities Q4 2013 Q4 2012 Level 1 Level 2 Total Level 1 Level 2 Total Level 1 Level 2 Total 552 323 229 — — — — 183 552 323 229 183 552 323 229 — — — — 183 552 323 229 183 279 119 160 — — — — 241 279 119 160 241 — — 1,347 1,347 1,899 12 171 — — 183 12 171 1,347 1,347 2,082 — — 1,347 1,347 1,899 12 171 — — 183 12 171 1,347 1,347 2,082 — — 1,661 1,661 1,940 93 148 — — 241 93 148 1,661 1,661 2,181 — 241 241 — 241 241 — 171 171 — — — 95 146 241 95 146 241 — — — 95 146 241 95 146 241 — — — 78 93 171 78 93 171 The Group strives for arranging master-netting agreements (ISDA) with the counterparts for derivative transactions and has established such agreements with the majority of the counterparts, i.e., if a counterparty will default, assets and liabilities will be netted. Derivatives are presented gross in the balance sheet. The disclosure of this information in the interim report is a consequence of updated disclosure requirements in IAS 34 Interim Financial Reporting. The information was earlier provided yearly in the notes to the financial statements in the Annual Report.
- 20. 20 Consolidated results 2013 Parent Company income statement 2012 2013 Q4 2012 Q4 2013 6,125 –4,638 1,487 –1,297 –469 293 –38 –24 1,918 –946 28,856 –25,382 3,474 –3,783 –1,196 9 –1,874 –3,370 2,335 –826 1,676 –1,377 299 –415 –205 122 –37 –236 435 –453 7,899 –7,197 702 –1,170 –71 — –1,865 –2,404 399 –265 972 948 180 1,128 –9 1,119 1,509 –1,861 187 –1,674 765 –909 –18 –254 47 –207 46 –161 134 –2,270 105 –2,165 813 –1,352 SEKm Net sales Cost of goods sold Gross operating income Selling expenses Administrative expenses Other operating income Other operating expenses Operating income Financial income Financial expenses Financial items, net Income after financial items Appropriations Income before taxes Taxes Income for the period Parent Company balance sheet Dec. 31, 2012 Dec. 31, 2013 Assets Non–current assets Current assets Total assets 33,436 16,008 49,444 33,001 22,027 55,028 Equity and liabilities Restricted equity Non–restricted equity Total equity Untaxed reserves Provisions Non–current liabilities Current liabilities Total equity and liabilities 4,562 15,269 19,831 581 1,097 9,573 18,362 49,444 4,562 12,531 17,093 558 1,843 11,472 24,062 55,028 — 1,692 — 1,815 SEKm Pledged assets Contingent liabilities
- 21. 21 Consolidated results 2013 Operations by business area yearly SEKm 2009 2010 2011 2012 2013 Major Appliances Europe, Middle East and Africa Net sales Operating income Margin, % 40,500 1,912 4.7 36,596 2,297 6.3 34,029 709 2.1 34,278 1,105 3.2 33,436 347 1.0 Major Appliances North America Net sales Operating income Margin, % 32,694 1,299 4.0 30,969 1,442 4.7 27,665 250 0.9 30,684 1,452 4.7 31,864 2,136 6.7 Major Appliances Latin America Net sales Operating income Margin, % 13,302 809 6.1 16,260 951 5.8 17,810 820 4.6 22,044 1,590 7.2 20,695 979 4.7 Major Appliances Asia/Pacific Net sales Operating income Margin, % 7,037 378 5.4 7,679 793 10.3 7,852 736 9.4 8,405 746 8.9 8,653 467 5.4 Small Appliances Net sales Operating income Margin, % 8,464 763 9.0 8,422 802 9.5 8,359 543 6.5 9,011 461 5.1 8,952 391 4.4 Professional Products Net sales Operating income Margin, % 7,129 668 9.4 6,389 743 11.6 5,882 841 14.3 5,571 588 10.6 5,550 510 9.2 Other Net sales Operating income, common Group costs, etc. 6 –507 11 –534 1 –744 1 –910 1 –775 Total Group, excluding items affecting comparability Net sales Operating income Margin, % Items affecting comparability 109,132 5,322 4.9 –1,561 106,326 6,494 6.1 –1,064 101,598 3,155 3.1 –138 109,994 5,032 4.6 –1,032 109,151 4,055 3.7 –2,475 Total Group, including items affecting comparability Net sales Operating income Margin, % 109,132 3,761 3.4 106,326 5,430 5.1 101,598 3,017 3.0 109,994 4,000 3.6 109,151 1,580 1.4 Electrolux applies the amended standard for pension accounting, IAS 19 Employee Benefits, as of January 1, 2013, see page 11. Reported figures for 2012 have been restated to enable comparison. Reported figures for previous years have not been restated.
- 22. 22 Consolidated results 2013 Five-year review SEKm unless otherwise stated Net sales Organic growth, % Items affecting comparability Operating income Margin, % Income after financial items Income for the period Capital expenditure, property, plant and equipment Operating cash flow Earnings per share, SEK Equity per share, SEK Dividend per share, SEK Capital-turnover rate, times/year Return on net assets, % Return on equity, % Net debt Net debt/equity ratio Average number of shares excluding shares owned by Electrolux, million Average number of employees 1) Proposed by the board. Excluding items affecting comparability Operating income Margin, % Earnings per share, SEK Capital-turnover rate, times/year Return on net assets, % 2009 2010 2011 2012 2013 109,132 –4.8 –1,561 3,761 3.4 3,484 2,607 2,223 6,603 9.18 66 4.00 5.6 19.4 106,326 1.5 –1,064 5,430 5.1 5,306 3,997 3,221 4,587 14.04 72 6.50 5.4 27.8 101,598 0.2 –138 3,017 3.0 2,780 2,064 3,163 2,745 7.25 73 6.50 4.6 13.7 109,994 5.5 –1,032 4,000 3.6 3,154 2,365 4,090 4,779 8.26 55 6.50 4.1 14.8 109,151 4.5 –2,475 1,580 1.4 904 672 –3,535 1,809 2.35 50 6.501) 4.0 5.8 14.9 665 0.04 20.6 –709 –0.03 10.4 6,367 0.31 14.4 10,164 0.65 4.4 10,653 0.74 284.0 50,633 284.6 51,544 284.7 52,916 285.9 59,478 286.2 60,754 5,322 4.9 13.56 5.4 26.2 6,494 6.1 16.65 5.1 31.0 3,155 3.1 7.55 4.3 13.5 5,032 4.6 11.36 3.9 17.9 4,055 3.7 9.81 3.8 14.0 Financial goals over a business cycle The financial goals set by Electrolux aim to strengthen the Group’s leading, global position in the industry and assist in generating a healthy total yield for Electrolux shareholders. The objective is growth with consistent profitability. The key ratios exclude items affecting comparability. Definitions Capital indicators Annualized sales In computation of key ratios where capital is related to net sales, the latter are annualized and converted at year-end-exchange rates and adjusted for acquired and divested operations. Net assets Total assets exclusive of liquid funds, pension plan assets and i nterest-bearing financial receivables less operating liabilities, noninterest-bearing provisions and deferred tax liabilities. Working capital Current assets exclusive of liquid funds and interest-bearing financial receivables less operating liabilities and non-interest-bearing provisions. Total borrowings Total borrowings consist of interest-bearing liabilities, fair-value derivatives, accrued interest expenses and prepaid interest income, and trade receivables with recourse. Net debt Total borrowings less liquid funds. Net debt/equity ratio Net borrowings in relation to equity. Financial goals • Operating margin of 6% • Capital-turnover rate 4 times • Return on net assets 20% • Average annual growth 4% Equity/assets ratio Equity as a percentage of total assets less liquid funds. Other key ratios Organic growth Sales growth, adjusted for acquisitions, divestments and changes in exchange rates. Operating cash flow Cash flow from operations and investments excluding financial items paid, taxes paid and acquisitions and divestment of operations. Earnings per share Income for the period divided by the average number of shares after buy-backs. Operating margin Operating income expressed as a percentage of net sales. Return on equity Income for the period expressed as a percentage of average equity. Return on net assets Operating income expressed as a percentage of average net assets. Capital-turnover rate Net sales in relation to average net assets.
- 23. 23 Consolidated results 2013 President and CEO Keith McLoughlin’s omments on the c fourth-quarter results 2013 Today’s press release is available on the Electrolux website http://www.electrolux.com/ir Telephone conference A telephone conference is held at 9.00 CET on Friday, January 31, 2014. The conference is chaired by Keith McLoughlin, President and CEO of Electrolux. Mr. McLoughlin is accompanied by Tomas Eliasson, CFO. A slide presentation on the fourh-quarter results of 2013 will be available on the Electrolux website http://www.electrolux.com/ir Details for participation by telephone are as follows: Participants in Sweden should call +46 8 505 564 74 Participants in UK/Europe should call +44 203 364 5374 Participants in US should call +1 855 753 2230 Calender 2014 Financial reports 2014 Interim report January – March April 25 Interim report January – June July 18 Interim report January – September October 20 Annual Report 2013 You can also listen to the presentation at http://www.electrolux.com/interim-report-webcast For further information Investor Relations and Financial Information: +46 (0)8 738 60 03. Available at the Group’s website Week 10 Annual General Meeting 2014 Electrolux Annual General Meeting 2014 will be held on March 26 at the Stockholm Waterfront Congress Centre, situated at Nils Ericsons Plan 4 in Stockholm, Sweden. Financial information from Electrolux is available at http://www.electrolux.com/ir Factors affecting forward-looking statements This report contains “forward-looking” statements within the meaning of the US Private Securities Litigation Reform Act of 1995. Such statements include, among others, the financial goals and targets of Electrolux for future periods and future business and financial plans. These statements are based on current expectations and are subject to risks and uncertainties that could cause actual results to differ materially due to a variety of factors. These factors include, but may not be limited to the following; consumer demand and market conditions in the geographical areas and industries in which Electrolux operates, effects of currency fluctuations, competitive pressures to reduce prices, significant loss of business from major retailers, the success in developing new products and marketing initiatives, developments in product liability litigation, progress in achieving operational and capital efficiency goals, the success in identifying growth opportunities and acquisition candidates and the integration of these opportunities with existing businesses, progress in achieving structural and supply-chain reorganization goals. Electrolux discloses the information provided herein pursuant to the Securities Market Act and/or the Financial Instruments Trading Act. The information was submitted for publication at 08.00 CET on January 31, 2014. AB ELECTROLUX (PUBL) Postal address SE-105 45 Stockholm, Sweden Visiting address S:t Göransgatan 143 Media hotline +46 8 657 65 07 Telefax +46 8 738 74 61 Investor Relations +46 8 738 60 03 Website www.electrolux.com/ir E-mail ir@electrolux.se Reg. No. 556009-4178