Recommended

Recommended
More Related Content
What's hot
What's hot (11)
Similar to Tamaota @ Impacts World 2017
Similar to Tamaota @ Impacts World 2017 (20)
Recently uploaded
Recently uploaded (20)
Tamaota @ Impacts World 2017
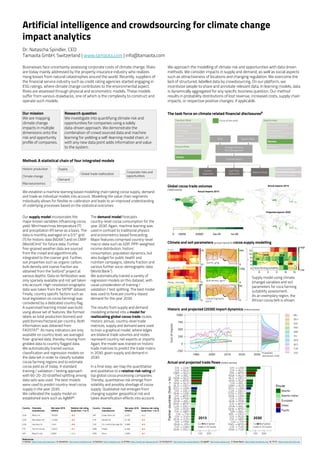
- 1. Artificial intelligence and crowdsourcing for climate change impact analytics Businesses face uncertainty assessing corporate costs of climate change. Risks are today mainly addressed by the property insurance industry who realizes rising losses from natural catastrophes around the world. Recently, suppliers of the financial service industry such as credit rating agencies started engaging in ESG ratings, where climate change contributes to the environmental aspect. Risks are assessed through physical and econometric models. These models suffer from various drawbacks, one of which is the complexity to construct and operate such models. Our mission We are mapping climate change impacts in multiple dimensions onto the risk and opportunity profile of companies. Research question We investigate into quantifying climate risk and opportunities for companies using a solely data-driven approach. We demonstrate the combination of crowd sourced data and machine learning for yielding a self-learning model chain, in with any new data point adds information and value to the system. The task force on climate related financial disclosures8 Method: A statistical chain of four integrated models Dr. Natascha Spindler, CEO Tamaota GmbH, Switzerland | www.tamaota.com | info@tamaota.com References: 1) NOAA: https://www.esrl.noaa.gov/, 2) WorldClim: http://www.worldclim.org/, 3) SoilGrid: https://soilgrids.org, 4) STRM: https://www2.jpl.nasa.gov/srtm/, 5) FAOSaTAT: http://www.fao.org/faostat/en/, 6) AgMIP: http://www.agmip.org/, 7) World Bank: https://data.worldbank.org/, 8) TFCF: https://www.fsb-tcfd.org/ Global trade reallocation Demand SupplyHistoric production Climate change Macroeconomics Country Chocolate manufacturer Net sales 2016 (USDm) Relative risk rating (scale from -1 to 1) USA Mars, Inc. 18,000 -0.5 USA Mondelez Intl’ 12,900 -0.5 USA Hershey Co 7,461 -0.6 ITA Ferrero Group 10,637 -0.1 JAP Mejij Co Ltd 9,850 +0.3 Revenues Expenditures Assets & Liabilities Capital & Financing Physical Risks Acute Chronic Transition Risks Policy and Legal Technology Market Reputation Opportunities Resource Efficiency Energy Source Products/Service Markets Resilience Income Statement Balance Sheet OpportunitiesRisks Strategic Planning Risk Management Financial Impact Cash Flow Statement Corporate risks and opportunities We establish a machine learning based modelling chain taking cocoa supply, demand and trade as individual models into account. Modelling the value chain segments individually allows for flexible re-calibration and leads to an improved understanding of underlying processes based on the statistical outcomes. Our supply model incorporates the major known variables influencing cocoa yield. Min/mean/max temperature (T) and precipitation (P) serve as a basis. The data is monthly averaged on a 0.5° grid (T) for historic data (NOAA1 ) and on CMIP (WorldClim)2 for future data. Further fine-grained weather data are sourced from the crowd and algorithmically integrated to the coarser grid. Further, soil properties such as organic carbon, bulk density and coarse fraction are obtained from the SoilGrid3 project at various depths. Data on fertilization was only sparsely available and not yet taken into account. High-resolution orographic data was taken from the SRTM4 dataset. Finally, country specific factors such as local legislation on cocoa farming) was considered by a dedicated country flag. A supervised learning model was build, using above set of features. We formed labels as total production (tonnes) and yield (tonnes/hectare) per country. Both information was obtained from FAOSTAT5 . As many indicators are only available on country level, we averaged finer-grained data, thereby moving from gridded data to country flagged data. We automatically trained various classification and regression models on the data set in order to classify suitable cocoa farming regions and to estimate cocoa yield as of today. A standard training / validation / testing approach with 60-20-20 stratified splitting among data sets was used. The best models were used to predict country-level cocoa supply in the year 2030. We calibrated the supply model on established work such as AgMIP6 . The demand model forecasts country-level cocoa consumption for the year 2030. Again, machine learning was used in contrast to traditional physics and econometrics based forecasting. Major features comprised country-level macro-data such as GDP, PPP-weighted income distribution, historic consumption, population dynamics, but also budget for public health and nutrition campaigns, obesity fraction and various further socio-demographic data (World Bank7 ). We automatically trained a variety of regression models on this dataset, with usual consideration of training / validation / test splitting. The best model was used to forecast country-based demand for the year 2030. The results from supply and demand modelling entered into a model for reallocating global cocoa trade routes. Historic annual, country-level trade matrices, supply and demand were used to train a graphical model, where edges are bilateral trade volumes and nodes represent country net exports or imports. Again, the model was trained on historic trade matrices to predict the trade matrix in 2030, given supply and demand in 2030. In a final step, we map the quantitative and qualitative to a relative risk rating of top global cocoa processing companies. Thereby, quantitative risk emerge from volatility and possibly shortage of cocoa supply. Qualitative risk emerges from changing supplier geopolitical risk and takes diversification effects into account. We approach the modelling of climate risk and opportunities with data driven methods. We consider impacts in supply and demand, as well as social aspects such as attractiveness of locations and changing regulation. We overcome the lack of structured, labelled data by crowdsourcing. On our platform, we incentivize people to share and annotate relevant data. In learning models, data is dynamically aggregated for any specific business question. Our method results in probability distributions of lost revenue, increased costs, supply chain impacts, or respective positive changes, if applicable. Country Chocolate manufacturer Net sales 2016 (USDm) Relative risk rating (scale from -1 to 1) JAP Ezaki Glico Ltd 3,437 +0.2 CHF Nestlé SA 9,138 -0.2 CHF Ch. Lindt & Sprüngli AG 3,968 -0.3 GBR Pladis 5,200 -0.2 ARG Arcor 2,900 -0.1 Global cocoa trade volumes (1000 tonnes) 25 Projected exports 2030 Actual exports 2013 Actual imports 2013 21 Climate and soil parameters (annual means) for cocoa supply modelling 1 0 8 0 0 400 1500 0 60 0 Bulk density, kg/m3 T (°C) 30 a ∆T (°C) Precip., mm/day Soil OC, g/kg Coarse fragments, Vol-% Supply model using climate (change) variables and soil parameters for coca farming suitability assessment. As an exemplary region, the African cocoa belt is shown. Sumofimports 1000 750 500 250 0 -250 BEL DEU ESP FRA GBR ITA MYS NLD TUR USA Historic and projected (2030) import dynamics (million tonnes) Actual and projected trade flows (million tonnes) Ca 70 % of global trade in 25 routes Ca 60 % of global trade in 25 routes Focus of this work 2013 2030 High Low 100-5 5 2 4 6 8 10 12 15 Cocoa farming suitability GHA NGA CMR CIV Probability distribution 2030 1990 2000 2010 2020 2030