SlideShare a Scribd company logo
1 of 4
Download to read offline
Issue No.34
Department of Census & Statistics
ISSN 1391- 3050
Additional Bulletin of Labour Force
Statistics in Sri Lanka
Bulletin of the first quarter 2006 Sri Lanka Labour Force Survey has already been published with the
information on employment, unemployment and labour force in Sri Lanka, with detailed tabulations
on some selected variables.
However, some improvements were made to the Labour Force Survey schedule in order to fulfill the
requirements of it's users and also to provide additional information for the national planning
purposes. This revision was made focusing on literacy, household economic activities, informal sector
employment, Informal employment and under employment etc. Therefore, this is an attempt to
analyze information on newly added topics, which are mentioned above, with some important
classifications. However, it should be noted that, the key findings from these newly added topics,
especially on the “informal economy” are being presented in this additional bulletin. This provides a
statistical picture of the “Informal sector” in Sri Lanka. It is only a beginning however, more work is
needed in developing methods for the collection of data on the “informal economy”.
Literacy
Based on the expert discussions regarding the
revision of the System of National Accounts
(SNA) boundary, it was agreed that carrying
water, bringing firewood for their own
consumption and construction and major
repairs or alternations of dwelling and farm
buildings, undertaken by owners should be
included within the production boundary. As
such, some questions were included in the
Labour Force schedule in order to get the
information on time spend on these specific
household activities.
On the other hand it was observed that, this
scenario depends on the country’s situation
and therefore, in Sri Lanka, persons who are
engaging only on these specific activities were
not considered to be included in the labour
force. However, detailed analysis was done to
see a clear picture on this, and alternative
estimates are provided by including persons
who are engaged in household activities
spending 15 hours or more per week, in the
labour force.
In order to provide information for educational
planners, especially in developing countries,
literacy is an important variable regarding the
issues such as improvement of the educational
system, increasing the educational related
programs etc.
It should be noted that , so far, information
relating to literacy was collected only from the
Census which is generally conducted once in
10 years time.
As labour force surveys are often conducted at
a higher frequency than the other surveys, it
was decided to include the questions on
literacy in order to provide quarterly estimates
for the data users and for the policy makers.
Household Activities
Literacy, Household Economic Activities,
Informal Sector Employment and Underemployment
FemaleMale
89.8
Sex
93.191.4
91.094.091.4
RuralUrban
SectorSri
Lanka
Table 1 :Literacy rate by sex and sector
First Quarter, 2006
Situation in the
urban sector, in
relation to literacy,
is slightly better as
compared with the
rural sector. Also,
literacy rate of
males is relatively
high when
compared with that
of females.
Table 2 : Time spend on household activities
First Quarter, 2006
1. Bringing Firewood, 2. Bringing water from outside,
3. Engaging in a repairing work in own house or
building.
Household
No. % No. % No. %
Total 1629660 100.0 1390898 85.3 238762 14.7
1 924961 100.0 824171 89.1 100790 10.9
2 651341 100.0 529755 81.3 121586 18.7
3 53358 100.0 36972 69.3 16386 30.7
Time spend (Hrs per week)
Activity
Total 0 - 9 10+
2
Informal Sector
The Informal Sector represents an important part of the
economy and the labour market in many countries,
especially developing countries; thus, measurement of
the informal sector is important in their own right as
well as contributing towards exhaustive estimates of
GDP. Further informal sector plays a major role in
employment creation, production and income
generation.
Since its first appearance in the early 1970’s the term
“informal sector” has become so popular and nowadays
it is used with different meanings for different purposes.
Originally it referred to a concept for data analysis and
policy making. Now it’s sometimes used in a much
broader sense to refer to a concept for the collection of
data on activities not covered by the existing,
conventional source of statistics.
A review of national statistical definitions of the informal
sector shows that presently they do not always fully
correspond to the international definition adopted by the
15th International Conference of Labour Statisticians (15th
ICLC) and the System of National Accounts (SNA) 1993.
However, the international comparability of data on the
informal sector is affected by national differences in data
sources, in the geographical coverage of surveys, in the
branches of economic activity covered etc. Therefore,
criteria which is to define the informal sector vary among
countries. However, most of the countries tends to collect
informal sector information , especially those using
labour force or other household surveys for the
measurement of employment in the informal sector,
were advised by the experts that use the criteria of
registration of the organization, accounts keeping
system and size of their organization.
In such situation, Department of Census and Statistics
observed the necessity of having informal sector
information, and therefore, after carefully reviewing of
LFS schedule with the assistance of ESCAP advisor,
relevant questions were included in the LFS schedule to
collect the information relating to the informal sector on
the following items.
1. Registration of the organization
2. Accounts keeping practices of the
Organization
3. Total number of regular employees of the
organization
Formal
37%
Informal
63%
Informal
84%
Formal
16%
Formal
47%Informal
53%
Table 5 : Employment by economic sector by sex
First Quarter, 2006
Figure 1 : Distribution Informal /Formal
employment by Agriculture/non-agriculture sectors
First Quarter, 2006
Table 4: Composition of employment by economic sector
First Quarter, 2006
7221231 *
7081435
Employed
92.87627761
93.2 *7745653*
Employment
rate (%)
Total labour
force
Table 3: Alternative estimates for employment rate
First Quarter, 2006
* By including persons who are engaged in household
activities spending 15 hours or more per week , as to be
employed.
Agriculture sector Non - Agriculture sector
All Island
Sex
No. % No. % No. %
Total 7081435 100.0 2586195 100.0 4495240 100.0
Male 4634156 65.4 1545772 59.8 3088383 68.7
Female 2447279 34.6 1040423 40.2 1406857 31.3
Total Formal Informal
Sector
Figure 1 shows that, in Sri Lanka 63% of the total
employment is in the informal sector. It is also
revealed that, in Sri Lanka, Agriculture sector
comprises 84 percent of informal sector
employment and the balance 16 percent is formal
sector employment. This relatively high percentage
of formal sector employment (16 percent) in the
agriculture sector, may be due to the reason that,
there are some plantation workers, who are
working in estates, which are managed by the
government owned large plantation companies.
No. % No. % No. %
Total employment 7081435 100.0 2586195 36.5 4495240 63.5
Total non-
agricultural 4735114 100.0 2216877 46.8 2518237 53.2
employment
Total agricultural 2346321 100.0 369318 15.7 1977003 84.3
employment
Total Formal sector Informal sector
Table 6 : Employment by level of education and by economic sector
First Quarter, 2006
Level of
education
No. % No. % No. %
Below Gr. 5 332858 21.3 1231830 78.7 1564688 100.0
Gr. 5 - 9 926416 27.7 2421398 72.3 3347814 100.0
G.C.E.(O/L) 582653 49.0 606646 51.0 1189299 100.0
G.C.E.(A/L) & above 744267 76.0 235366 24.0 979634 100.0
Total 2586195 36.5 4495240 63.5 7081435 100.0
Formal Informal Total
Sector As shown as table 6, it is clearly revealed that,
employment in the formal sector is more
contributed a higher level of education while it
is the opposite for informal sector employment.
Table 8 : Average monthly *Salary (per month)
of the employees by economic sector
First Quarter , 2006
* Including, income in kind
3
Superiority of (i) non-agricultural sector as
compared to agricultural sector and (ii) formal
sector as compared to informal sector, in terms
of average income, is clearly evidenced in table
8 above.
Table 9: Distribution of employed population by their
main occupation and economic sector- First Quarter, 2006
Looking at the occupational breakdown of
formal sector and informal sector employment,
it is obvious that regarding skilled agricultural
and fishery workers, only 2 percent belongs to
the formal sector. Again by economic sector,
outside of “agriculture” occupation group, “
Craft and related workers”, “Plant and machine
operators and assemblers”, “ Elementary
occupations” groups are seem to be more
important in informal sector than formal sector.
1 Senior Officials and Managers 7 Skilled Agricultural and Fishery workers
2 Professionals 8 Craft and Related workers
3 Technical and Associate Professionals 9 Plant and Machine operators and Assemblers
4 Clerks 10 Elementary occupations
5 Proprietors and Managers of Enterprises 0 Unidentified
6 Sales and Service workers
Occupation group
Occupation
No. % No. % No. %
1 * * 124707 100.0
2 277076 82.6 58501 17.4 335577 100.0
3 339664 86.4 53687 13.6 393351 100.0
4 234860 86.8 35699 13.2 270559 100.0
5 141893 25.9 406749 74.1 548642 100.0
6 204792 39.1 318726 60.9 523518 100.0
7 29540 1.8 1587526 98.2 1617066 100.0
8 374703 31.3 823845 68.7 1198548 100.0
9 185344 40.0 277975 60.0 463319 100.0
10 642742 40.9 927544 59.1 1570286 100.0
0 * * * * 35861 100.0
Total 2586195 36.5 4495240 63.5 7081435 100.0
Total
Formal Informal
Sector
* Cell size is not adequate to provide reliable estimates.
Formal Informal
Agriculture 4061 3846 3948
Non - agriculture 11167 5738 9120
Total 10136 5287 8174
Sector
Industry Total
Status in
Employment No. % No. % No. %
Regular Employees 2341472 90.5 1576430 35.1 3917902 55.3
Employer 82390 3.2 140938 3.1 223331 3.2
Own account worker 129304 5.0 2107624 46.9 2236933 31.6
Unpaid family worker 33030 1.3 670247 14.9 703278 9.9
Total 2586195 100.0 4495240 100.0 7081435 100.0
Formal sector Informal sector Total
Regarding the different status of employment, it's noticeable
that, 47 percent of the total informal sector employment are
own account workers while, 91 percent of formal sector
employment are regular employees.
Table 7: Distribution of employment by employment status
and by economic sector- First Quarter, 2006
Regular
Employees
35%
Employer
3%
Own
account
worker
47%
Unpaid
family
worker
15%
Figure 2: Distribution of informal sector employment by
employment status and by economic sector -
First Quarter, 2006
(Rs)
Criteria for classification of underemployment
Underemployment has particular relevance in developing
countries, notably in connection with agriculture. It has
been observed that measurement of underemployment has
mostly been recommended for describing the employment
situation in developing countries.
In order to classify an employed persons as visibly
underemployed,
(i) If the person has worked less than the normal
duration in his/her main activity
In Sri Lanka scenario, 35 hours per week is taken as
the cut-off point applicable to all workers, except
government teachers, as in practice, though teachers
do have a normal duration of work which is below the
general cut-off point, they should be on a full time
schedule according to the nature of their job. Further,
those who do have a secondary job, or those who are
employers, were considered as having worked the
normal duration in their respective activity.
Therefore, if the person has worked less than the
normal duration in his/her activity (as described
above), then the person is further questioned to
ascertain whether he/She is prepared and available for
further work if provided. Such persons are considered
underemployed in their respective employment.
(ii) If the person has worked more than the normal
duration in his/her activity
If the person has worked even more than 35 hours as
usually, but he has worked less than 35 hours actually
in the reference period, only due to the off season or
bad weather, such persons were also further
questioned to check their underemployment situation,
considering them as a special category.
4.4Non-Agriculture
5.9Total
8.9Agriculture
RateSector
Table 10 : Underemployment rate by
Agriculture/Non-agriculture sector,
First Quarter, 2006
7.05.35.9Total
6.53.84.8O/L and above
7.56.16.6Gr 5-9
5.9
Total
FemaleMale
6.75.4Below 5
SexEducational
qualification
Table 11: Underemployment rates by educational level
and the sex - First Quarter, 2006
Figure 3 : Underemployment rate by sector
First Quarter, 2006
Agriculture,
8.9
Non-
Agriculture,
4.4
0
2
4
6
8
10
sector
Underemploymentrate
The importance of the concept of Under-employment has
long been recognized. At the international level, the
concept was accepted at the Sixth International Conference
of Labour Statisticians ICLS (1948). According to the 1966
ICLS resolution, “underemployment” exists when a
person’s employment is inadequate, in relation to specified
norms or alternative employment, account being taken of
his occupational skill (training and working experience)”.
Two principal forms of under-employment are
distinguished: visible underemployment and invisible
under-employment. Visible under-employment, reflecting
an insufficiency in the volume of employment, and
invisible under-employment, characterized by low income,
under utilization of skill, low productivity and other
factors. The 1982 ICLS resolution recognized, however, that
“for operational reasons the statistical measurement of of
underemployment may be limited to visible
underemployment”. It refined the definition and
introduced an approach to combine the measurement of
visible underemployment with that of unemployment.
Underemployment
4
As can be seen from table 10,
underemployment rate has shown a marked
difference between agricultural and non-
agricultural sectors showing the respective
rates as 8.9 and 4.4 . It is also noted that, there
is no distinguish differences of
underemployment rates among the people
those who have different educational
qualifications.
Department of Census & Statistics, 15/12, Maitland Crescent, Colombo 7
Telephone 2695291, Fax 94-11-2697594, Email :sample.survey @ statistics.gov.lk
Web address: www.statistics.gov.lk
Applying above mentioned criteria, an attempt has
been made to estimate under-employment and it is
estimated that, “underemployment rate” which is
defined as the number of underemployed persons
as a percentage of employed persons, is 5.9 percent.

More Related Content

What's hot

The Challenge of Employment in India - An Informal Economy Perspective - Vol. I
The Challenge of Employment in India  - An Informal Economy Perspective - Vol. IThe Challenge of Employment in India  - An Informal Economy Perspective - Vol. I
The Challenge of Employment in India - An Informal Economy Perspective - Vol. IPeople's Archive of Rural India
 
Report of the committee on unorganised sector statistics
Report of the committee on unorganised sector statisticsReport of the committee on unorganised sector statistics
Report of the committee on unorganised sector statisticsPeople's Archive of Rural India
 
Employment generation in india - an outlook
Employment generation in india - an outlookEmployment generation in india - an outlook
Employment generation in india - an outlookVishnu Raj
 
Productivity challenges in Singapore - Part 2 23062015
Productivity challenges in Singapore - Part 2 23062015Productivity challenges in Singapore - Part 2 23062015
Productivity challenges in Singapore - Part 2 23062015Hawyee Auyong
 
TeamLease Employment Outlook Survey - Report Preview
TeamLease Employment Outlook Survey - Report PreviewTeamLease Employment Outlook Survey - Report Preview
TeamLease Employment Outlook Survey - Report Previewvaluvox
 
Job less growth
Job less growthJob less growth
Job less growthAmarwaha
 
Final_project_report_67_Sri
Final_project_report_67_SriFinal_project_report_67_Sri
Final_project_report_67_SriSrimoyee Bose
 
The TeamLease Employment Outlook Report: July-September 2011
The TeamLease Employment Outlook Report: July-September 2011The TeamLease Employment Outlook Report: July-September 2011
The TeamLease Employment Outlook Report: July-September 2011valuvox
 
Productivity challenges in Singapore - Part 4 02062015
Productivity challenges in Singapore - Part 4 02062015Productivity challenges in Singapore - Part 4 02062015
Productivity challenges in Singapore - Part 4 02062015Hawyee Auyong
 
Budget 2018-19 and its Impact on the India Economy: An Industrial Slant
Budget 2018-19 and its Impact on the India Economy: An Industrial SlantBudget 2018-19 and its Impact on the India Economy: An Industrial Slant
Budget 2018-19 and its Impact on the India Economy: An Industrial SlantNIPFP Publications
 

What's hot (18)

MPI concept3
MPI concept3MPI concept3
MPI concept3
 
The Challenge of Employment in India - An Informal Economy Perspective - Vol. I
The Challenge of Employment in India  - An Informal Economy Perspective - Vol. IThe Challenge of Employment in India  - An Informal Economy Perspective - Vol. I
The Challenge of Employment in India - An Informal Economy Perspective - Vol. I
 
Report of the committee on unorganised sector statistics
Report of the committee on unorganised sector statisticsReport of the committee on unorganised sector statistics
Report of the committee on unorganised sector statistics
 
Lmi Demystify62910
Lmi Demystify62910Lmi Demystify62910
Lmi Demystify62910
 
Joblessness informalization in_india
Joblessness informalization in_indiaJoblessness informalization in_india
Joblessness informalization in_india
 
Employment generation in india - an outlook
Employment generation in india - an outlookEmployment generation in india - an outlook
Employment generation in india - an outlook
 
Bihar State Report July 2017
Bihar State Report July 2017Bihar State Report July 2017
Bihar State Report July 2017
 
Productivity challenges in Singapore - Part 2 23062015
Productivity challenges in Singapore - Part 2 23062015Productivity challenges in Singapore - Part 2 23062015
Productivity challenges in Singapore - Part 2 23062015
 
TeamLease Employment Outlook Survey - Report Preview
TeamLease Employment Outlook Survey - Report PreviewTeamLease Employment Outlook Survey - Report Preview
TeamLease Employment Outlook Survey - Report Preview
 
Bihar State Report - March 2019
Bihar State Report - March 2019Bihar State Report - March 2019
Bihar State Report - March 2019
 
Job less growth
Job less growthJob less growth
Job less growth
 
Low Wage Recovery
Low Wage RecoveryLow Wage Recovery
Low Wage Recovery
 
Final_project_report_67_Sri
Final_project_report_67_SriFinal_project_report_67_Sri
Final_project_report_67_Sri
 
Bihar State Report March 2018
Bihar State Report March 2018Bihar State Report March 2018
Bihar State Report March 2018
 
Union Budget 2018-19
Union Budget 2018-19Union Budget 2018-19
Union Budget 2018-19
 
The TeamLease Employment Outlook Report: July-September 2011
The TeamLease Employment Outlook Report: July-September 2011The TeamLease Employment Outlook Report: July-September 2011
The TeamLease Employment Outlook Report: July-September 2011
 
Productivity challenges in Singapore - Part 4 02062015
Productivity challenges in Singapore - Part 4 02062015Productivity challenges in Singapore - Part 4 02062015
Productivity challenges in Singapore - Part 4 02062015
 
Budget 2018-19 and its Impact on the India Economy: An Industrial Slant
Budget 2018-19 and its Impact on the India Economy: An Industrial SlantBudget 2018-19 and its Impact on the India Economy: An Industrial Slant
Budget 2018-19 and its Impact on the India Economy: An Industrial Slant
 

Viewers also liked

Greek gods & goddess passports
Greek gods & goddess passportsGreek gods & goddess passports
Greek gods & goddess passportsNoor Amor
 
Presentación1
Presentación1Presentación1
Presentación1Oscarf
 
Your Guide to Diabetes: Type 1 and Type 2
Your Guide to Diabetes: Type 1 and Type 2Your Guide to Diabetes: Type 1 and Type 2
Your Guide to Diabetes: Type 1 and Type 2Medanta - The Medicity
 
trabajo de 2do año
trabajo de 2do añotrabajo de 2do año
trabajo de 2do añoOscarf
 
Finding medline journal abbreviations
Finding medline journal abbreviationsFinding medline journal abbreviations
Finding medline journal abbreviationskhumbulele
 
11 artemio murillo 'pulga' & jaime morales villavicencio - surfing as a cat...
11   artemio murillo 'pulga' & jaime morales villavicencio - surfing as a cat...11   artemio murillo 'pulga' & jaime morales villavicencio - surfing as a cat...
11 artemio murillo 'pulga' & jaime morales villavicencio - surfing as a cat...SurfriderFoundation
 
Asamblea General
Asamblea GeneralAsamblea General
Asamblea GeneralGuillee12
 
1 zach plopper - conference introduction
1   zach plopper - conference introduction1   zach plopper - conference introduction
1 zach plopper - conference introductionSurfriderFoundation
 
Measuring care gender, empowerment and the care economy
Measuring care gender, empowerment and the care economyMeasuring care gender, empowerment and the care economy
Measuring care gender, empowerment and the care economyDr Lendy Spires
 
Informal sector role in the recyclable waste collection in bulgaria
Informal sector role in the recyclable waste collection in bulgariaInformal sector role in the recyclable waste collection in bulgaria
Informal sector role in the recyclable waste collection in bulgariaDr Lendy Spires
 

Viewers also liked (20)

Greek gods & goddess passports
Greek gods & goddess passportsGreek gods & goddess passports
Greek gods & goddess passports
 
Presentación1
Presentación1Presentación1
Presentación1
 
Nepse technical analysis oct 08 oct 09, 2014 (eng & nep)
Nepse technical analysis  oct 08  oct 09, 2014 (eng & nep)Nepse technical analysis  oct 08  oct 09, 2014 (eng & nep)
Nepse technical analysis oct 08 oct 09, 2014 (eng & nep)
 
Playas cr
Playas crPlayas cr
Playas cr
 
Your Guide to Diabetes: Type 1 and Type 2
Your Guide to Diabetes: Type 1 and Type 2Your Guide to Diabetes: Type 1 and Type 2
Your Guide to Diabetes: Type 1 and Type 2
 
A Report from ATA
A Report from ATAA Report from ATA
A Report from ATA
 
trabajo de 2do año
trabajo de 2do añotrabajo de 2do año
trabajo de 2do año
 
Finding medline journal abbreviations
Finding medline journal abbreviationsFinding medline journal abbreviations
Finding medline journal abbreviations
 
Ayui grande.pps
Ayui grande.ppsAyui grande.pps
Ayui grande.pps
 
11 artemio murillo 'pulga' & jaime morales villavicencio - surfing as a cat...
11   artemio murillo 'pulga' & jaime morales villavicencio - surfing as a cat...11   artemio murillo 'pulga' & jaime morales villavicencio - surfing as a cat...
11 artemio murillo 'pulga' & jaime morales villavicencio - surfing as a cat...
 
Uu 24 2000
Uu 24 2000Uu 24 2000
Uu 24 2000
 
Presentación Partners Global funding
Presentación Partners Global fundingPresentación Partners Global funding
Presentación Partners Global funding
 
Asamblea General
Asamblea GeneralAsamblea General
Asamblea General
 
1 zach plopper - conference introduction
1   zach plopper - conference introduction1   zach plopper - conference introduction
1 zach plopper - conference introduction
 
Measuring care gender, empowerment and the care economy
Measuring care gender, empowerment and the care economyMeasuring care gender, empowerment and the care economy
Measuring care gender, empowerment and the care economy
 
Medication
MedicationMedication
Medication
 
Informal sector role in the recyclable waste collection in bulgaria
Informal sector role in the recyclable waste collection in bulgariaInformal sector role in the recyclable waste collection in bulgaria
Informal sector role in the recyclable waste collection in bulgaria
 
2005:
 2005: 2005:
2005:
 
Obesity facts-Knowing your BMI
Obesity facts-Knowing your BMIObesity facts-Knowing your BMI
Obesity facts-Knowing your BMI
 
Nota kedudukan
Nota kedudukanNota kedudukan
Nota kedudukan
 

Similar to Literacy, household economic activities, informal sector employment and under employment

Small, Medium and Micro Enterprises and the Informal Sector
 Small, Medium and Micro Enterprises and the Informal Sector  Small, Medium and Micro Enterprises and the Informal Sector
Small, Medium and Micro Enterprises and the Informal Sector Dr Lendy Spires
 
Chapter 6 smme_&_informal_sector_masterfile
Chapter 6 smme_&_informal_sector_masterfileChapter 6 smme_&_informal_sector_masterfile
Chapter 6 smme_&_informal_sector_masterfileDr Lendy Spires
 
Informal economy and food security
Informal economy and food securityInformal economy and food security
Informal economy and food securityDr Lendy Spires
 
Measuring of informal emplyment
Measuring of informal emplyment Measuring of informal emplyment
Measuring of informal emplyment Dr Lendy Spires
 
Informal sector publication
Informal sector publicationInformal sector publication
Informal sector publicationDr Lendy Spires
 
KRI Brown Bag Seminar #10: 'Informal and Non-Standard Employment: Cross-natio...
KRI Brown Bag Seminar #10: 'Informal and Non-Standard Employment: Cross-natio...KRI Brown Bag Seminar #10: 'Informal and Non-Standard Employment: Cross-natio...
KRI Brown Bag Seminar #10: 'Informal and Non-Standard Employment: Cross-natio...KhazanahResearchInstitute
 
Taxation and informal sector
Taxation and informal sectorTaxation and informal sector
Taxation and informal sectorDr Lendy Spires
 
Rural_Enterprise_Evidence_Policy_Briefing
Rural_Enterprise_Evidence_Policy_BriefingRural_Enterprise_Evidence_Policy_Briefing
Rural_Enterprise_Evidence_Policy_BriefingRoger Turner
 
Unorgansied sector in India
Unorgansied sector in IndiaUnorgansied sector in India
Unorgansied sector in IndiaChandni Agarwal
 
Options for generating indicators on the informal economy using the labour fo...
Options for generating indicators on the informal economy using the labour fo...Options for generating indicators on the informal economy using the labour fo...
Options for generating indicators on the informal economy using the labour fo...Dr Lendy Spires
 
Position paper domestic revenue mobilization
Position paper domestic revenue mobilizationPosition paper domestic revenue mobilization
Position paper domestic revenue mobilizationSalia Adamu
 
session-ii-bersales economy.PDF
session-ii-bersales economy.PDFsession-ii-bersales economy.PDF
session-ii-bersales economy.PDFMarcoAvenilla
 
Measuring of informal sector and informal employment in st lucia
Measuring of informal sector and informal employment in st luciaMeasuring of informal sector and informal employment in st lucia
Measuring of informal sector and informal employment in st luciaDr Lendy Spires
 
ASSESSING THE REASONS WHY SMALL AND MEDIUM SCALE ENTERPRISES ARE NOT KEEPING ...
ASSESSING THE REASONS WHY SMALL AND MEDIUM SCALE ENTERPRISES ARE NOT KEEPING ...ASSESSING THE REASONS WHY SMALL AND MEDIUM SCALE ENTERPRISES ARE NOT KEEPING ...
ASSESSING THE REASONS WHY SMALL AND MEDIUM SCALE ENTERPRISES ARE NOT KEEPING ...Collins Opoku Junior
 
The urban informal sector of pakistan some stylized facts
The urban informal sector of pakistan some stylized factsThe urban informal sector of pakistan some stylized facts
The urban informal sector of pakistan some stylized factsDr Lendy Spires
 
Lurking in the Shadows: The informal sector and government policy
 Lurking in the Shadows: The informal sector and government policy  Lurking in the Shadows: The informal sector and government policy
Lurking in the Shadows: The informal sector and government policy Dr Lendy Spires
 

Similar to Literacy, household economic activities, informal sector employment and under employment (20)

Small, Medium and Micro Enterprises and the Informal Sector
 Small, Medium and Micro Enterprises and the Informal Sector  Small, Medium and Micro Enterprises and the Informal Sector
Small, Medium and Micro Enterprises and the Informal Sector
 
Chapter 6 smme_&_informal_sector_masterfile
Chapter 6 smme_&_informal_sector_masterfileChapter 6 smme_&_informal_sector_masterfile
Chapter 6 smme_&_informal_sector_masterfile
 
Informal economy and food security
Informal economy and food securityInformal economy and food security
Informal economy and food security
 
Measuring of informal emplyment
Measuring of informal emplyment Measuring of informal emplyment
Measuring of informal emplyment
 
Informal sector publication
Informal sector publicationInformal sector publication
Informal sector publication
 
KRI Brown Bag Seminar #10: 'Informal and Non-Standard Employment: Cross-natio...
KRI Brown Bag Seminar #10: 'Informal and Non-Standard Employment: Cross-natio...KRI Brown Bag Seminar #10: 'Informal and Non-Standard Employment: Cross-natio...
KRI Brown Bag Seminar #10: 'Informal and Non-Standard Employment: Cross-natio...
 
C muller1
C muller1C muller1
C muller1
 
Taxation and informal sector
Taxation and informal sectorTaxation and informal sector
Taxation and informal sector
 
Rural_Enterprise_Evidence_Policy_Briefing
Rural_Enterprise_Evidence_Policy_BriefingRural_Enterprise_Evidence_Policy_Briefing
Rural_Enterprise_Evidence_Policy_Briefing
 
Lmis status zb
Lmis status zbLmis status zb
Lmis status zb
 
Unorgansied sector in India
Unorgansied sector in IndiaUnorgansied sector in India
Unorgansied sector in India
 
Options for generating indicators on the informal economy using the labour fo...
Options for generating indicators on the informal economy using the labour fo...Options for generating indicators on the informal economy using the labour fo...
Options for generating indicators on the informal economy using the labour fo...
 
Position paper domestic revenue mobilization
Position paper domestic revenue mobilizationPosition paper domestic revenue mobilization
Position paper domestic revenue mobilization
 
session-ii-bersales economy.PDF
session-ii-bersales economy.PDFsession-ii-bersales economy.PDF
session-ii-bersales economy.PDF
 
Measuring of informal sector and informal employment in st lucia
Measuring of informal sector and informal employment in st luciaMeasuring of informal sector and informal employment in st lucia
Measuring of informal sector and informal employment in st lucia
 
index_result_eng11
index_result_eng11index_result_eng11
index_result_eng11
 
ASSESSING THE REASONS WHY SMALL AND MEDIUM SCALE ENTERPRISES ARE NOT KEEPING ...
ASSESSING THE REASONS WHY SMALL AND MEDIUM SCALE ENTERPRISES ARE NOT KEEPING ...ASSESSING THE REASONS WHY SMALL AND MEDIUM SCALE ENTERPRISES ARE NOT KEEPING ...
ASSESSING THE REASONS WHY SMALL AND MEDIUM SCALE ENTERPRISES ARE NOT KEEPING ...
 
The urban informal sector of pakistan some stylized facts
The urban informal sector of pakistan some stylized factsThe urban informal sector of pakistan some stylized facts
The urban informal sector of pakistan some stylized facts
 
Lurking in the Shadows: The informal sector and government policy
 Lurking in the Shadows: The informal sector and government policy  Lurking in the Shadows: The informal sector and government policy
Lurking in the Shadows: The informal sector and government policy
 
Pop conference on NPS
Pop conference on NPSPop conference on NPS
Pop conference on NPS
 

Literacy, household economic activities, informal sector employment and under employment

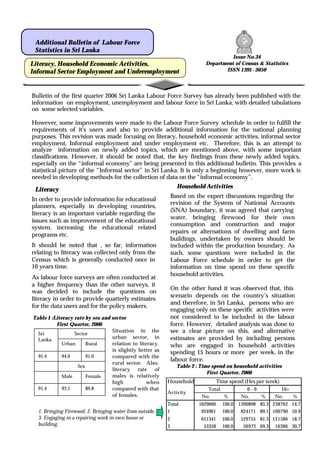
  • 1. Issue No.34 Department of Census & Statistics ISSN 1391- 3050 Additional Bulletin of Labour Force Statistics in Sri Lanka Bulletin of the first quarter 2006 Sri Lanka Labour Force Survey has already been published with the information on employment, unemployment and labour force in Sri Lanka, with detailed tabulations on some selected variables. However, some improvements were made to the Labour Force Survey schedule in order to fulfill the requirements of it's users and also to provide additional information for the national planning purposes. This revision was made focusing on literacy, household economic activities, informal sector employment, Informal employment and under employment etc. Therefore, this is an attempt to analyze information on newly added topics, which are mentioned above, with some important classifications. However, it should be noted that, the key findings from these newly added topics, especially on the “informal economy” are being presented in this additional bulletin. This provides a statistical picture of the “Informal sector” in Sri Lanka. It is only a beginning however, more work is needed in developing methods for the collection of data on the “informal economy”. Literacy Based on the expert discussions regarding the revision of the System of National Accounts (SNA) boundary, it was agreed that carrying water, bringing firewood for their own consumption and construction and major repairs or alternations of dwelling and farm buildings, undertaken by owners should be included within the production boundary. As such, some questions were included in the Labour Force schedule in order to get the information on time spend on these specific household activities. On the other hand it was observed that, this scenario depends on the country’s situation and therefore, in Sri Lanka, persons who are engaging only on these specific activities were not considered to be included in the labour force. However, detailed analysis was done to see a clear picture on this, and alternative estimates are provided by including persons who are engaged in household activities spending 15 hours or more per week, in the labour force. In order to provide information for educational planners, especially in developing countries, literacy is an important variable regarding the issues such as improvement of the educational system, increasing the educational related programs etc. It should be noted that , so far, information relating to literacy was collected only from the Census which is generally conducted once in 10 years time. As labour force surveys are often conducted at a higher frequency than the other surveys, it was decided to include the questions on literacy in order to provide quarterly estimates for the data users and for the policy makers. Household Activities Literacy, Household Economic Activities, Informal Sector Employment and Underemployment FemaleMale 89.8 Sex 93.191.4 91.094.091.4 RuralUrban SectorSri Lanka Table 1 :Literacy rate by sex and sector First Quarter, 2006 Situation in the urban sector, in relation to literacy, is slightly better as compared with the rural sector. Also, literacy rate of males is relatively high when compared with that of females. Table 2 : Time spend on household activities First Quarter, 2006 1. Bringing Firewood, 2. Bringing water from outside, 3. Engaging in a repairing work in own house or building. Household No. % No. % No. % Total 1629660 100.0 1390898 85.3 238762 14.7 1 924961 100.0 824171 89.1 100790 10.9 2 651341 100.0 529755 81.3 121586 18.7 3 53358 100.0 36972 69.3 16386 30.7 Time spend (Hrs per week) Activity Total 0 - 9 10+
  • 2. 2 Informal Sector The Informal Sector represents an important part of the economy and the labour market in many countries, especially developing countries; thus, measurement of the informal sector is important in their own right as well as contributing towards exhaustive estimates of GDP. Further informal sector plays a major role in employment creation, production and income generation. Since its first appearance in the early 1970’s the term “informal sector” has become so popular and nowadays it is used with different meanings for different purposes. Originally it referred to a concept for data analysis and policy making. Now it’s sometimes used in a much broader sense to refer to a concept for the collection of data on activities not covered by the existing, conventional source of statistics. A review of national statistical definitions of the informal sector shows that presently they do not always fully correspond to the international definition adopted by the 15th International Conference of Labour Statisticians (15th ICLC) and the System of National Accounts (SNA) 1993. However, the international comparability of data on the informal sector is affected by national differences in data sources, in the geographical coverage of surveys, in the branches of economic activity covered etc. Therefore, criteria which is to define the informal sector vary among countries. However, most of the countries tends to collect informal sector information , especially those using labour force or other household surveys for the measurement of employment in the informal sector, were advised by the experts that use the criteria of registration of the organization, accounts keeping system and size of their organization. In such situation, Department of Census and Statistics observed the necessity of having informal sector information, and therefore, after carefully reviewing of LFS schedule with the assistance of ESCAP advisor, relevant questions were included in the LFS schedule to collect the information relating to the informal sector on the following items. 1. Registration of the organization 2. Accounts keeping practices of the Organization 3. Total number of regular employees of the organization Formal 37% Informal 63% Informal 84% Formal 16% Formal 47%Informal 53% Table 5 : Employment by economic sector by sex First Quarter, 2006 Figure 1 : Distribution Informal /Formal employment by Agriculture/non-agriculture sectors First Quarter, 2006 Table 4: Composition of employment by economic sector First Quarter, 2006 7221231 * 7081435 Employed 92.87627761 93.2 *7745653* Employment rate (%) Total labour force Table 3: Alternative estimates for employment rate First Quarter, 2006 * By including persons who are engaged in household activities spending 15 hours or more per week , as to be employed. Agriculture sector Non - Agriculture sector All Island Sex No. % No. % No. % Total 7081435 100.0 2586195 100.0 4495240 100.0 Male 4634156 65.4 1545772 59.8 3088383 68.7 Female 2447279 34.6 1040423 40.2 1406857 31.3 Total Formal Informal Sector Figure 1 shows that, in Sri Lanka 63% of the total employment is in the informal sector. It is also revealed that, in Sri Lanka, Agriculture sector comprises 84 percent of informal sector employment and the balance 16 percent is formal sector employment. This relatively high percentage of formal sector employment (16 percent) in the agriculture sector, may be due to the reason that, there are some plantation workers, who are working in estates, which are managed by the government owned large plantation companies. No. % No. % No. % Total employment 7081435 100.0 2586195 36.5 4495240 63.5 Total non- agricultural 4735114 100.0 2216877 46.8 2518237 53.2 employment Total agricultural 2346321 100.0 369318 15.7 1977003 84.3 employment Total Formal sector Informal sector
  • 3. Table 6 : Employment by level of education and by economic sector First Quarter, 2006 Level of education No. % No. % No. % Below Gr. 5 332858 21.3 1231830 78.7 1564688 100.0 Gr. 5 - 9 926416 27.7 2421398 72.3 3347814 100.0 G.C.E.(O/L) 582653 49.0 606646 51.0 1189299 100.0 G.C.E.(A/L) & above 744267 76.0 235366 24.0 979634 100.0 Total 2586195 36.5 4495240 63.5 7081435 100.0 Formal Informal Total Sector As shown as table 6, it is clearly revealed that, employment in the formal sector is more contributed a higher level of education while it is the opposite for informal sector employment. Table 8 : Average monthly *Salary (per month) of the employees by economic sector First Quarter , 2006 * Including, income in kind 3 Superiority of (i) non-agricultural sector as compared to agricultural sector and (ii) formal sector as compared to informal sector, in terms of average income, is clearly evidenced in table 8 above. Table 9: Distribution of employed population by their main occupation and economic sector- First Quarter, 2006 Looking at the occupational breakdown of formal sector and informal sector employment, it is obvious that regarding skilled agricultural and fishery workers, only 2 percent belongs to the formal sector. Again by economic sector, outside of “agriculture” occupation group, “ Craft and related workers”, “Plant and machine operators and assemblers”, “ Elementary occupations” groups are seem to be more important in informal sector than formal sector. 1 Senior Officials and Managers 7 Skilled Agricultural and Fishery workers 2 Professionals 8 Craft and Related workers 3 Technical and Associate Professionals 9 Plant and Machine operators and Assemblers 4 Clerks 10 Elementary occupations 5 Proprietors and Managers of Enterprises 0 Unidentified 6 Sales and Service workers Occupation group Occupation No. % No. % No. % 1 * * 124707 100.0 2 277076 82.6 58501 17.4 335577 100.0 3 339664 86.4 53687 13.6 393351 100.0 4 234860 86.8 35699 13.2 270559 100.0 5 141893 25.9 406749 74.1 548642 100.0 6 204792 39.1 318726 60.9 523518 100.0 7 29540 1.8 1587526 98.2 1617066 100.0 8 374703 31.3 823845 68.7 1198548 100.0 9 185344 40.0 277975 60.0 463319 100.0 10 642742 40.9 927544 59.1 1570286 100.0 0 * * * * 35861 100.0 Total 2586195 36.5 4495240 63.5 7081435 100.0 Total Formal Informal Sector * Cell size is not adequate to provide reliable estimates. Formal Informal Agriculture 4061 3846 3948 Non - agriculture 11167 5738 9120 Total 10136 5287 8174 Sector Industry Total Status in Employment No. % No. % No. % Regular Employees 2341472 90.5 1576430 35.1 3917902 55.3 Employer 82390 3.2 140938 3.1 223331 3.2 Own account worker 129304 5.0 2107624 46.9 2236933 31.6 Unpaid family worker 33030 1.3 670247 14.9 703278 9.9 Total 2586195 100.0 4495240 100.0 7081435 100.0 Formal sector Informal sector Total Regarding the different status of employment, it's noticeable that, 47 percent of the total informal sector employment are own account workers while, 91 percent of formal sector employment are regular employees. Table 7: Distribution of employment by employment status and by economic sector- First Quarter, 2006 Regular Employees 35% Employer 3% Own account worker 47% Unpaid family worker 15% Figure 2: Distribution of informal sector employment by employment status and by economic sector - First Quarter, 2006 (Rs)
  • 4. Criteria for classification of underemployment Underemployment has particular relevance in developing countries, notably in connection with agriculture. It has been observed that measurement of underemployment has mostly been recommended for describing the employment situation in developing countries. In order to classify an employed persons as visibly underemployed, (i) If the person has worked less than the normal duration in his/her main activity In Sri Lanka scenario, 35 hours per week is taken as the cut-off point applicable to all workers, except government teachers, as in practice, though teachers do have a normal duration of work which is below the general cut-off point, they should be on a full time schedule according to the nature of their job. Further, those who do have a secondary job, or those who are employers, were considered as having worked the normal duration in their respective activity. Therefore, if the person has worked less than the normal duration in his/her activity (as described above), then the person is further questioned to ascertain whether he/She is prepared and available for further work if provided. Such persons are considered underemployed in their respective employment. (ii) If the person has worked more than the normal duration in his/her activity If the person has worked even more than 35 hours as usually, but he has worked less than 35 hours actually in the reference period, only due to the off season or bad weather, such persons were also further questioned to check their underemployment situation, considering them as a special category. 4.4Non-Agriculture 5.9Total 8.9Agriculture RateSector Table 10 : Underemployment rate by Agriculture/Non-agriculture sector, First Quarter, 2006 7.05.35.9Total 6.53.84.8O/L and above 7.56.16.6Gr 5-9 5.9 Total FemaleMale 6.75.4Below 5 SexEducational qualification Table 11: Underemployment rates by educational level and the sex - First Quarter, 2006 Figure 3 : Underemployment rate by sector First Quarter, 2006 Agriculture, 8.9 Non- Agriculture, 4.4 0 2 4 6 8 10 sector Underemploymentrate The importance of the concept of Under-employment has long been recognized. At the international level, the concept was accepted at the Sixth International Conference of Labour Statisticians ICLS (1948). According to the 1966 ICLS resolution, “underemployment” exists when a person’s employment is inadequate, in relation to specified norms or alternative employment, account being taken of his occupational skill (training and working experience)”. Two principal forms of under-employment are distinguished: visible underemployment and invisible under-employment. Visible under-employment, reflecting an insufficiency in the volume of employment, and invisible under-employment, characterized by low income, under utilization of skill, low productivity and other factors. The 1982 ICLS resolution recognized, however, that “for operational reasons the statistical measurement of of underemployment may be limited to visible underemployment”. It refined the definition and introduced an approach to combine the measurement of visible underemployment with that of unemployment. Underemployment 4 As can be seen from table 10, underemployment rate has shown a marked difference between agricultural and non- agricultural sectors showing the respective rates as 8.9 and 4.4 . It is also noted that, there is no distinguish differences of underemployment rates among the people those who have different educational qualifications. Department of Census & Statistics, 15/12, Maitland Crescent, Colombo 7 Telephone 2695291, Fax 94-11-2697594, Email :sample.survey @ statistics.gov.lk Web address: www.statistics.gov.lk Applying above mentioned criteria, an attempt has been made to estimate under-employment and it is estimated that, “underemployment rate” which is defined as the number of underemployed persons as a percentage of employed persons, is 5.9 percent.