SlideShare a Scribd company logo
1 of 11
Download to read offline
September 2022 156
Foundations For Valuation Models
I. Introduction
If in 2021 the data created, captured, and replicated
across the world is estimated at 80 zB, it should double
in just four years to reach 170 zB in 2025. How big is
that figure? Here is a simple insight: knowing that one
zB (zettabyte) is one billion terabytes (1021), a regular
personal internet connection would need more than
30,000,000 years to transmit a zettabyte. Because they
are not comparable with common practices, such huge
amounts of data are dealt with via dedicated infrastruc-
tures and Artificial Intelligence (AI) tools. Conversely,
the development of AI fuels the need for more data.
In such perspective, there is an avenue for the de-
velopment of digital markets. However, it will need to
clarify how data creates economic value. Subsequent
questions address at least two issues: 1) the meas-
urement of data value, and 2) the process of valua-
tion of data contribution to economic benefits. This
article suggests some insights and building blocks. It
develops in three parts. First, accepting that informa-
tion-goods behave differently than non-information
goods, we recall some specificities of data in the age
of Artificial Intelligence. Second, we show that the
application of common valuation methods to data,
although not straightforward, is possible. Finally, in
our third part we identify ways to operationalize data
valuation methodologies.
1. The Relevance of Data in the Age of Artifi-
cial Intelligence
1.1 New versus Old Data Processing
While data is
used for machine
inference and de-
velops in volume,
its relevance for
the application
of machine learn-
ing (ML) based
solutions increas-
es. Thus, while
entering the age
of AI, data usage
also nurtures and
supports the de-
velopment of AI.
This dramatically
modifies data pro-
How Does Data Create Economic Value?
Foundations For Valuation Models
By André Gorius, Véronique Blum, Andreas Liebl, and Anke Nestler
■ André Gorius, PhD,
Co-Chair LESI IP Valuation,
SDG-IP Index and Innovation
Trends Committees,
Winnotek,
Lyon, France,
E-mail: andre.gorius@
winnotek.com
■ Véronique Blum,
Associate professor,
University of Grenoble Alpes,
Founder of StradiValue,
France
E-mail: vblum@stradivalue.com
■ Dr. Andreas Liebl,
Managing Director,
appliedAI Initiative GmbH,
Munich, Germany
E-mail: a.liebl@appliedai.de
■ Dr. Anke Nestler,
Managing Director,
Valnes Corporate Finance,
Frankfurt, Germany
E-mail: Anke.nestler@valnes.de
cessing practices, and current data processing differs
from traditional programming.
In traditional program-
ming, code is written and
then executed (Figure 1).
In such context, the pro-
grammer keeps control on
the code. The way data is
used by AI fundamentally
changes. In ML, select-
ed or created models are
trained on historical data;
the operation is coined
data feeding. The super-
vised or unsupervised ML
algorithm reflects correla-
tions and patterns of the
data. This results in the
creation of a model that
can be used for further
simulations or predictions
on other data sets. Next,
another data set applies
the trained model and cre-
ates a predictive output,
which is a new data set.
Two new features, ab-
sent in traditional pro-
gramming, characterize
this processing: 1) there
is opacity about the ac-
Figure 1: Differences In Machine Programming,
Machine Learning, And Machine Inference
Processes At A Glance
les Nouvelles
157
Foundations For Valuation Models
tions conducted by the ML model, and 2) there is a
significant dependency on the data that was used for
training because, contrary to theory-derived models,
data is embedded in the ML model construction (“data
is the new code”). Concretely, the same operation run
on a different data set will result in a different model.
It follows that the relevance of the obtained results
depends on both the quality of the ML model and of
the data. Thus, data is part of the solution, and without
data the solution is useless.
For these reasons, the development of AI addresses
issues related to the value of the data used for train-
ing and validation as well as the value created by data
while contributing to AI processes, or before its contri-
bution. Those are IP and valuation issues that in prac-
tice usually remain unquestioned at the early testing
and experimentations stages, as those are quite easy
to run. However, they become prominent when one
reaches a scaling stage.
1.2 New IP Challenges in the Era of AI
The following paragraphs roughly describe the AI
data processing operation at the aforementioned stag-
es: the training stage and the inference stage.
1.2.1 The Training Stage
At the training stage, an AI tool uses (mostly) big
sets of historical data, likely combining public and pro-
prietary data. This raises some issues. First, once used
to train for machine learning, it becomes difficult to
isolate the combined data out of the model. Second,
out of the multiple feeding data sets, it is difficult to
identify the contribution of a single data source to the
model. Hence, some data sets or subsets could be-
come significantly useful while others contribute only
marginally. Third, since the data sets used for training
require some preparation, the assessment of the effort
put in the preparation is also a challenge.
Current usages suggest that data merged with do-
main knowledge for model design results in the most
promising applications for businesses. Further, huge
efforts in research are done to reduce the amount of
data needed for training. Thus, there are paths for ex-
ploring optimized processes that will likely change the
dependency on specific data, while increasing the rele-
vance of pretrained models.
At that stage, data ownership issues are already
manifold. For example, one could run a ML model
thanks to licensed data. Several questions follow: 1)
Who owns the data? 2) Can one lose ownership? 3) Is
a revocation of access to data possible? And 4) If 2 or 3
occurs, how will this impact the trained model?
The clear identification of associated rights is rele-
vant in that rights indicate where cash flows will be
oriented once the AI model will generate economic
benefits. Also, the use of proprietary data could di-
minish risks associated to data processing. Thus, risk
assessment becomes a key operation in data sharing
strategy. This would include gauging the vulnerability
of the model to the structure of rights or, when data
contains potentially differentiating information, gaug-
ing the vulnerability to the loss of competitive advan-
tages. Indeed, similar to a recipe, most economic value
depends on “secret ingredients” where one of the in-
gredients is data. It follows that managerial challenges
will include 1) the identification of the data sets to
collect and use, and 2) those that can be shared, but
also 3) how it can be shared, whether by giving limited
or unlimited access, and/or exclusive rights.
1.2.2 The Inference Stage
Similarly, at the inference stage there persists a high
dependency to the provision of data. This is because
the model runs on current data, often real time data,
with as much contextual information as possible. It
follows that without access to new data for further
application, trained models remain useless. Moreover
“updates” are conducted through retraining, therefore
continuous access to the training data set is a condi-
tion for operation. Beyond data volume, data quality is
also an issue. Example 1.3 in Insert 1 illustrates how
much quality is critical to ensure the marketability of
an AI system.
But data is not the only key input to produce a suc-
cessful output of a training session. In addition to data,
one has to define a suitable preprocessing and select
the appropriate model that will achieve the highest lev-
el of accuracy. For example, in the field of autonomous
vehicles, 98 percent of accuracy is not sufficient; the
target is beyond 99.9 percent. Notably, the marginal
progress of less than two points is conducted through
experimentations and can take years as it often requires
hundreds or even thousands of training runs before the
model reaches the expected accuracy. Hence, it requires
significant investment in time and workforce. Methodo-
logical choices made at that stage are potentially differ-
entiating. The combination of domain knowledge and
models are expected to result in the most stable and
accurate output for the desired application. Finally, the
model produces feedback loops that are fed by new data
and that improve the model. In summary, the approach
with which models are trained is a key enabler for fast-
er and more reliable application development and can
become a significant competitive advantage. This is sig-
nificantly different than a traditional approach with a list
of requirements one can work against. Ultimately, this
results in unique and protectable applications combin-
ing data with traditional software (Software 1.0) as well
as ML-based components (Software 2.0), where tradi-
tional software helps to bring the model to the field and
make its usage intelligible.
Later on the application needs maintenance, but
the update of the model cannot be conducted with a
September 2022 158
Foundations For Valuation Models
simple patch and the
model needs retrain-
ing. As the environ-
ment is dynamic, the
model becomes less
and less accurate and
one needs to actualize
it. This is called mod-
el drift. It is a main-
tenance issue that
requires monitoring
because the available
data is also evolving
with respect to the
initial feed data. Fig-
ure 2 illustrates the
components of an AI
application embed-
ding data.
Figure 2: The Development Steps of an AI Model
Insert 1: Some Examples Of Data And ML Combined Applications
Example 1.1: Language Models and the Appropriate Training Data
GPT-3, a language model that uses deep learning to produce human-like texts, is trained on most
data available on the Internet. Wu Dao 2.0, the largest and probably the most powerful neural net-
work ever created, was trained on 4.9TB of text and graphic data in Chinese and English and counts
1.75 Billion parameters (https://towardsdatascience.com/gpt-3-scared-you-meet-wu-dao-2-0-a-mon-
ster-of-1-75-trillion-parameters-832cd83db484). OpenAI, the creator of GPT-3, has put much effort
in selecting data of higher quality, which reduced the amount of training data but increased the
value. Moreover, OpenAI applied the latest model architectures (attention-based transformers) and
developed a self-supervised training process. Other actors working on language models argue that
their models might be of higher quality because they rely on proprietary data of the highest quality.
However, many doubt that the addition of high-quality proprietary data will increase the quality of
the application compared to the approach of OpenAI that refined public data and combined them
with innovations in the training process and model architecture.
Example 1.2: Facial Recognition and the Legal Framework
Clearview, an American facial recognition company, collected images through crawling social media
platforms. This has become a highly controversial way of collecting as much data as possible and
combined images of faces with all other information that is (or was) available. As a result, they cre-
ated a unique asset by their approach to data collection and aggregation, which is combined with
state-of-the-art computer vision algorithms. This asset is now at the core of the company’s solution.
In many countries, there is an ongoing discussion about the legal status of the data collection.
Example 1.3: Cancer Detection and the Quality of Data Annotation
A report highlighted that the IBM Watson application for cancer detection was biased by those
doctors who initially labeled the data. This suggests that recommendations for treatments could
potentially be biased by those who built the systems. Aware of the pitfall, users little adopted the
system. In that case, IBM’s strategy consisted in putting a high effort on labeling data with the help
of specialists. But the system is only as good as the data it is fed with. Therefore, in its attempt to
create a unique proprietary data set, bias in data quality significantly reduced the economic value of
the solution. Indeed, the assessment of the quality of the data can be difficult if not impossible and
it follows that the common hypothesis is that only a few experts are able to annotate data in such a
manner that quality is assured.
les Nouvelles
159
Foundations For Valuation Models
of Step 1 arise. Also, as aforementioned, the relative
dependency of the model on the initial data set and the
new data set is an issue.
Step 5—Validation step of the output: The appli-
cation requires access to data to ensure the output of
the solution makes sense.
Steps 6 and 7—Maintenance and value creation:
Ultimately, due to changes in the environment model
quality degrades, and the model has to be retrained.
This requires access to the original data set for training
in addition to the data collected in the meantime.
Consequently, original training data loses value over
time while more recent data becomes more valuable.
This suggests that the valuation of data follows a dy-
namic process that makes data value a characteristic
that is relevant and valid on a short temporal window
only. In any case, without access to the data during
inference, the model is of significantly reduced value.
Also, as pointed to before, in training and inference
stages, data quality is most important for the success-
ful application of AI.
Figure 3 sheds light on how data flows through the
pipeline and how different this process is from tradi-
tional data processing.
2. Methods for Data Valuation
As described in Part 1, data has to be exchanged
and processed for ML-based applications to work.
Therefore, it is essential to be able to share, sell, or
purchase data. Surprisingly, despite the relevance of
data sharing, the application of valuation methods to
data is still scarce.
2.1 Valuation of Intangible Assets:
Basic Methodologies
Intangible assets valuation is not different from the
valuation of a company, especially now that intangi-
bles represent 90 percent of enterprise values (Ocean
Tomo, 2020). However, there are important differ-
From an IP perspective the operations differ from
traditional IP operations and raise several questions: 1)
How relevant to the output is the new data? 2) Does
it contribute more or less than initial data to the mod-
el? 3) What is the value of different data coming from
different devices that run the same models? Those are
currently unresolved accounting and fiscal issues yet to
explore. There is also a question of ownership of the
model that was developed on initial data and improved
with the additional data (that potentially comes from
different data owners). Orange rectangles in Figure 2
point to major IP issues in AI data processing.
1.3 The Data Pipeline
An applied view on the same process suggests to dis-
tinguish seven steps in AI data processing (Figure 3),
focused on data.
Step 1—Extract from the source: Especially in
B2B contexts, suppliers of components but also Origi-
nal Equipment Manufacturers (OEMs) struggle to ac-
cess the required data during operations. There is a
good reason for that: data is typically owned by those
who produce the data during operation. Data market
development and the enhancement of data value will
be supported by an easier access to data.
Step 2—Data integration: This creates a situation
with many different potential owners. From a legal per-
spective the situation is often fuzzy because, in the ab-
sence of regulations, it is not clear to what extent data
can be used (e.g., car manufacturers vs. drivers; machine
manufacturers vs. machine operators). As a default ap-
proach, contractual agreements define how data can be
used by those who created the ML applications.
Step 3—Preprocessing: Moreover, data needs to
be preprocessed and, e.g., correctness of data needs
to be assured. If sensors send erroneous data, deci-
sions by the ML system might be flawed or feedback
loops do not work correctly. This becomes even more
complicated if the system relies on data from other or
multiple suppliers.
Consequently, data
sources need not only
deliver the specific in-
formation needed for
the ML-based applica-
tion but should also
deliver contextual or
labeled data allowing
plausibility checks
and quality control.
Step 4—Inference:
This is when new data
is needed to feed the
algorithm and the
same issues as those
Figure 3: The Data Pipeline
September 2022 160
Foundations For Valuation Models
ences between company and intangible valuations. In
the first case, the legal framework is clear enough to
delimit the scope of the valuation, whether a limited
partnership or a newly created company. In the second
case, valuators are less equipped when it comes to de-
fining the limits of intangibles and moreover, of data.
It follows that the first issue met by valuators is the
definition of the valuation object. The first part of this
article has offered a useful description of the pipeline
to situate the object of valuation in the data processing
pipeline. Indeed, valuation could alternatively focus on
training data or the AI algorithm. As mentioned here
before, and considering the short validity of a valua-
tion, a second issue relates to the date of the valuation.
Overall, there are three accepted methods to value
intangible assets (Figure 4). We describe them in the
following paragraphs.
2.2 The Market Approach
This valuation approach derives a value from the
observation of recent existing transactions of similar
assets. This is the preferred fair value valuation accord-
ing to the international financial reporting standard
which defined a hierarchy of fair values in the dedicat-
ed standard IFRS 13. Preferably, transactions should
be observed on a liquid market and involve an identical
asset. This is a situation described as Level 1 in IFRS.
This of course is not possible when we are valuing in-
tangibles. If Level 1 fair value cannot apply, IFRS sug-
gests moving to Level 2 fair value. Level 2 fair value is
based on transactions occurring on less liquid markets
but on identical goods or on liquid markets of similar
goods. The two levels adopt a market approach that is
very convenient and accurate to estimate the econom-
ic value of a tradeable good by sticking to the current
trend. However, it is often irrelevant when the market
is highly volatile and unfortunately hardly applies to
data transactions, as markets are not yet liquid and by
construction, intangibles are dissimilar. Nevertheless,
data sets are traded, more likely with confidentiality,
but it may occur that a company has access to relevant
information and be able to build an ad hoc comparable.
When a comparable transaction occurs, the valuator
needs to identify the appropriate indicator. Those vary
depending on the nature of the data set: it could be a
price per user or a price per image, a price per profile
or a price per data set or list. The indicator is next
applied to the valuated transaction. Often, the valua-
tor can make some adjustments to correct for uneven
accuracy or differences in exclusivity rights or lifetime
of the data. See Insert 2.
2.3 The Income or Revenue-Based Approach
The revenue-based approach derives the value of
the asset from the future revenues that it is expect-
ed to generate. Revenues can be understood as a ge-
Figure 4 : Valuation Methods
Company Y wants to value a data set of driver trajectories and behaviors that records 10,000 indi-
vidual entries. Company Y exchanges information with actors of the sector and learns that Company
X, a competitor, has recently sold a data set of 2,000 individuals on a data exchange for the price of
660,000 €.
Assuming that the information about drivers is similar across the two data sets, a single profile has
a comparable value of 330 €. This makes a global value of 3,300,000 € for Company Y’s data set.
If Company Y’s data set contains 6,000 records of individuals as compared to the 5,000 in Company
X’s set, and assuming that the data contains information as relevant as the 5,000 entries, the price
could increase by 20% and reach 3,960,000 €.
Insert 2: A Drivers Data Set Value With Application Of The Market Approach
les Nouvelles
161
Foundations For Valuation Models
neric term that describes different sources: the cash
flows, the residual income, the price premium, and
the relief-from-royalty generated by the exploitation
of the asset. In contrast to the market approach, in
which the time perspective is the present, the reve-
nue-based approach is forward-looking. This tempo-
ral orientation supposes that a reasonable business
plan exists that narrates the manager’s vision. In
IFRS, revenue-based income is also appropriate to
estimate a Level 3 fair value, when Levels 1 and 2
cannot be applied. It is often coined “the entity-based
approach” because it tells the story from the compa-
ny’s point of view or expectations.
Amongst the different sub-approaches, the most
commonly used one is that of the Discounted Cash
Flows. It requires the estimation of the probable in-
cremental cash that will be generated by the asset. As
mentioned above, those flows can originate from dif-
ferent sources: royalty, incremental margins originat-
ing in sales increase, and/or cost savings. This applies
to data that is licensed or data which treatment will
allow to save costs or generate extra revenues, for
example by attracting new customers. The main diffi-
culty in the application of the approach is the identi-
fication of the part of revenues that is strictly related
to the IP. A conceptual limit of the methodology lies
in its deterministic approach: it pretends to predict
a one-path revenues stream in the future, whereas
possible revenues streams are manifold and subject
to contingencies that are unpredictable. Therefore,
a basic revenue-based methodology should be com-
pleted by capturing distributions of cash flows rath-
er than a unique series of cash flows (See LESI IPV
committee webinar on the topic). The recognition of
a distribution of cash-flows/incomes provides a bet-
ter representation of uncertainty that a basic reve-
nue-based method tends to elude. An illustration of
a revenue-based application is provided in Insert 3.
Here before, we have observed that data (especially
when used for ML applications) has specific character-
istics that require an adaptation when one intends to
use DCF methods. We call this a “data-value based valu-
ation method.” In line with the DIN (Deutsches Institüt
fur Normung) approach to patent value, an overall da-
ta-value factor is arguably a value that can be multiplied
with the NPV value. A data value factor is composed of
several dimensions, which can include:
1. Time Value (TV): This dimension assumes that
value changes over time and typically decreas-
es—and this is specifically true for information
that is needed in real time and has almost no
or at least significantly less value when older.
A specification could be: 0=outdated data,
1=timely data.
2. Contextual Value (CV): This dimension assumes
that the relevance of data lies with its applica-
tion. Some data has value by itself in a specific
application while some data is only useful for
an application if combined with data from other
sources or with context that is not provided with
the data set. A specification could be: 0=single
data point that is useless without context, 1=all
necessary context is included.
3. Information Value (IV): The absolute value of
the information [its uniqueness] defines who
can provide the customer with the required in-
Insert 3: A Drivers Data Set Value With Application Of The Revenue-Based Approach
The A Insurance Company wants to purchase the data set offered by Company Y because it contains
drivers’ behaviors that could allow a new pricing strategy with premiums adjusted to predicted be-
haviors. In order to assess the opportunity, Company Y builds a business plan including both the costs
that it expects to save due to a decrease in claims and the revenues losses due to the withdrawal of
customers whose premium price will increase. The decrease in both revenues and costs compose the
expected yearly flows that will be subject to corporate tax. Post-tax flows are next discounted and
summed up to form a value which is to be compared to the cost of investment. If the former is greater
than the latter, the investment is deemed generating positive benefits to the company.
The table on page 162 illustrates such estimation (inspired by IMDA, 2019). First, the projection of
cost of claims with and without data are compared. Losses in revenues are next deducted from the
costs saved. Also deducted are the costs to manage the new data activity, which comprehends the
salary of a data scientist who will update the model, and marketing costs for communicating about
the company’s new strategy. Finally, tax payments are deducted to obtain cash flows. Cash flows are
estimated and discounted to form a Net Present Value, which represents the current value of the data
set. The NPV of half a million contrasts with the market approach result that was eight times greater.
This is explained by the fact that a different usage is being valued. Concretely, the estimation can be
multiplied as much as demand is sustained.
September 2022 162
Foundations For Valuation Models
formation. A specification could be: 0=can be
received from different sources, 1=only one
person can supply data.
4. Data Quality (granularity, correctness, etc.): An
accurate data quality is absolutely essential for
a proper application. If quality can be guaran-
teed, the customer has significantly less effort to
adapt the data, and thereby saves costs. Some-
times this is a hard requirement for applications.
A specification could be: 0=quality is not ascer-
tained, 1=quality can be guaranteed.
The four factors evaluated in the ranges between 0 and
1 are complex and highly individual factors that are relat-
ed to the assessed applications. They might also be part of
the negotiation between customers and suppliers.
Why are factors depending on the application, and
therefore, why is the value different? The application
value can be assessed by the present value of all future
cash flows that are expected from the specific usage
at play. One specificity for learning systems regarding
the application value is that the better the solution be-
comes over time —thanks to the feedback loop and
the learning of the application —the higher the value
over time. One illustration is that of a virtual assistant
that becomes better in answering customer requests.
Similar to the DIN approach to patent value, the ap-
plication value becomes a function of the dimensions
assessment, with the following calculation:
(TV * CV * IV * DQ) * application value = value of
data for a given application
Where application value is the discounted value of
the cash flows generated by the application.
Moreover, if training and inference can be independ-
ent from each other, the overall value is equal to the sum
of the training value and of the inference value. Training
value includes the discounted value of the model used
for other applications than the assessed one, while the
inference value the sum of the assessed application(s).
When inference matters, the sum of all applications is
assessed as one trained model, which could be used in
multiple devices or products. See Insert 4.
2.4 The Cost Approach
The cost approach approximates the data value with
the costs of replacement or creation of a functionally
equivalent data set. The practice is common in account-
ing and is the main approach used for assets’ first recog-
nition. There is often a large experience in calculating
costs associated to assets such as R&D costs or patents,
and companies are equipped with managerial account-
ing measurements. Costs are often focused on the ac-
quisition of rights, for example, a patent filing, and the
related maintenance costs. In the case of data, a chal-
lenge will be to clearly identify and assess such costs.
The main limit of the method is obvious: there is
little correlation between the costs incurred to create
a data set and the value that it can possibly generate.
Therefore, equating costs and values is a highly ques-
tionable approach. This is because the approach disre-
gards the uniqueness or specific attractiveness of the
data set. Also, the cost approach does not reflect the
evolution of the environment and could be subject to
time-lag effects. The replacement costs approach is a
variant of the cost method that can circumvent the
latter limit. This approach estimates the total invest-
ment expense that should be made in order to replace
the data set. This value could be negligible when the
data set is that of a large retailer’s customer behaviour,
for example. However, the cost could be tremendous
when the data to reconstitute is that which has been
captured by a satellite or a telescope.
Y1 Y2 Y3
Claim costs before data usage (1) 3 000 000 3 150 000 3 307 500
Claim costs after data usage (2) 2 550 000 2 205 000 1 653 750
Revenues loss (3) 500 000 550 000 660 000
Costs reduction (4)=(2)-(1)-(3) -50 000 395 000 993 750
Supplemental costs for ‘data analysis’ (5) 100 000 110 000 121 000
Supplemental ‘marketing’ costs (6) 30 000 33 000 36 300
Total marginal costs (7)=(5)+(6) 130 000 143 000 157 300
Pre-tax cash flows (8)=(4)+(7) -180 000 252 000 836 450
Corporate tax (20%) (9) -36 000 50 400 167 290
Post-tax cash flows (10)=(8)-(9) -144 000 201 600 669 160
Discounted cash flows (10%) (130 909 €) 166 612 € 502 750 €
Net Present Value 538 452 €
les Nouvelles
163
Foundations For Valuation Models
The cost approach adopts a retrospective temporal
orientation when incurred costs form the value and
adopts a forward-looking orientation when replace-
ment costs are estimated. Thus, the interpretation of
the two approaches differs as the incurred costs bears
little or no risk of estimation, whereas replacement
costs bear an estimation risk. See Insert 5.
3. Applicability of Valuation Methods to Data
in the Context of AI Applications
Some characteristics make data a particular econom-
ic object that challenges the assumptions and under-
pinnings of traditional valuation models, and which
subsequently require some adaptations.
First, data is non-rival. As suggested in Insert 3, one
kind of use does not hamper other usages. It follows
that multiple sources of revenues can be envisaged,
and amongst those, the multiple sales of a same data
set or the multiple sale of different versions of the
same data set (Shapiro & Varian, 1998).
Although data intrinsic value may vary in time (Fer-
nandez et al., 2020 —Figure 4), it does not necessarily
degrade by erosion or obsolescence; it may stay con-
stant or even increase. For example, some cohorts of
drivers could be more and more valuable with time be-
Insert 4: A Multidimensional Data Valuation, A Simple Case
You want to build an AI-based sales support tool. With that aim, you are considering purchasing mar-
ket data from a large market research organization. The sales revenues that the tool is expected to
generate are 200,000 € per year, with an annual inflation rate of 2%. The project horizon is 10 years.
In a world without tax and in the absence of costs, the project net present value is estimated to be 2
Million €.
But how can one assess the value of the data?
First, one needs to define the contribution of the data to the tool. In the present case, the data compo-
nent of the overall solution is thought to be 40% (20% for the model training and application develop-
ment and 20% for the maintenance and ongoing retraining over the lifetime of the application). It fol-
lows that the data share is defined as 0.4. This coefficient reduces the NPV for the data to 800,000 €.
Next, let’s consider the other dimensions of the data value.
1. Time Value: Knowing that market data changes over time, we assume that buying the data now
will help the AI-powered sales support system to train well and to perform well as long as market
dynamics do not change. Indeed, training data is historical data and is only valuable if it applies
identically in the future. We predict that the market will change significantly every three-four years.
Therefore, the purchase of three-year historical data means that annual data will have different valid-
ity times: one year of the oldest data, two years for the two-year-old data and three years of the latest
data, i.e., a total of six years of validity. The required validity time for a three-year data series is 30 (3
* 10 years). Therefore, we estimate our validity duration to be 6/30 = 0.2. The maximum coefficient is
reached every year when an updated data set is available for the past three years.
2. Contextual Value: The data that the market researchers collected contains most of the relevant
content. You might have received a few more variables that you assume would have been relevant to
better reflect the reality for your application, but you assume that it is almost complete. Consequent-
ly, the data contextual value is estimated to be 0.8.
3. Information Value: The data the market research organization offers is unique in the sense that
no other organization offers this data. It is not substitutable. However, it could possibly be collected
by other players because the data is accessible. Also, you are aware that the seller does not provide
the data exclusively to you. Therefore, even though the value of the information is high, it is rather
limited to the extent it costs someone else to collect and provide it. Moreover, the data set is only one
of four very important data sets that you require for the application. Therefore, the IV is set to 0.2.
4. Data Quality: The data is granular and correct. However, there is a significant effort for your data
engineers to check and correct it. Indeed, there is always the possibility that outliers exist due to mis-
takes made by the seller. The seller is indeed unable to guarantee error-free data sets. Consequently,
you plan two weeks of engineering time, which costs you 20,000 €. Recognizing the cost and effort
for quality control and quality improvement you set the DQ value to 0.2
The overall value of the data set is:
0.2*0.8*0.2*0.2* 800,000 = 5,120 €
September 2022 164
Foundations For Valuation Models
cause they will allow a better understanding of drivers’
risky behaviors through ages and in relation to claims
(i.e., incidents or accidents).
Contrary to common thinking, data remains an ex-
cludable good because the “holder” (data ownership
does not exist) can specify usage modalities in a con-
tractual agreement: it can be licensed, subject of a
unique access, of multiple access, it can be reproduced
or not, modified or not, sold or not, etcetera. The limit
of excludability resides in the control that the holder
can have on the data usages. Thus, another condition
to excludability is the investment in cybersecurity and
controls. Paradoxically, a vulnerable holder could be ex-
cludable from the data that he generated on his own.
This implies that projected cash flows are conditional
to the existence of such controls. See Figure 5.
Also, it may be worth recalling that, as with other
goods, data value exists on the condition that it is used.
Conversely, stored data has no direct economic value
if the means of its exploitation are not invested in.
Exploitation is in many ways similar to an investment
decision and requires the estimation of cash flows or
earnings. To do this, valuators model a business plan
that captures the chain of activities that an organiza-
tion performs in the aim of delivering valuable data us-
ages. Therefore, it
becomes relevant to
understand the data
value chain (DVC)
to build the useful
business plan.
In a DVC, infor-
mation flow is de-
scribed as a series
of steps needed to
generate value and
useful insights from
data (Curry, 2015).
For example, how
data is collected
can be key to build-
ing a value proposal
(Example 3). Also, data quality and integrity are issues
and investments that secure those will maintain value.
Because of their importance, the European Commis-
sion sees the DVC as the “centre of the future knowl-
edge economy,” bringing the opportunities of the digi-
tal developments to the more traditional sectors (e.g.,
transport, financial services, health, manufacturing,
retail)” (DG Connect, 2013). This raises the following
question: Does a general consensus exist about what
is a DVC? The answer is no, and anyone browsing the
Internet will find a multiplicity of DVCs counting from
four to sometimes 12 steps. We suggest a synthesis
that matches the data pipeline introduced before (Fig-
ure 5). At each of the DVC stages, activities generate
costs or revenues. To illustrate each step, we examine
the case of Company G, a geolocation forecast provid-
er. See Figure 6.
The steps are:
1. Discovery/Creation of Data: the cost of discov-
ery can depend on whether one generates their own
data or purchases it.
Company G can either invest in installations cap-
turing the necessary data or buy it from actors spe-
cialized in data capture. In the latter case, G can
Figure 5: Data Operations to Commercialization
Insert 5: A Drivers Data Set Value with Application of the Cost Approach
Company Y has spent the following amounts of money to develop the data set:
Entry costs that include regulatory compliance, authorizations to collect data, the development of
the sensor that will track the drivers’ behaviors, and the installation or provision of facilities to store
the data. Overall, costs are estimated to be worth 2,000,000 €. This includes software and storage,
but not the human capital and marketing costs already estimated in Insert 3. The latter and other
costs incurred to create the data set amount to 2,500,000 €. Again, this value contrasts with the
market- and revenue-based approaches but the meaning is different. The data set was worth 2.5 M€
of investment to Company Y because, in the long term, more benefits are expected to be generated
from such investment.
les Nouvelles
165
Foundations For Valuation Models
turn to the few oligopolists in the domain or buy
data on existing market places (Dawex, aws, snow-
flake…). Knowledge on data price fixation is still
scarce, therefore procurement solutions could vary
highly from one solution to the other and from one
seller to the other.
2. Integration: this non-compulsory step describes
the work that needs to be done to organize the data
with other data sets. To do so, one needs knowledge,
computational capacity, and a workforce.
As a geolocation data treatment entity, G deals with
geolocation data that sometimes is labeled according-
ly with the means of transportation (by foot, by car,
by bus, etcetera) or alternatively, is not. In the latter
case, to build a geolocation forecast, G will need to la-
bel the data by conducting some reverse engineering.
This has a cost that will add to the purchase price of
data and, moreover, this slightly increases risks due to
inference bias.
3. Transformation: at this step, data is modi-
fied, extended, and can produce further data from
one or multiple sources.
G’s machine-guided or men-guided process con-
sumes energy and time. Managerial choices described
in the first section can significantly impact the P&L.
4. Added Value: outputs of data manipulation are
new forms of descriptive, predictive, or prescriptive
analysis. Value is added but only costs can be recorded,
because the results are not yet shared.
G manipulates data thanks to its workforce and an
AI component. This supposes IP protection costs, AI
development costs, and cybersecurity costs.
5. Impact: when new results are available, they need
to be intelligible and shared under the assumption that
increasing (perceived) knowledge is a condition of val-
ue creation. At this stage, results visibility may also
require marketing communication operations.
G will expense advertisement costs for geolocation
services, communication costs in specialized forums,
of registration on platforms, etcetera.
6. Usage: one particularity of data is that it can be
Figure 6: The Data Value Chain
September 2022 166
Foundations For Valuation Models
used many ways, and even reused. It can be used by
the data creator, the data transformer, or someone else
completely different from the field. Usage depends on
the user intention, which can be different from the
data holder processing through the DVC.
Geolocation data can be useful in the situation of a
pandemic for car makers because traffic information
will support their inventory management. The effec-
tive usage can substantially differ from the reason why
data was created in the first place. As a consequence,
the potentially generated revenues are multiple and
difficult to forecast.
In the end, the condition for determining the value
of data is, more than for any other asset/good, the ex-
istence of a view of the upcoming usages.
Conclusion
AI applications are special, which significantly drives
the value of data and the need for proper valuation
techniques. After highlighting the unique aspects of
data in ML-based applications, we have shown that the
three traditional approaches to IP valuation can apply
to data valuation cases.
The market approach has currently little relevance,
but the expected development of data exchanges
might evolve towards a more liquid market and better
price predictability.
The cost approach is adequate to describe the invest-
ment made by the company producing the data, but it
suffers from challenges when economic benefits are to
be valued. This is because data can be used in multiple
applications, which would decrease the cost for each
individual case.
Revenue-based values are most complex to build as
they require detailed business plans. They are consid-
ered as the most reliable and flexible existing solution.
Finally, we suggest that an ad hoc description of the
DVC will support the work of the valuator in the finan-
cial modeling of projected cash flows. This will include
technical development of AI as well as training and in-
ference aspects. ■
Available at Social Science Research Network (SSRN):
https://ssrn.com/abstract=4179547.
References:
E. Curry, “The Big Data Value Chain: Definitions,
Concepts, and Theoretical Approaches,” (2015).
10.1007/978-3-319-21569-3_3.
DG Connect, “A European strategy on the data value
chain,” (2013).
T. Fernandez, N. Rivera, W. Xu, A. Gretton, “Ker-
nelized stein discrepancy tests of goodness-of-fit for
time-to-event data.” In International Conference on
Machine Learning, (2020) : 3112-3122.
Infocomm and Media Development Authority
(IMDA), Personal Data Protection Commission (PDPC),
& Intellectual Property Office Of Singapore. “Guide
to data valuation for data sharing,” (2019), p. 42. Re-
trieved from https://www2.imda.gov.sg/AI-and-Data.
Ocean Tomo, “Intangible-asset-market-value-study,”
(2021). Retrieved from: https://www.oceantomo.com/
intangible-asset-market-value-study/.
C. Shapiro, H.R. Varian, S. Carl “Information rules:
A strategic guide to the network economy.” Harvard
Business Press, (1998).

More Related Content

Similar to How Does Data Create Economic Value_ Foundations For Valuation Models.pdf

Machine Learning On Big Data: Opportunities And Challenges- Future Research D...
Machine Learning On Big Data: Opportunities And Challenges- Future Research D...Machine Learning On Big Data: Opportunities And Challenges- Future Research D...
Machine Learning On Big Data: Opportunities And Challenges- Future Research D...PhD Assistance
 
A Special Report on Infrastructure Futures: Keeping Pace in the Era of Big Da...
A Special Report on Infrastructure Futures: Keeping Pace in the Era of Big Da...A Special Report on Infrastructure Futures: Keeping Pace in the Era of Big Da...
A Special Report on Infrastructure Futures: Keeping Pace in the Era of Big Da...IBM India Smarter Computing
 
Bloor Research Comparative costs and uses for data integration platforms
Bloor Research Comparative costs and uses for data integration platformsBloor Research Comparative costs and uses for data integration platforms
Bloor Research Comparative costs and uses for data integration platformsFiona Lew
 
Improving the Capabilities of Large Language Model based Marketing Analytics ...
Improving the Capabilities of Large Language Model based Marketing Analytics ...Improving the Capabilities of Large Language Model based Marketing Analytics ...
Improving the Capabilities of Large Language Model based Marketing Analytics ...IJCI JOURNAL
 
Encrypted Data Management With Deduplication In Cloud...
Encrypted Data Management With Deduplication In Cloud...Encrypted Data Management With Deduplication In Cloud...
Encrypted Data Management With Deduplication In Cloud...Angie Jorgensen
 
CASE STUDY ON METHODS AND TOOLS FOR THE BIG DATA ANALYSIS
CASE STUDY ON METHODS AND TOOLS FOR THE BIG DATA ANALYSISCASE STUDY ON METHODS AND TOOLS FOR THE BIG DATA ANALYSIS
CASE STUDY ON METHODS AND TOOLS FOR THE BIG DATA ANALYSISIRJET Journal
 
ANALYSIS OF SYSTEM ON CHIP DESIGN USING ARTIFICIAL INTELLIGENCE
ANALYSIS OF SYSTEM ON CHIP DESIGN USING ARTIFICIAL INTELLIGENCEANALYSIS OF SYSTEM ON CHIP DESIGN USING ARTIFICIAL INTELLIGENCE
ANALYSIS OF SYSTEM ON CHIP DESIGN USING ARTIFICIAL INTELLIGENCEijesajournal
 
ANALYSIS OF SYSTEM ON CHIP DESIGN USING ARTIFICIAL INTELLIGENCE
ANALYSIS OF SYSTEM ON CHIP DESIGN USING ARTIFICIAL INTELLIGENCEANALYSIS OF SYSTEM ON CHIP DESIGN USING ARTIFICIAL INTELLIGENCE
ANALYSIS OF SYSTEM ON CHIP DESIGN USING ARTIFICIAL INTELLIGENCEijesajournal
 
ANALYSIS OF SYSTEM ON CHIP DESIGN USING ARTIFICIAL INTELLIGENCE
ANALYSIS OF SYSTEM ON CHIP DESIGN USING ARTIFICIAL INTELLIGENCEANALYSIS OF SYSTEM ON CHIP DESIGN USING ARTIFICIAL INTELLIGENCE
ANALYSIS OF SYSTEM ON CHIP DESIGN USING ARTIFICIAL INTELLIGENCEijesajournal
 
Unlock the power of MLOps.pdf
Unlock the power of MLOps.pdfUnlock the power of MLOps.pdf
Unlock the power of MLOps.pdfStephenAmell4
 
Unlock the power of MLOps.pdf
Unlock the power of MLOps.pdfUnlock the power of MLOps.pdf
Unlock the power of MLOps.pdfAnastasiaSteele10
 
Unlock the power of MLOps.pdf
Unlock the power of MLOps.pdfUnlock the power of MLOps.pdf
Unlock the power of MLOps.pdfJamieDornan2
 
Machine Learning: The First Salvo of the AI Business Revolution
Machine Learning: The First Salvo of the AI Business RevolutionMachine Learning: The First Salvo of the AI Business Revolution
Machine Learning: The First Salvo of the AI Business RevolutionCognizant
 
Data mining software comparison
Data mining software comparison Data mining software comparison
Data mining software comparison Esteban Alcaide
 
IRJET- A Survey on Mining of Tweeter Data for Predicting User Behavior
IRJET- A Survey on Mining of Tweeter Data for Predicting User BehaviorIRJET- A Survey on Mining of Tweeter Data for Predicting User Behavior
IRJET- A Survey on Mining of Tweeter Data for Predicting User BehaviorIRJET Journal
 
Customer churn analysis using XGBoosted decision trees
Customer churn analysis using XGBoosted decision treesCustomer churn analysis using XGBoosted decision trees
Customer churn analysis using XGBoosted decision treesnooriasukmaningtyas
 
Business Analysis using Machine Learning
Business Analysis using Machine LearningBusiness Analysis using Machine Learning
Business Analysis using Machine LearningIRJET Journal
 

Similar to How Does Data Create Economic Value_ Foundations For Valuation Models.pdf (20)

Machine Learning On Big Data: Opportunities And Challenges- Future Research D...
Machine Learning On Big Data: Opportunities And Challenges- Future Research D...Machine Learning On Big Data: Opportunities And Challenges- Future Research D...
Machine Learning On Big Data: Opportunities And Challenges- Future Research D...
 
Cloud Analytics Playbook
Cloud Analytics PlaybookCloud Analytics Playbook
Cloud Analytics Playbook
 
A Special Report on Infrastructure Futures: Keeping Pace in the Era of Big Da...
A Special Report on Infrastructure Futures: Keeping Pace in the Era of Big Da...A Special Report on Infrastructure Futures: Keeping Pace in the Era of Big Da...
A Special Report on Infrastructure Futures: Keeping Pace in the Era of Big Da...
 
Bloor Research Comparative costs and uses for data integration platforms
Bloor Research Comparative costs and uses for data integration platformsBloor Research Comparative costs and uses for data integration platforms
Bloor Research Comparative costs and uses for data integration platforms
 
Improving the Capabilities of Large Language Model based Marketing Analytics ...
Improving the Capabilities of Large Language Model based Marketing Analytics ...Improving the Capabilities of Large Language Model based Marketing Analytics ...
Improving the Capabilities of Large Language Model based Marketing Analytics ...
 
Encrypted Data Management With Deduplication In Cloud...
Encrypted Data Management With Deduplication In Cloud...Encrypted Data Management With Deduplication In Cloud...
Encrypted Data Management With Deduplication In Cloud...
 
CASE STUDY ON METHODS AND TOOLS FOR THE BIG DATA ANALYSIS
CASE STUDY ON METHODS AND TOOLS FOR THE BIG DATA ANALYSISCASE STUDY ON METHODS AND TOOLS FOR THE BIG DATA ANALYSIS
CASE STUDY ON METHODS AND TOOLS FOR THE BIG DATA ANALYSIS
 
ANALYSIS OF SYSTEM ON CHIP DESIGN USING ARTIFICIAL INTELLIGENCE
ANALYSIS OF SYSTEM ON CHIP DESIGN USING ARTIFICIAL INTELLIGENCEANALYSIS OF SYSTEM ON CHIP DESIGN USING ARTIFICIAL INTELLIGENCE
ANALYSIS OF SYSTEM ON CHIP DESIGN USING ARTIFICIAL INTELLIGENCE
 
ANALYSIS OF SYSTEM ON CHIP DESIGN USING ARTIFICIAL INTELLIGENCE
ANALYSIS OF SYSTEM ON CHIP DESIGN USING ARTIFICIAL INTELLIGENCEANALYSIS OF SYSTEM ON CHIP DESIGN USING ARTIFICIAL INTELLIGENCE
ANALYSIS OF SYSTEM ON CHIP DESIGN USING ARTIFICIAL INTELLIGENCE
 
ANALYSIS OF SYSTEM ON CHIP DESIGN USING ARTIFICIAL INTELLIGENCE
ANALYSIS OF SYSTEM ON CHIP DESIGN USING ARTIFICIAL INTELLIGENCEANALYSIS OF SYSTEM ON CHIP DESIGN USING ARTIFICIAL INTELLIGENCE
ANALYSIS OF SYSTEM ON CHIP DESIGN USING ARTIFICIAL INTELLIGENCE
 
Unlock the power of MLOps.pdf
Unlock the power of MLOps.pdfUnlock the power of MLOps.pdf
Unlock the power of MLOps.pdf
 
Unlock the power of MLOps.pdf
Unlock the power of MLOps.pdfUnlock the power of MLOps.pdf
Unlock the power of MLOps.pdf
 
Unlock the power of MLOps.pdf
Unlock the power of MLOps.pdfUnlock the power of MLOps.pdf
Unlock the power of MLOps.pdf
 
Machine Learning: The First Salvo of the AI Business Revolution
Machine Learning: The First Salvo of the AI Business RevolutionMachine Learning: The First Salvo of the AI Business Revolution
Machine Learning: The First Salvo of the AI Business Revolution
 
Data mining software comparison
Data mining software comparison Data mining software comparison
Data mining software comparison
 
IRJET- A Survey on Mining of Tweeter Data for Predicting User Behavior
IRJET- A Survey on Mining of Tweeter Data for Predicting User BehaviorIRJET- A Survey on Mining of Tweeter Data for Predicting User Behavior
IRJET- A Survey on Mining of Tweeter Data for Predicting User Behavior
 
AI Trends.pdf
AI Trends.pdfAI Trends.pdf
AI Trends.pdf
 
Article-V16
Article-V16Article-V16
Article-V16
 
Customer churn analysis using XGBoosted decision trees
Customer churn analysis using XGBoosted decision treesCustomer churn analysis using XGBoosted decision trees
Customer churn analysis using XGBoosted decision trees
 
Business Analysis using Machine Learning
Business Analysis using Machine LearningBusiness Analysis using Machine Learning
Business Analysis using Machine Learning
 

More from Dr. Anke Nestler

Fair licence-fee valuation using the profit split method
Fair licence-fee valuation using the profit split methodFair licence-fee valuation using the profit split method
Fair licence-fee valuation using the profit split methodDr. Anke Nestler
 
BDU Grundsätze ordnungsgemäßer Markenbewertung Nestler 2016
BDU Grundsätze ordnungsgemäßer Markenbewertung Nestler 2016BDU Grundsätze ordnungsgemäßer Markenbewertung Nestler 2016
BDU Grundsätze ordnungsgemäßer Markenbewertung Nestler 2016Dr. Anke Nestler
 
Valuation of Intangibles and Trademarks / Bewertung von IP und Marken
Valuation of Intangibles and Trademarks / Bewertung von IP und MarkenValuation of Intangibles and Trademarks / Bewertung von IP und Marken
Valuation of Intangibles and Trademarks / Bewertung von IP und MarkenDr. Anke Nestler
 
Accounting for trademarks - indefiniteness is no more than an interim solutio...
Accounting for trademarks - indefiniteness is no more than an interim solutio...Accounting for trademarks - indefiniteness is no more than an interim solutio...
Accounting for trademarks - indefiniteness is no more than an interim solutio...Dr. Anke Nestler
 
Valuation of intangibles and trademarks - Bewertung von Immateriellem Vermöge...
Valuation of intangibles and trademarks - Bewertung von Immateriellem Vermöge...Valuation of intangibles and trademarks - Bewertung von Immateriellem Vermöge...
Valuation of intangibles and trademarks - Bewertung von Immateriellem Vermöge...Dr. Anke Nestler
 
Uebliche Markenlizenzraten - Betriebsberater 04/2015 - Lizenzen - Bewertung
Uebliche Markenlizenzraten - Betriebsberater 04/2015 - Lizenzen - BewertungUebliche Markenlizenzraten - Betriebsberater 04/2015 - Lizenzen - Bewertung
Uebliche Markenlizenzraten - Betriebsberater 04/2015 - Lizenzen - BewertungDr. Anke Nestler
 
Verfahren zur Bewertung von Reporting Units im Rahmen des Goodwill-Impairment...
Verfahren zur Bewertung von Reporting Units im Rahmen des Goodwill-Impairment...Verfahren zur Bewertung von Reporting Units im Rahmen des Goodwill-Impairment...
Verfahren zur Bewertung von Reporting Units im Rahmen des Goodwill-Impairment...Dr. Anke Nestler
 
Fair-Value-Bilanzierung macht Markenwerte transparenter
Fair-Value-Bilanzierung macht Markenwerte transparenterFair-Value-Bilanzierung macht Markenwerte transparenter
Fair-Value-Bilanzierung macht Markenwerte transparenterDr. Anke Nestler
 
Iww bewert ivg_03_2003_v0.0
Iww bewert ivg_03_2003_v0.0Iww bewert ivg_03_2003_v0.0
Iww bewert ivg_03_2003_v0.0Dr. Anke Nestler
 
Die Bewertung von Unternehmen mit dem Discounted Cash Flow Verfahren
Die Bewertung von Unternehmen mit dem Discounted Cash Flow VerfahrenDie Bewertung von Unternehmen mit dem Discounted Cash Flow Verfahren
Die Bewertung von Unternehmen mit dem Discounted Cash Flow VerfahrenDr. Anke Nestler
 
Entwicklungen im Bereich internationaler Verrechnungspreise
Entwicklungen im Bereich internationaler Verrechnungspreise Entwicklungen im Bereich internationaler Verrechnungspreise
Entwicklungen im Bereich internationaler Verrechnungspreise Dr. Anke Nestler
 
Die bewertung von unt. multiplikatormethode2003
Die bewertung von unt. multiplikatormethode2003Die bewertung von unt. multiplikatormethode2003
Die bewertung von unt. multiplikatormethode2003Dr. Anke Nestler
 
Fair value steht im Mittelpunkt der internationalen Rechnungslegungsvorschriften
Fair value steht im Mittelpunkt der internationalen RechnungslegungsvorschriftenFair value steht im Mittelpunkt der internationalen Rechnungslegungsvorschriften
Fair value steht im Mittelpunkt der internationalen RechnungslegungsvorschriftenDr. Anke Nestler
 
Bewertung des Kundenstamms
Bewertung des Kundenstamms Bewertung des Kundenstamms
Bewertung des Kundenstamms Dr. Anke Nestler
 
Bewertung von Webseiten und Domains
Bewertung von Webseiten und DomainsBewertung von Webseiten und Domains
Bewertung von Webseiten und DomainsDr. Anke Nestler
 
Unternehmenswert / Bewertungsstandard
Unternehmenswert / BewertungsstandardUnternehmenswert / Bewertungsstandard
Unternehmenswert / BewertungsstandardDr. Anke Nestler
 
Unternehmenswerte nach neuen Kriterien ermitteln
Unternehmenswerte nach neuen Kriterien ermittelnUnternehmenswerte nach neuen Kriterien ermitteln
Unternehmenswerte nach neuen Kriterien ermittelnDr. Anke Nestler
 
Bewertung von Leasingfirmen / Cashflow
Bewertung von Leasingfirmen / CashflowBewertung von Leasingfirmen / Cashflow
Bewertung von Leasingfirmen / CashflowDr. Anke Nestler
 

More from Dr. Anke Nestler (20)

Fair licence-fee valuation using the profit split method
Fair licence-fee valuation using the profit split methodFair licence-fee valuation using the profit split method
Fair licence-fee valuation using the profit split method
 
BDU Grundsätze ordnungsgemäßer Markenbewertung Nestler 2016
BDU Grundsätze ordnungsgemäßer Markenbewertung Nestler 2016BDU Grundsätze ordnungsgemäßer Markenbewertung Nestler 2016
BDU Grundsätze ordnungsgemäßer Markenbewertung Nestler 2016
 
Valuation of Intangibles and Trademarks / Bewertung von IP und Marken
Valuation of Intangibles and Trademarks / Bewertung von IP und MarkenValuation of Intangibles and Trademarks / Bewertung von IP und Marken
Valuation of Intangibles and Trademarks / Bewertung von IP und Marken
 
Accounting for trademarks - indefiniteness is no more than an interim solutio...
Accounting for trademarks - indefiniteness is no more than an interim solutio...Accounting for trademarks - indefiniteness is no more than an interim solutio...
Accounting for trademarks - indefiniteness is no more than an interim solutio...
 
Valuation of intangibles and trademarks - Bewertung von Immateriellem Vermöge...
Valuation of intangibles and trademarks - Bewertung von Immateriellem Vermöge...Valuation of intangibles and trademarks - Bewertung von Immateriellem Vermöge...
Valuation of intangibles and trademarks - Bewertung von Immateriellem Vermöge...
 
Uebliche Markenlizenzraten - Betriebsberater 04/2015 - Lizenzen - Bewertung
Uebliche Markenlizenzraten - Betriebsberater 04/2015 - Lizenzen - BewertungUebliche Markenlizenzraten - Betriebsberater 04/2015 - Lizenzen - Bewertung
Uebliche Markenlizenzraten - Betriebsberater 04/2015 - Lizenzen - Bewertung
 
Verfahren zur Bewertung von Reporting Units im Rahmen des Goodwill-Impairment...
Verfahren zur Bewertung von Reporting Units im Rahmen des Goodwill-Impairment...Verfahren zur Bewertung von Reporting Units im Rahmen des Goodwill-Impairment...
Verfahren zur Bewertung von Reporting Units im Rahmen des Goodwill-Impairment...
 
Fair-Value-Bilanzierung macht Markenwerte transparenter
Fair-Value-Bilanzierung macht Markenwerte transparenterFair-Value-Bilanzierung macht Markenwerte transparenter
Fair-Value-Bilanzierung macht Markenwerte transparenter
 
Iww bewert ivg_03_2003_v0.0
Iww bewert ivg_03_2003_v0.0Iww bewert ivg_03_2003_v0.0
Iww bewert ivg_03_2003_v0.0
 
Die Bewertung von Unternehmen mit dem Discounted Cash Flow Verfahren
Die Bewertung von Unternehmen mit dem Discounted Cash Flow VerfahrenDie Bewertung von Unternehmen mit dem Discounted Cash Flow Verfahren
Die Bewertung von Unternehmen mit dem Discounted Cash Flow Verfahren
 
Entwicklungen im Bereich internationaler Verrechnungspreise
Entwicklungen im Bereich internationaler Verrechnungspreise Entwicklungen im Bereich internationaler Verrechnungspreise
Entwicklungen im Bereich internationaler Verrechnungspreise
 
Die bewertung von unt. multiplikatormethode2003
Die bewertung von unt. multiplikatormethode2003Die bewertung von unt. multiplikatormethode2003
Die bewertung von unt. multiplikatormethode2003
 
Fair value steht im Mittelpunkt der internationalen Rechnungslegungsvorschriften
Fair value steht im Mittelpunkt der internationalen RechnungslegungsvorschriftenFair value steht im Mittelpunkt der internationalen Rechnungslegungsvorschriften
Fair value steht im Mittelpunkt der internationalen Rechnungslegungsvorschriften
 
Bewertung des Kundenstamms
Bewertung des Kundenstamms Bewertung des Kundenstamms
Bewertung des Kundenstamms
 
Bewertung von Webseiten und Domains
Bewertung von Webseiten und DomainsBewertung von Webseiten und Domains
Bewertung von Webseiten und Domains
 
Unternehmenswert / Bewertungsstandard
Unternehmenswert / BewertungsstandardUnternehmenswert / Bewertungsstandard
Unternehmenswert / Bewertungsstandard
 
Unternehmenswerte nach neuen Kriterien ermitteln
Unternehmenswerte nach neuen Kriterien ermittelnUnternehmenswerte nach neuen Kriterien ermitteln
Unternehmenswerte nach neuen Kriterien ermitteln
 
Beteiligungsbilanzierung
BeteiligungsbilanzierungBeteiligungsbilanzierung
Beteiligungsbilanzierung
 
Der Wert der Marke
Der Wert der MarkeDer Wert der Marke
Der Wert der Marke
 
Bewertung von Leasingfirmen / Cashflow
Bewertung von Leasingfirmen / CashflowBewertung von Leasingfirmen / Cashflow
Bewertung von Leasingfirmen / Cashflow
 

Recently uploaded

Vadodara 💋 Call Girl 7737669865 Call Girls in Vadodara Escort service book now
Vadodara 💋 Call Girl 7737669865 Call Girls in Vadodara Escort service book nowVadodara 💋 Call Girl 7737669865 Call Girls in Vadodara Escort service book now
Vadodara 💋 Call Girl 7737669865 Call Girls in Vadodara Escort service book nowgargpaaro
 
怎样办理圣地亚哥州立大学毕业证(SDSU毕业证书)成绩单学校原版复制
怎样办理圣地亚哥州立大学毕业证(SDSU毕业证书)成绩单学校原版复制怎样办理圣地亚哥州立大学毕业证(SDSU毕业证书)成绩单学校原版复制
怎样办理圣地亚哥州立大学毕业证(SDSU毕业证书)成绩单学校原版复制vexqp
 
Discover Why Less is More in B2B Research
Discover Why Less is More in B2B ResearchDiscover Why Less is More in B2B Research
Discover Why Less is More in B2B Researchmichael115558
 
Jual Obat Aborsi Surabaya ( Asli No.1 ) 085657271886 Obat Penggugur Kandungan...
Jual Obat Aborsi Surabaya ( Asli No.1 ) 085657271886 Obat Penggugur Kandungan...Jual Obat Aborsi Surabaya ( Asli No.1 ) 085657271886 Obat Penggugur Kandungan...
Jual Obat Aborsi Surabaya ( Asli No.1 ) 085657271886 Obat Penggugur Kandungan...ZurliaSoop
 
Data Analyst Tasks to do the internship.pdf
Data Analyst Tasks to do the internship.pdfData Analyst Tasks to do the internship.pdf
Data Analyst Tasks to do the internship.pdftheeltifs
 
怎样办理伦敦大学毕业证(UoL毕业证书)成绩单学校原版复制
怎样办理伦敦大学毕业证(UoL毕业证书)成绩单学校原版复制怎样办理伦敦大学毕业证(UoL毕业证书)成绩单学校原版复制
怎样办理伦敦大学毕业证(UoL毕业证书)成绩单学校原版复制vexqp
 
In Riyadh ((+919101817206)) Cytotec kit @ Abortion Pills Saudi Arabia
In Riyadh ((+919101817206)) Cytotec kit @ Abortion Pills Saudi ArabiaIn Riyadh ((+919101817206)) Cytotec kit @ Abortion Pills Saudi Arabia
In Riyadh ((+919101817206)) Cytotec kit @ Abortion Pills Saudi Arabiaahmedjiabur940
 
Lecture_2_Deep_Learning_Overview-newone1
Lecture_2_Deep_Learning_Overview-newone1Lecture_2_Deep_Learning_Overview-newone1
Lecture_2_Deep_Learning_Overview-newone1ranjankumarbehera14
 
PLE-statistics document for primary schs
PLE-statistics document for primary schsPLE-statistics document for primary schs
PLE-statistics document for primary schscnajjemba
 
Top profile Call Girls In bhavnagar [ 7014168258 ] Call Me For Genuine Models...
Top profile Call Girls In bhavnagar [ 7014168258 ] Call Me For Genuine Models...Top profile Call Girls In bhavnagar [ 7014168258 ] Call Me For Genuine Models...
Top profile Call Girls In bhavnagar [ 7014168258 ] Call Me For Genuine Models...gajnagarg
 
DATA SUMMIT 24 Building Real-Time Pipelines With FLaNK
DATA SUMMIT 24  Building Real-Time Pipelines With FLaNKDATA SUMMIT 24  Building Real-Time Pipelines With FLaNK
DATA SUMMIT 24 Building Real-Time Pipelines With FLaNKTimothy Spann
 
5CL-ADBA,5cladba, Chinese supplier, safety is guaranteed
5CL-ADBA,5cladba, Chinese supplier, safety is guaranteed5CL-ADBA,5cladba, Chinese supplier, safety is guaranteed
5CL-ADBA,5cladba, Chinese supplier, safety is guaranteedamy56318795
 
Top profile Call Girls In Vadodara [ 7014168258 ] Call Me For Genuine Models ...
Top profile Call Girls In Vadodara [ 7014168258 ] Call Me For Genuine Models ...Top profile Call Girls In Vadodara [ 7014168258 ] Call Me For Genuine Models ...
Top profile Call Girls In Vadodara [ 7014168258 ] Call Me For Genuine Models ...gajnagarg
 
Jual Cytotec Asli Obat Aborsi No. 1 Paling Manjur
Jual Cytotec Asli Obat Aborsi No. 1 Paling ManjurJual Cytotec Asli Obat Aborsi No. 1 Paling Manjur
Jual Cytotec Asli Obat Aborsi No. 1 Paling Manjurptikerjasaptiker
 
怎样办理纽约州立大学宾汉姆顿分校毕业证(SUNY-Bin毕业证书)成绩单学校原版复制
怎样办理纽约州立大学宾汉姆顿分校毕业证(SUNY-Bin毕业证书)成绩单学校原版复制怎样办理纽约州立大学宾汉姆顿分校毕业证(SUNY-Bin毕业证书)成绩单学校原版复制
怎样办理纽约州立大学宾汉姆顿分校毕业证(SUNY-Bin毕业证书)成绩单学校原版复制vexqp
 
The-boAt-Story-Navigating-the-Waves-of-Innovation.pptx
The-boAt-Story-Navigating-the-Waves-of-Innovation.pptxThe-boAt-Story-Navigating-the-Waves-of-Innovation.pptx
The-boAt-Story-Navigating-the-Waves-of-Innovation.pptxVivek487417
 
怎样办理旧金山城市学院毕业证(CCSF毕业证书)成绩单学校原版复制
怎样办理旧金山城市学院毕业证(CCSF毕业证书)成绩单学校原版复制怎样办理旧金山城市学院毕业证(CCSF毕业证书)成绩单学校原版复制
怎样办理旧金山城市学院毕业证(CCSF毕业证书)成绩单学校原版复制vexqp
 
Top profile Call Girls In dimapur [ 7014168258 ] Call Me For Genuine Models W...
Top profile Call Girls In dimapur [ 7014168258 ] Call Me For Genuine Models W...Top profile Call Girls In dimapur [ 7014168258 ] Call Me For Genuine Models W...
Top profile Call Girls In dimapur [ 7014168258 ] Call Me For Genuine Models W...gajnagarg
 
怎样办理伦敦大学城市学院毕业证(CITY毕业证书)成绩单学校原版复制
怎样办理伦敦大学城市学院毕业证(CITY毕业证书)成绩单学校原版复制怎样办理伦敦大学城市学院毕业证(CITY毕业证书)成绩单学校原版复制
怎样办理伦敦大学城市学院毕业证(CITY毕业证书)成绩单学校原版复制vexqp
 
Dubai Call Girls Peeing O525547819 Call Girls Dubai
Dubai Call Girls Peeing O525547819 Call Girls DubaiDubai Call Girls Peeing O525547819 Call Girls Dubai
Dubai Call Girls Peeing O525547819 Call Girls Dubaikojalkojal131
 

Recently uploaded (20)

Vadodara 💋 Call Girl 7737669865 Call Girls in Vadodara Escort service book now
Vadodara 💋 Call Girl 7737669865 Call Girls in Vadodara Escort service book nowVadodara 💋 Call Girl 7737669865 Call Girls in Vadodara Escort service book now
Vadodara 💋 Call Girl 7737669865 Call Girls in Vadodara Escort service book now
 
怎样办理圣地亚哥州立大学毕业证(SDSU毕业证书)成绩单学校原版复制
怎样办理圣地亚哥州立大学毕业证(SDSU毕业证书)成绩单学校原版复制怎样办理圣地亚哥州立大学毕业证(SDSU毕业证书)成绩单学校原版复制
怎样办理圣地亚哥州立大学毕业证(SDSU毕业证书)成绩单学校原版复制
 
Discover Why Less is More in B2B Research
Discover Why Less is More in B2B ResearchDiscover Why Less is More in B2B Research
Discover Why Less is More in B2B Research
 
Jual Obat Aborsi Surabaya ( Asli No.1 ) 085657271886 Obat Penggugur Kandungan...
Jual Obat Aborsi Surabaya ( Asli No.1 ) 085657271886 Obat Penggugur Kandungan...Jual Obat Aborsi Surabaya ( Asli No.1 ) 085657271886 Obat Penggugur Kandungan...
Jual Obat Aborsi Surabaya ( Asli No.1 ) 085657271886 Obat Penggugur Kandungan...
 
Data Analyst Tasks to do the internship.pdf
Data Analyst Tasks to do the internship.pdfData Analyst Tasks to do the internship.pdf
Data Analyst Tasks to do the internship.pdf
 
怎样办理伦敦大学毕业证(UoL毕业证书)成绩单学校原版复制
怎样办理伦敦大学毕业证(UoL毕业证书)成绩单学校原版复制怎样办理伦敦大学毕业证(UoL毕业证书)成绩单学校原版复制
怎样办理伦敦大学毕业证(UoL毕业证书)成绩单学校原版复制
 
In Riyadh ((+919101817206)) Cytotec kit @ Abortion Pills Saudi Arabia
In Riyadh ((+919101817206)) Cytotec kit @ Abortion Pills Saudi ArabiaIn Riyadh ((+919101817206)) Cytotec kit @ Abortion Pills Saudi Arabia
In Riyadh ((+919101817206)) Cytotec kit @ Abortion Pills Saudi Arabia
 
Lecture_2_Deep_Learning_Overview-newone1
Lecture_2_Deep_Learning_Overview-newone1Lecture_2_Deep_Learning_Overview-newone1
Lecture_2_Deep_Learning_Overview-newone1
 
PLE-statistics document for primary schs
PLE-statistics document for primary schsPLE-statistics document for primary schs
PLE-statistics document for primary schs
 
Top profile Call Girls In bhavnagar [ 7014168258 ] Call Me For Genuine Models...
Top profile Call Girls In bhavnagar [ 7014168258 ] Call Me For Genuine Models...Top profile Call Girls In bhavnagar [ 7014168258 ] Call Me For Genuine Models...
Top profile Call Girls In bhavnagar [ 7014168258 ] Call Me For Genuine Models...
 
DATA SUMMIT 24 Building Real-Time Pipelines With FLaNK
DATA SUMMIT 24  Building Real-Time Pipelines With FLaNKDATA SUMMIT 24  Building Real-Time Pipelines With FLaNK
DATA SUMMIT 24 Building Real-Time Pipelines With FLaNK
 
5CL-ADBA,5cladba, Chinese supplier, safety is guaranteed
5CL-ADBA,5cladba, Chinese supplier, safety is guaranteed5CL-ADBA,5cladba, Chinese supplier, safety is guaranteed
5CL-ADBA,5cladba, Chinese supplier, safety is guaranteed
 
Top profile Call Girls In Vadodara [ 7014168258 ] Call Me For Genuine Models ...
Top profile Call Girls In Vadodara [ 7014168258 ] Call Me For Genuine Models ...Top profile Call Girls In Vadodara [ 7014168258 ] Call Me For Genuine Models ...
Top profile Call Girls In Vadodara [ 7014168258 ] Call Me For Genuine Models ...
 
Jual Cytotec Asli Obat Aborsi No. 1 Paling Manjur
Jual Cytotec Asli Obat Aborsi No. 1 Paling ManjurJual Cytotec Asli Obat Aborsi No. 1 Paling Manjur
Jual Cytotec Asli Obat Aborsi No. 1 Paling Manjur
 
怎样办理纽约州立大学宾汉姆顿分校毕业证(SUNY-Bin毕业证书)成绩单学校原版复制
怎样办理纽约州立大学宾汉姆顿分校毕业证(SUNY-Bin毕业证书)成绩单学校原版复制怎样办理纽约州立大学宾汉姆顿分校毕业证(SUNY-Bin毕业证书)成绩单学校原版复制
怎样办理纽约州立大学宾汉姆顿分校毕业证(SUNY-Bin毕业证书)成绩单学校原版复制
 
The-boAt-Story-Navigating-the-Waves-of-Innovation.pptx
The-boAt-Story-Navigating-the-Waves-of-Innovation.pptxThe-boAt-Story-Navigating-the-Waves-of-Innovation.pptx
The-boAt-Story-Navigating-the-Waves-of-Innovation.pptx
 
怎样办理旧金山城市学院毕业证(CCSF毕业证书)成绩单学校原版复制
怎样办理旧金山城市学院毕业证(CCSF毕业证书)成绩单学校原版复制怎样办理旧金山城市学院毕业证(CCSF毕业证书)成绩单学校原版复制
怎样办理旧金山城市学院毕业证(CCSF毕业证书)成绩单学校原版复制
 
Top profile Call Girls In dimapur [ 7014168258 ] Call Me For Genuine Models W...
Top profile Call Girls In dimapur [ 7014168258 ] Call Me For Genuine Models W...Top profile Call Girls In dimapur [ 7014168258 ] Call Me For Genuine Models W...
Top profile Call Girls In dimapur [ 7014168258 ] Call Me For Genuine Models W...
 
怎样办理伦敦大学城市学院毕业证(CITY毕业证书)成绩单学校原版复制
怎样办理伦敦大学城市学院毕业证(CITY毕业证书)成绩单学校原版复制怎样办理伦敦大学城市学院毕业证(CITY毕业证书)成绩单学校原版复制
怎样办理伦敦大学城市学院毕业证(CITY毕业证书)成绩单学校原版复制
 
Dubai Call Girls Peeing O525547819 Call Girls Dubai
Dubai Call Girls Peeing O525547819 Call Girls DubaiDubai Call Girls Peeing O525547819 Call Girls Dubai
Dubai Call Girls Peeing O525547819 Call Girls Dubai
 

How Does Data Create Economic Value_ Foundations For Valuation Models.pdf

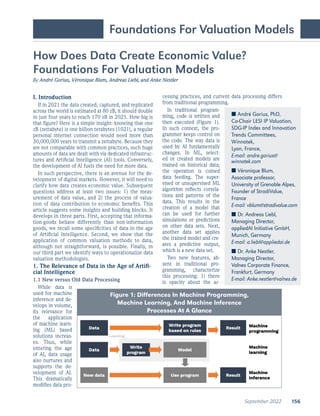
  • 1. September 2022 156 Foundations For Valuation Models I. Introduction If in 2021 the data created, captured, and replicated across the world is estimated at 80 zB, it should double in just four years to reach 170 zB in 2025. How big is that figure? Here is a simple insight: knowing that one zB (zettabyte) is one billion terabytes (1021), a regular personal internet connection would need more than 30,000,000 years to transmit a zettabyte. Because they are not comparable with common practices, such huge amounts of data are dealt with via dedicated infrastruc- tures and Artificial Intelligence (AI) tools. Conversely, the development of AI fuels the need for more data. In such perspective, there is an avenue for the de- velopment of digital markets. However, it will need to clarify how data creates economic value. Subsequent questions address at least two issues: 1) the meas- urement of data value, and 2) the process of valua- tion of data contribution to economic benefits. This article suggests some insights and building blocks. It develops in three parts. First, accepting that informa- tion-goods behave differently than non-information goods, we recall some specificities of data in the age of Artificial Intelligence. Second, we show that the application of common valuation methods to data, although not straightforward, is possible. Finally, in our third part we identify ways to operationalize data valuation methodologies. 1. The Relevance of Data in the Age of Artifi- cial Intelligence 1.1 New versus Old Data Processing While data is used for machine inference and de- velops in volume, its relevance for the application of machine learn- ing (ML) based solutions increas- es. Thus, while entering the age of AI, data usage also nurtures and supports the de- velopment of AI. This dramatically modifies data pro- How Does Data Create Economic Value? Foundations For Valuation Models By André Gorius, Véronique Blum, Andreas Liebl, and Anke Nestler ■ André Gorius, PhD, Co-Chair LESI IP Valuation, SDG-IP Index and Innovation Trends Committees, Winnotek, Lyon, France, E-mail: andre.gorius@ winnotek.com ■ Véronique Blum, Associate professor, University of Grenoble Alpes, Founder of StradiValue, France E-mail: vblum@stradivalue.com ■ Dr. Andreas Liebl, Managing Director, appliedAI Initiative GmbH, Munich, Germany E-mail: a.liebl@appliedai.de ■ Dr. Anke Nestler, Managing Director, Valnes Corporate Finance, Frankfurt, Germany E-mail: Anke.nestler@valnes.de cessing practices, and current data processing differs from traditional programming. In traditional program- ming, code is written and then executed (Figure 1). In such context, the pro- grammer keeps control on the code. The way data is used by AI fundamentally changes. In ML, select- ed or created models are trained on historical data; the operation is coined data feeding. The super- vised or unsupervised ML algorithm reflects correla- tions and patterns of the data. This results in the creation of a model that can be used for further simulations or predictions on other data sets. Next, another data set applies the trained model and cre- ates a predictive output, which is a new data set. Two new features, ab- sent in traditional pro- gramming, characterize this processing: 1) there is opacity about the ac- Figure 1: Differences In Machine Programming, Machine Learning, And Machine Inference Processes At A Glance
  • 2. les Nouvelles 157 Foundations For Valuation Models tions conducted by the ML model, and 2) there is a significant dependency on the data that was used for training because, contrary to theory-derived models, data is embedded in the ML model construction (“data is the new code”). Concretely, the same operation run on a different data set will result in a different model. It follows that the relevance of the obtained results depends on both the quality of the ML model and of the data. Thus, data is part of the solution, and without data the solution is useless. For these reasons, the development of AI addresses issues related to the value of the data used for train- ing and validation as well as the value created by data while contributing to AI processes, or before its contri- bution. Those are IP and valuation issues that in prac- tice usually remain unquestioned at the early testing and experimentations stages, as those are quite easy to run. However, they become prominent when one reaches a scaling stage. 1.2 New IP Challenges in the Era of AI The following paragraphs roughly describe the AI data processing operation at the aforementioned stag- es: the training stage and the inference stage. 1.2.1 The Training Stage At the training stage, an AI tool uses (mostly) big sets of historical data, likely combining public and pro- prietary data. This raises some issues. First, once used to train for machine learning, it becomes difficult to isolate the combined data out of the model. Second, out of the multiple feeding data sets, it is difficult to identify the contribution of a single data source to the model. Hence, some data sets or subsets could be- come significantly useful while others contribute only marginally. Third, since the data sets used for training require some preparation, the assessment of the effort put in the preparation is also a challenge. Current usages suggest that data merged with do- main knowledge for model design results in the most promising applications for businesses. Further, huge efforts in research are done to reduce the amount of data needed for training. Thus, there are paths for ex- ploring optimized processes that will likely change the dependency on specific data, while increasing the rele- vance of pretrained models. At that stage, data ownership issues are already manifold. For example, one could run a ML model thanks to licensed data. Several questions follow: 1) Who owns the data? 2) Can one lose ownership? 3) Is a revocation of access to data possible? And 4) If 2 or 3 occurs, how will this impact the trained model? The clear identification of associated rights is rele- vant in that rights indicate where cash flows will be oriented once the AI model will generate economic benefits. Also, the use of proprietary data could di- minish risks associated to data processing. Thus, risk assessment becomes a key operation in data sharing strategy. This would include gauging the vulnerability of the model to the structure of rights or, when data contains potentially differentiating information, gaug- ing the vulnerability to the loss of competitive advan- tages. Indeed, similar to a recipe, most economic value depends on “secret ingredients” where one of the in- gredients is data. It follows that managerial challenges will include 1) the identification of the data sets to collect and use, and 2) those that can be shared, but also 3) how it can be shared, whether by giving limited or unlimited access, and/or exclusive rights. 1.2.2 The Inference Stage Similarly, at the inference stage there persists a high dependency to the provision of data. This is because the model runs on current data, often real time data, with as much contextual information as possible. It follows that without access to new data for further application, trained models remain useless. Moreover “updates” are conducted through retraining, therefore continuous access to the training data set is a condi- tion for operation. Beyond data volume, data quality is also an issue. Example 1.3 in Insert 1 illustrates how much quality is critical to ensure the marketability of an AI system. But data is not the only key input to produce a suc- cessful output of a training session. In addition to data, one has to define a suitable preprocessing and select the appropriate model that will achieve the highest lev- el of accuracy. For example, in the field of autonomous vehicles, 98 percent of accuracy is not sufficient; the target is beyond 99.9 percent. Notably, the marginal progress of less than two points is conducted through experimentations and can take years as it often requires hundreds or even thousands of training runs before the model reaches the expected accuracy. Hence, it requires significant investment in time and workforce. Methodo- logical choices made at that stage are potentially differ- entiating. The combination of domain knowledge and models are expected to result in the most stable and accurate output for the desired application. Finally, the model produces feedback loops that are fed by new data and that improve the model. In summary, the approach with which models are trained is a key enabler for fast- er and more reliable application development and can become a significant competitive advantage. This is sig- nificantly different than a traditional approach with a list of requirements one can work against. Ultimately, this results in unique and protectable applications combin- ing data with traditional software (Software 1.0) as well as ML-based components (Software 2.0), where tradi- tional software helps to bring the model to the field and make its usage intelligible. Later on the application needs maintenance, but the update of the model cannot be conducted with a
  • 3. September 2022 158 Foundations For Valuation Models simple patch and the model needs retrain- ing. As the environ- ment is dynamic, the model becomes less and less accurate and one needs to actualize it. This is called mod- el drift. It is a main- tenance issue that requires monitoring because the available data is also evolving with respect to the initial feed data. Fig- ure 2 illustrates the components of an AI application embed- ding data. Figure 2: The Development Steps of an AI Model Insert 1: Some Examples Of Data And ML Combined Applications Example 1.1: Language Models and the Appropriate Training Data GPT-3, a language model that uses deep learning to produce human-like texts, is trained on most data available on the Internet. Wu Dao 2.0, the largest and probably the most powerful neural net- work ever created, was trained on 4.9TB of text and graphic data in Chinese and English and counts 1.75 Billion parameters (https://towardsdatascience.com/gpt-3-scared-you-meet-wu-dao-2-0-a-mon- ster-of-1-75-trillion-parameters-832cd83db484). OpenAI, the creator of GPT-3, has put much effort in selecting data of higher quality, which reduced the amount of training data but increased the value. Moreover, OpenAI applied the latest model architectures (attention-based transformers) and developed a self-supervised training process. Other actors working on language models argue that their models might be of higher quality because they rely on proprietary data of the highest quality. However, many doubt that the addition of high-quality proprietary data will increase the quality of the application compared to the approach of OpenAI that refined public data and combined them with innovations in the training process and model architecture. Example 1.2: Facial Recognition and the Legal Framework Clearview, an American facial recognition company, collected images through crawling social media platforms. This has become a highly controversial way of collecting as much data as possible and combined images of faces with all other information that is (or was) available. As a result, they cre- ated a unique asset by their approach to data collection and aggregation, which is combined with state-of-the-art computer vision algorithms. This asset is now at the core of the company’s solution. In many countries, there is an ongoing discussion about the legal status of the data collection. Example 1.3: Cancer Detection and the Quality of Data Annotation A report highlighted that the IBM Watson application for cancer detection was biased by those doctors who initially labeled the data. This suggests that recommendations for treatments could potentially be biased by those who built the systems. Aware of the pitfall, users little adopted the system. In that case, IBM’s strategy consisted in putting a high effort on labeling data with the help of specialists. But the system is only as good as the data it is fed with. Therefore, in its attempt to create a unique proprietary data set, bias in data quality significantly reduced the economic value of the solution. Indeed, the assessment of the quality of the data can be difficult if not impossible and it follows that the common hypothesis is that only a few experts are able to annotate data in such a manner that quality is assured.
  • 4. les Nouvelles 159 Foundations For Valuation Models of Step 1 arise. Also, as aforementioned, the relative dependency of the model on the initial data set and the new data set is an issue. Step 5—Validation step of the output: The appli- cation requires access to data to ensure the output of the solution makes sense. Steps 6 and 7—Maintenance and value creation: Ultimately, due to changes in the environment model quality degrades, and the model has to be retrained. This requires access to the original data set for training in addition to the data collected in the meantime. Consequently, original training data loses value over time while more recent data becomes more valuable. This suggests that the valuation of data follows a dy- namic process that makes data value a characteristic that is relevant and valid on a short temporal window only. In any case, without access to the data during inference, the model is of significantly reduced value. Also, as pointed to before, in training and inference stages, data quality is most important for the success- ful application of AI. Figure 3 sheds light on how data flows through the pipeline and how different this process is from tradi- tional data processing. 2. Methods for Data Valuation As described in Part 1, data has to be exchanged and processed for ML-based applications to work. Therefore, it is essential to be able to share, sell, or purchase data. Surprisingly, despite the relevance of data sharing, the application of valuation methods to data is still scarce. 2.1 Valuation of Intangible Assets: Basic Methodologies Intangible assets valuation is not different from the valuation of a company, especially now that intangi- bles represent 90 percent of enterprise values (Ocean Tomo, 2020). However, there are important differ- From an IP perspective the operations differ from traditional IP operations and raise several questions: 1) How relevant to the output is the new data? 2) Does it contribute more or less than initial data to the mod- el? 3) What is the value of different data coming from different devices that run the same models? Those are currently unresolved accounting and fiscal issues yet to explore. There is also a question of ownership of the model that was developed on initial data and improved with the additional data (that potentially comes from different data owners). Orange rectangles in Figure 2 point to major IP issues in AI data processing. 1.3 The Data Pipeline An applied view on the same process suggests to dis- tinguish seven steps in AI data processing (Figure 3), focused on data. Step 1—Extract from the source: Especially in B2B contexts, suppliers of components but also Origi- nal Equipment Manufacturers (OEMs) struggle to ac- cess the required data during operations. There is a good reason for that: data is typically owned by those who produce the data during operation. Data market development and the enhancement of data value will be supported by an easier access to data. Step 2—Data integration: This creates a situation with many different potential owners. From a legal per- spective the situation is often fuzzy because, in the ab- sence of regulations, it is not clear to what extent data can be used (e.g., car manufacturers vs. drivers; machine manufacturers vs. machine operators). As a default ap- proach, contractual agreements define how data can be used by those who created the ML applications. Step 3—Preprocessing: Moreover, data needs to be preprocessed and, e.g., correctness of data needs to be assured. If sensors send erroneous data, deci- sions by the ML system might be flawed or feedback loops do not work correctly. This becomes even more complicated if the system relies on data from other or multiple suppliers. Consequently, data sources need not only deliver the specific in- formation needed for the ML-based applica- tion but should also deliver contextual or labeled data allowing plausibility checks and quality control. Step 4—Inference: This is when new data is needed to feed the algorithm and the same issues as those Figure 3: The Data Pipeline
  • 5. September 2022 160 Foundations For Valuation Models ences between company and intangible valuations. In the first case, the legal framework is clear enough to delimit the scope of the valuation, whether a limited partnership or a newly created company. In the second case, valuators are less equipped when it comes to de- fining the limits of intangibles and moreover, of data. It follows that the first issue met by valuators is the definition of the valuation object. The first part of this article has offered a useful description of the pipeline to situate the object of valuation in the data processing pipeline. Indeed, valuation could alternatively focus on training data or the AI algorithm. As mentioned here before, and considering the short validity of a valua- tion, a second issue relates to the date of the valuation. Overall, there are three accepted methods to value intangible assets (Figure 4). We describe them in the following paragraphs. 2.2 The Market Approach This valuation approach derives a value from the observation of recent existing transactions of similar assets. This is the preferred fair value valuation accord- ing to the international financial reporting standard which defined a hierarchy of fair values in the dedicat- ed standard IFRS 13. Preferably, transactions should be observed on a liquid market and involve an identical asset. This is a situation described as Level 1 in IFRS. This of course is not possible when we are valuing in- tangibles. If Level 1 fair value cannot apply, IFRS sug- gests moving to Level 2 fair value. Level 2 fair value is based on transactions occurring on less liquid markets but on identical goods or on liquid markets of similar goods. The two levels adopt a market approach that is very convenient and accurate to estimate the econom- ic value of a tradeable good by sticking to the current trend. However, it is often irrelevant when the market is highly volatile and unfortunately hardly applies to data transactions, as markets are not yet liquid and by construction, intangibles are dissimilar. Nevertheless, data sets are traded, more likely with confidentiality, but it may occur that a company has access to relevant information and be able to build an ad hoc comparable. When a comparable transaction occurs, the valuator needs to identify the appropriate indicator. Those vary depending on the nature of the data set: it could be a price per user or a price per image, a price per profile or a price per data set or list. The indicator is next applied to the valuated transaction. Often, the valua- tor can make some adjustments to correct for uneven accuracy or differences in exclusivity rights or lifetime of the data. See Insert 2. 2.3 The Income or Revenue-Based Approach The revenue-based approach derives the value of the asset from the future revenues that it is expect- ed to generate. Revenues can be understood as a ge- Figure 4 : Valuation Methods Company Y wants to value a data set of driver trajectories and behaviors that records 10,000 indi- vidual entries. Company Y exchanges information with actors of the sector and learns that Company X, a competitor, has recently sold a data set of 2,000 individuals on a data exchange for the price of 660,000 €. Assuming that the information about drivers is similar across the two data sets, a single profile has a comparable value of 330 €. This makes a global value of 3,300,000 € for Company Y’s data set. If Company Y’s data set contains 6,000 records of individuals as compared to the 5,000 in Company X’s set, and assuming that the data contains information as relevant as the 5,000 entries, the price could increase by 20% and reach 3,960,000 €. Insert 2: A Drivers Data Set Value With Application Of The Market Approach
  • 6. les Nouvelles 161 Foundations For Valuation Models neric term that describes different sources: the cash flows, the residual income, the price premium, and the relief-from-royalty generated by the exploitation of the asset. In contrast to the market approach, in which the time perspective is the present, the reve- nue-based approach is forward-looking. This tempo- ral orientation supposes that a reasonable business plan exists that narrates the manager’s vision. In IFRS, revenue-based income is also appropriate to estimate a Level 3 fair value, when Levels 1 and 2 cannot be applied. It is often coined “the entity-based approach” because it tells the story from the compa- ny’s point of view or expectations. Amongst the different sub-approaches, the most commonly used one is that of the Discounted Cash Flows. It requires the estimation of the probable in- cremental cash that will be generated by the asset. As mentioned above, those flows can originate from dif- ferent sources: royalty, incremental margins originat- ing in sales increase, and/or cost savings. This applies to data that is licensed or data which treatment will allow to save costs or generate extra revenues, for example by attracting new customers. The main diffi- culty in the application of the approach is the identi- fication of the part of revenues that is strictly related to the IP. A conceptual limit of the methodology lies in its deterministic approach: it pretends to predict a one-path revenues stream in the future, whereas possible revenues streams are manifold and subject to contingencies that are unpredictable. Therefore, a basic revenue-based methodology should be com- pleted by capturing distributions of cash flows rath- er than a unique series of cash flows (See LESI IPV committee webinar on the topic). The recognition of a distribution of cash-flows/incomes provides a bet- ter representation of uncertainty that a basic reve- nue-based method tends to elude. An illustration of a revenue-based application is provided in Insert 3. Here before, we have observed that data (especially when used for ML applications) has specific character- istics that require an adaptation when one intends to use DCF methods. We call this a “data-value based valu- ation method.” In line with the DIN (Deutsches Institüt fur Normung) approach to patent value, an overall da- ta-value factor is arguably a value that can be multiplied with the NPV value. A data value factor is composed of several dimensions, which can include: 1. Time Value (TV): This dimension assumes that value changes over time and typically decreas- es—and this is specifically true for information that is needed in real time and has almost no or at least significantly less value when older. A specification could be: 0=outdated data, 1=timely data. 2. Contextual Value (CV): This dimension assumes that the relevance of data lies with its applica- tion. Some data has value by itself in a specific application while some data is only useful for an application if combined with data from other sources or with context that is not provided with the data set. A specification could be: 0=single data point that is useless without context, 1=all necessary context is included. 3. Information Value (IV): The absolute value of the information [its uniqueness] defines who can provide the customer with the required in- Insert 3: A Drivers Data Set Value With Application Of The Revenue-Based Approach The A Insurance Company wants to purchase the data set offered by Company Y because it contains drivers’ behaviors that could allow a new pricing strategy with premiums adjusted to predicted be- haviors. In order to assess the opportunity, Company Y builds a business plan including both the costs that it expects to save due to a decrease in claims and the revenues losses due to the withdrawal of customers whose premium price will increase. The decrease in both revenues and costs compose the expected yearly flows that will be subject to corporate tax. Post-tax flows are next discounted and summed up to form a value which is to be compared to the cost of investment. If the former is greater than the latter, the investment is deemed generating positive benefits to the company. The table on page 162 illustrates such estimation (inspired by IMDA, 2019). First, the projection of cost of claims with and without data are compared. Losses in revenues are next deducted from the costs saved. Also deducted are the costs to manage the new data activity, which comprehends the salary of a data scientist who will update the model, and marketing costs for communicating about the company’s new strategy. Finally, tax payments are deducted to obtain cash flows. Cash flows are estimated and discounted to form a Net Present Value, which represents the current value of the data set. The NPV of half a million contrasts with the market approach result that was eight times greater. This is explained by the fact that a different usage is being valued. Concretely, the estimation can be multiplied as much as demand is sustained.
  • 7. September 2022 162 Foundations For Valuation Models formation. A specification could be: 0=can be received from different sources, 1=only one person can supply data. 4. Data Quality (granularity, correctness, etc.): An accurate data quality is absolutely essential for a proper application. If quality can be guaran- teed, the customer has significantly less effort to adapt the data, and thereby saves costs. Some- times this is a hard requirement for applications. A specification could be: 0=quality is not ascer- tained, 1=quality can be guaranteed. The four factors evaluated in the ranges between 0 and 1 are complex and highly individual factors that are relat- ed to the assessed applications. They might also be part of the negotiation between customers and suppliers. Why are factors depending on the application, and therefore, why is the value different? The application value can be assessed by the present value of all future cash flows that are expected from the specific usage at play. One specificity for learning systems regarding the application value is that the better the solution be- comes over time —thanks to the feedback loop and the learning of the application —the higher the value over time. One illustration is that of a virtual assistant that becomes better in answering customer requests. Similar to the DIN approach to patent value, the ap- plication value becomes a function of the dimensions assessment, with the following calculation: (TV * CV * IV * DQ) * application value = value of data for a given application Where application value is the discounted value of the cash flows generated by the application. Moreover, if training and inference can be independ- ent from each other, the overall value is equal to the sum of the training value and of the inference value. Training value includes the discounted value of the model used for other applications than the assessed one, while the inference value the sum of the assessed application(s). When inference matters, the sum of all applications is assessed as one trained model, which could be used in multiple devices or products. See Insert 4. 2.4 The Cost Approach The cost approach approximates the data value with the costs of replacement or creation of a functionally equivalent data set. The practice is common in account- ing and is the main approach used for assets’ first recog- nition. There is often a large experience in calculating costs associated to assets such as R&D costs or patents, and companies are equipped with managerial account- ing measurements. Costs are often focused on the ac- quisition of rights, for example, a patent filing, and the related maintenance costs. In the case of data, a chal- lenge will be to clearly identify and assess such costs. The main limit of the method is obvious: there is little correlation between the costs incurred to create a data set and the value that it can possibly generate. Therefore, equating costs and values is a highly ques- tionable approach. This is because the approach disre- gards the uniqueness or specific attractiveness of the data set. Also, the cost approach does not reflect the evolution of the environment and could be subject to time-lag effects. The replacement costs approach is a variant of the cost method that can circumvent the latter limit. This approach estimates the total invest- ment expense that should be made in order to replace the data set. This value could be negligible when the data set is that of a large retailer’s customer behaviour, for example. However, the cost could be tremendous when the data to reconstitute is that which has been captured by a satellite or a telescope. Y1 Y2 Y3 Claim costs before data usage (1) 3 000 000 3 150 000 3 307 500 Claim costs after data usage (2) 2 550 000 2 205 000 1 653 750 Revenues loss (3) 500 000 550 000 660 000 Costs reduction (4)=(2)-(1)-(3) -50 000 395 000 993 750 Supplemental costs for ‘data analysis’ (5) 100 000 110 000 121 000 Supplemental ‘marketing’ costs (6) 30 000 33 000 36 300 Total marginal costs (7)=(5)+(6) 130 000 143 000 157 300 Pre-tax cash flows (8)=(4)+(7) -180 000 252 000 836 450 Corporate tax (20%) (9) -36 000 50 400 167 290 Post-tax cash flows (10)=(8)-(9) -144 000 201 600 669 160 Discounted cash flows (10%) (130 909 €) 166 612 € 502 750 € Net Present Value 538 452 €
  • 8. les Nouvelles 163 Foundations For Valuation Models The cost approach adopts a retrospective temporal orientation when incurred costs form the value and adopts a forward-looking orientation when replace- ment costs are estimated. Thus, the interpretation of the two approaches differs as the incurred costs bears little or no risk of estimation, whereas replacement costs bear an estimation risk. See Insert 5. 3. Applicability of Valuation Methods to Data in the Context of AI Applications Some characteristics make data a particular econom- ic object that challenges the assumptions and under- pinnings of traditional valuation models, and which subsequently require some adaptations. First, data is non-rival. As suggested in Insert 3, one kind of use does not hamper other usages. It follows that multiple sources of revenues can be envisaged, and amongst those, the multiple sales of a same data set or the multiple sale of different versions of the same data set (Shapiro & Varian, 1998). Although data intrinsic value may vary in time (Fer- nandez et al., 2020 —Figure 4), it does not necessarily degrade by erosion or obsolescence; it may stay con- stant or even increase. For example, some cohorts of drivers could be more and more valuable with time be- Insert 4: A Multidimensional Data Valuation, A Simple Case You want to build an AI-based sales support tool. With that aim, you are considering purchasing mar- ket data from a large market research organization. The sales revenues that the tool is expected to generate are 200,000 € per year, with an annual inflation rate of 2%. The project horizon is 10 years. In a world without tax and in the absence of costs, the project net present value is estimated to be 2 Million €. But how can one assess the value of the data? First, one needs to define the contribution of the data to the tool. In the present case, the data compo- nent of the overall solution is thought to be 40% (20% for the model training and application develop- ment and 20% for the maintenance and ongoing retraining over the lifetime of the application). It fol- lows that the data share is defined as 0.4. This coefficient reduces the NPV for the data to 800,000 €. Next, let’s consider the other dimensions of the data value. 1. Time Value: Knowing that market data changes over time, we assume that buying the data now will help the AI-powered sales support system to train well and to perform well as long as market dynamics do not change. Indeed, training data is historical data and is only valuable if it applies identically in the future. We predict that the market will change significantly every three-four years. Therefore, the purchase of three-year historical data means that annual data will have different valid- ity times: one year of the oldest data, two years for the two-year-old data and three years of the latest data, i.e., a total of six years of validity. The required validity time for a three-year data series is 30 (3 * 10 years). Therefore, we estimate our validity duration to be 6/30 = 0.2. The maximum coefficient is reached every year when an updated data set is available for the past three years. 2. Contextual Value: The data that the market researchers collected contains most of the relevant content. You might have received a few more variables that you assume would have been relevant to better reflect the reality for your application, but you assume that it is almost complete. Consequent- ly, the data contextual value is estimated to be 0.8. 3. Information Value: The data the market research organization offers is unique in the sense that no other organization offers this data. It is not substitutable. However, it could possibly be collected by other players because the data is accessible. Also, you are aware that the seller does not provide the data exclusively to you. Therefore, even though the value of the information is high, it is rather limited to the extent it costs someone else to collect and provide it. Moreover, the data set is only one of four very important data sets that you require for the application. Therefore, the IV is set to 0.2. 4. Data Quality: The data is granular and correct. However, there is a significant effort for your data engineers to check and correct it. Indeed, there is always the possibility that outliers exist due to mis- takes made by the seller. The seller is indeed unable to guarantee error-free data sets. Consequently, you plan two weeks of engineering time, which costs you 20,000 €. Recognizing the cost and effort for quality control and quality improvement you set the DQ value to 0.2 The overall value of the data set is: 0.2*0.8*0.2*0.2* 800,000 = 5,120 €
  • 9. September 2022 164 Foundations For Valuation Models cause they will allow a better understanding of drivers’ risky behaviors through ages and in relation to claims (i.e., incidents or accidents). Contrary to common thinking, data remains an ex- cludable good because the “holder” (data ownership does not exist) can specify usage modalities in a con- tractual agreement: it can be licensed, subject of a unique access, of multiple access, it can be reproduced or not, modified or not, sold or not, etcetera. The limit of excludability resides in the control that the holder can have on the data usages. Thus, another condition to excludability is the investment in cybersecurity and controls. Paradoxically, a vulnerable holder could be ex- cludable from the data that he generated on his own. This implies that projected cash flows are conditional to the existence of such controls. See Figure 5. Also, it may be worth recalling that, as with other goods, data value exists on the condition that it is used. Conversely, stored data has no direct economic value if the means of its exploitation are not invested in. Exploitation is in many ways similar to an investment decision and requires the estimation of cash flows or earnings. To do this, valuators model a business plan that captures the chain of activities that an organiza- tion performs in the aim of delivering valuable data us- ages. Therefore, it becomes relevant to understand the data value chain (DVC) to build the useful business plan. In a DVC, infor- mation flow is de- scribed as a series of steps needed to generate value and useful insights from data (Curry, 2015). For example, how data is collected can be key to build- ing a value proposal (Example 3). Also, data quality and integrity are issues and investments that secure those will maintain value. Because of their importance, the European Commis- sion sees the DVC as the “centre of the future knowl- edge economy,” bringing the opportunities of the digi- tal developments to the more traditional sectors (e.g., transport, financial services, health, manufacturing, retail)” (DG Connect, 2013). This raises the following question: Does a general consensus exist about what is a DVC? The answer is no, and anyone browsing the Internet will find a multiplicity of DVCs counting from four to sometimes 12 steps. We suggest a synthesis that matches the data pipeline introduced before (Fig- ure 5). At each of the DVC stages, activities generate costs or revenues. To illustrate each step, we examine the case of Company G, a geolocation forecast provid- er. See Figure 6. The steps are: 1. Discovery/Creation of Data: the cost of discov- ery can depend on whether one generates their own data or purchases it. Company G can either invest in installations cap- turing the necessary data or buy it from actors spe- cialized in data capture. In the latter case, G can Figure 5: Data Operations to Commercialization Insert 5: A Drivers Data Set Value with Application of the Cost Approach Company Y has spent the following amounts of money to develop the data set: Entry costs that include regulatory compliance, authorizations to collect data, the development of the sensor that will track the drivers’ behaviors, and the installation or provision of facilities to store the data. Overall, costs are estimated to be worth 2,000,000 €. This includes software and storage, but not the human capital and marketing costs already estimated in Insert 3. The latter and other costs incurred to create the data set amount to 2,500,000 €. Again, this value contrasts with the market- and revenue-based approaches but the meaning is different. The data set was worth 2.5 M€ of investment to Company Y because, in the long term, more benefits are expected to be generated from such investment.
  • 10. les Nouvelles 165 Foundations For Valuation Models turn to the few oligopolists in the domain or buy data on existing market places (Dawex, aws, snow- flake…). Knowledge on data price fixation is still scarce, therefore procurement solutions could vary highly from one solution to the other and from one seller to the other. 2. Integration: this non-compulsory step describes the work that needs to be done to organize the data with other data sets. To do so, one needs knowledge, computational capacity, and a workforce. As a geolocation data treatment entity, G deals with geolocation data that sometimes is labeled according- ly with the means of transportation (by foot, by car, by bus, etcetera) or alternatively, is not. In the latter case, to build a geolocation forecast, G will need to la- bel the data by conducting some reverse engineering. This has a cost that will add to the purchase price of data and, moreover, this slightly increases risks due to inference bias. 3. Transformation: at this step, data is modi- fied, extended, and can produce further data from one or multiple sources. G’s machine-guided or men-guided process con- sumes energy and time. Managerial choices described in the first section can significantly impact the P&L. 4. Added Value: outputs of data manipulation are new forms of descriptive, predictive, or prescriptive analysis. Value is added but only costs can be recorded, because the results are not yet shared. G manipulates data thanks to its workforce and an AI component. This supposes IP protection costs, AI development costs, and cybersecurity costs. 5. Impact: when new results are available, they need to be intelligible and shared under the assumption that increasing (perceived) knowledge is a condition of val- ue creation. At this stage, results visibility may also require marketing communication operations. G will expense advertisement costs for geolocation services, communication costs in specialized forums, of registration on platforms, etcetera. 6. Usage: one particularity of data is that it can be Figure 6: The Data Value Chain
  • 11. September 2022 166 Foundations For Valuation Models used many ways, and even reused. It can be used by the data creator, the data transformer, or someone else completely different from the field. Usage depends on the user intention, which can be different from the data holder processing through the DVC. Geolocation data can be useful in the situation of a pandemic for car makers because traffic information will support their inventory management. The effec- tive usage can substantially differ from the reason why data was created in the first place. As a consequence, the potentially generated revenues are multiple and difficult to forecast. In the end, the condition for determining the value of data is, more than for any other asset/good, the ex- istence of a view of the upcoming usages. Conclusion AI applications are special, which significantly drives the value of data and the need for proper valuation techniques. After highlighting the unique aspects of data in ML-based applications, we have shown that the three traditional approaches to IP valuation can apply to data valuation cases. The market approach has currently little relevance, but the expected development of data exchanges might evolve towards a more liquid market and better price predictability. The cost approach is adequate to describe the invest- ment made by the company producing the data, but it suffers from challenges when economic benefits are to be valued. This is because data can be used in multiple applications, which would decrease the cost for each individual case. Revenue-based values are most complex to build as they require detailed business plans. They are consid- ered as the most reliable and flexible existing solution. Finally, we suggest that an ad hoc description of the DVC will support the work of the valuator in the finan- cial modeling of projected cash flows. This will include technical development of AI as well as training and in- ference aspects. ■ Available at Social Science Research Network (SSRN): https://ssrn.com/abstract=4179547. References: E. Curry, “The Big Data Value Chain: Definitions, Concepts, and Theoretical Approaches,” (2015). 10.1007/978-3-319-21569-3_3. DG Connect, “A European strategy on the data value chain,” (2013). T. Fernandez, N. Rivera, W. Xu, A. Gretton, “Ker- nelized stein discrepancy tests of goodness-of-fit for time-to-event data.” In International Conference on Machine Learning, (2020) : 3112-3122. Infocomm and Media Development Authority (IMDA), Personal Data Protection Commission (PDPC), & Intellectual Property Office Of Singapore. “Guide to data valuation for data sharing,” (2019), p. 42. Re- trieved from https://www2.imda.gov.sg/AI-and-Data. Ocean Tomo, “Intangible-asset-market-value-study,” (2021). Retrieved from: https://www.oceantomo.com/ intangible-asset-market-value-study/. C. Shapiro, H.R. Varian, S. Carl “Information rules: A strategic guide to the network economy.” Harvard Business Press, (1998).