Business case using Cost of Quality
•
0 likes•92 views

Understanding the concept of cost of quality How to use Cost of Quality concept to develop a business case

Recommended
Recommended
More Related Content
What's hot
What's hot (20)
Similar to Business case using Cost of Quality
Similar to Business case using Cost of Quality (20)
Recently uploaded
Recently uploaded (20)
Business case using Cost of Quality
- 1. USING COST OF QUALITY FOR YOUR BUSINESS CASE 1Continuous Improvement | Lean Improvement | Dominic N | July 2020
- 2. USING COQ FOR YOUR BUSINESS CASE Continuous Improvement | Lean Improvement | Dominic N | July 20202 What you need to understand to do this • Understanding cost of quality and what are the elements • What is a business case and what structure should it include • Where required you need to include a cost benefit ratio Other factors include: • Be ready to work with your finance team on this and have a good relation ship with them • Have a flare for data • Make your data visual you will be share with top management
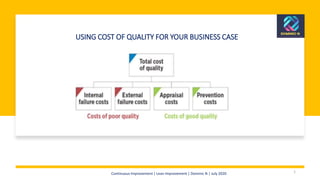
- 3. COST OF QUALITY Continuous Improvement | Lean Improvement | Dominic N | July 20203 Cost of Quality : This involves quantifying the “quality” costs to the organization Cost of Quality (COQ) = Cost of Poor Quality (COPQ) + Cost of Good Quality (COGQ) What COQ contains: • COPQ – Internal Costs (defects occurring and managed within the organization) ▪ Scrap, Rework, Re-inspection • COPQ – External Costs (defects that reach the consumer) ▪ Adverse Event Reporting, Warranty, Corrections and Removals, Product Liability, loss of brand reputation • COGQ – Appraisal Costs (controls put in place by the organization) ▪ Inspection (purchased, manufactured), Testing (acceptance, field), Quality Audits, Calibration • COGQ – Prevention Costs (activities to eliminate defects from ever occurring) • SPC (statistical process control), Quality Planning, Quality Training, investment in quality-related information systems
- 4. BUSINESS CASE Continuous Improvement | Lean Improvement | Dominic N | July 20204 • A business case is a written document or verbal presentation which contains the reasons for initiating a task or project. Whoever presents the case needs to structure it well. It should contain details on costs, risks, as well as pros and cons. • Additionally, it should include what actions to take as well as their timescales. Above all, a good business case must have a compelling conclusion. • A business case should also warn of what might happen if nobody takes the necessary actions. Ref: Project Risk Leader
- 5. BENEFIT COST RATIO Continuous Improvement | Lean Improvement | Dominic N | July 20205 A cost-benefit analysis is a study to determine the relationship between the benefits and the costs of changes to processes, policies, and/or procedures. The costs should be stated in financial units (e.g., Dollars, Pesos, Euros, etc.). Cost-benefit analyses are typically performed when there is a change that is pending to ensure the benefits from the changes outweigh the costs. How to Use • Step 1. Determine all costs associated with the processes affected by a proposed change. • Step 2. Have these costs validated by accounting staff or by the appropriate financial group. • Step 3. Identify the changes to the processes and calculate the costs to execute the new process going forward (also known as the operational state). • Step 4. Determine the costs of implementing the changes to the process. In addition to hard costs related to hardware and equipment, ensure that you capture costs related to information technology and operations, training, documentation, running processes in parallel during transition, office lease cancellation, and severance costs related to dismissed employees. There may be other costs related to implementing the change. • Step 5. Calculate the benefits projected from making these changes. • Step 6. Determine the cost-benefit ratio: divide the total of the projected benefits by the total costs. A higher the ratio of benefits to costs indicates a positive change. • *Tip: It is wise to have accounting and/or finance staff confirm the assumptions and analysis. • Step 7. Communicate to management to obtain approval and implement the changes. • Step 8. Periodically assess and calculate whether the benefits and costs forecasted were realized and recalculate the cost-benefit analysis. Use this information for future cost- benefit analyses of future projects. Ref: ASQ publication
- 6. 1. What do you do when your company insists on buy raw materials of lower quality for production in the name of saving cost Continuous Improvement | Lean Improvement | Dominic N | Jun 20206 CASE STUDY
- 7. • Develop a business case using Cost of Quality (COQ) Approach • State the purpose, why do you want this change or reverse of raw material • What value will the business get out of this reversal to previous specification. • Gather data on all parameters that make up COQ I.e both the COPQ and COGQ • Calculate the COQ = COPQ + COGQ (see next slide for example) • Use graphical analysis where possible to show variations and distribution since implementation of new material • Share what the benefits will be if this process was reversed. (Use the Cost of Benefit Approach) Continuous Improvement | Lean Improvement | Dominic N | July 20207 WHAT YOU COULD DO
- 8. COST OF QUALITY Continuous Improvement | Lean Improvement | Dominic N | July 20208 Business Case Appendix Cost of Quality Parameters Before (N) After (N) % Change Comments 1. COPQ – Internal Costs (defects occurring and managed within the organization) Scrap 3.00 12.00 60% More scraps during production as aresults of materials with poor quality Re-inspection 2.00 6.00 50% Rework 1.00 6.00 71% 2. COPQ – External Costs (defects that reach the consumer) Adverse Event 0.00 0.00 #DIV/0! Consumer complaints 2.00 12.00 71% Trade Returns 0.00 1.00 100% 3. COGQ – Appraisal Costs (controls put in place by the organization) Inspection (purchased, manufactured) 10.00 10.00 0% Testing (acceptance, field), Quality Audits 10.00 15.00 20% Beacause of retesting Calibration 10.00 10.00 0% 4. COGQ – Prevention Costs (activities to eliminate defects from ever occurring) Quality Planing 10.00 12.00 9% More time spent in creating control plans and assurance processes also in training and retraining of teams to spot defective materials hence all this brings more cost from manhours Quality Assurance 10.00 12.00 9% SPC (statistical process control) 10.00 10.00 0% Training 10.00 15.00 20% COPQ 8.00 37.00 64% COGQ. 70.00 84.00 9% COQ = COPQ + COGQ. 78.00 121.00 22%
- 9. MAKE YOR DATA VISUAL- CREATE A DASHBOARD Continuous Improvement | Lean Improvement | Dominic N | July 20209 2 14 0.25 0.7 0 2 4 6 8 10 12 14 16 Q1 Q2 Q3 Q4 Consumer complaint Review Total Complaints CPM 1 3 6 8 12 18 0 5 10 15 20 Jan Feb Mar April May June Supplier Non-Conformance Jan Feb Mar April May June 0 Consumer Recalls 2 Trade Recalls 0 Near Miss 3 4 16 18 22 30 0 5 10 15 20 25 30 35 Jan Feb Mar April May June Defects during productions Jan Feb Mar April May June
- 10. THANK YOU! Continuous Improvement | Lean Improvement | Dominic N | Jun 2020 10