1. Selection and confirmation of T1 generation
metabolically engineered tobacco for bioproduct
Dilsherpreet Sidhu and Connor Gorman
Bioenvironmental Sciences, Department of Plant Pathology and Microbiology, Texas A&M University
Abstract Results
Introduction and Objectives
Conclusion
Methods
In order to derive homozygous lines from T0 tobacco (N. tabacum) genotypes
engineered for squalene production, T1 generation seeds were put through antibiotic
selection followed by confirmation of tDNA by gDNA PCR and qPCR expression
analysis. The antibiotic concentration used for selection of T1 seed was determined by
kill curve analysis using a kanamycin concentration gradient for in vitro germination.
Surviving plantlets from selection concentrations killing >25% of T1 seed were
transferred to soil and gDNA was isolated using CTAB method. PCR was performed to
determine efficacy of selection and confirm tDNA presence. Following acclimation and
growth in the greenhouse, RNA was isolated for expression analysis. T1 plant qPCR will
be the primary basis of selection for improved genotypes and identifying possible
homozygous lines to continue to the T2 generation.
Tobacco (N. tabacum) has been used in recent years as a model crop for metabolic
engineering in plants. Currently, it is being used to produce high-value metabolites in the
terpene family. Terpenes are a large and diverse class of organic compounds, produced by
a variety of plants and lesser so in other natural processes. They may protect the plants that
produce them by deterring herbivores and by attracting predators and parasites of
herbivores. Terpenes are hydrocarbons, whereas terpenoids contain additional functional
groups. The production of these as metabolites in planta however is very low, at levels that
would not be deemed a marketable source. Also, terpene metabolism is limited to carbon
fixation and downstream metabolism. To prevent downstream metabolism of the desired
terpene – squalene – the transgenic approach is to synthesize the compound within the
chloroplast. The overall scheme for transgenic squalene biosynthesis involves a synergistic
enzyme in carbon fixation (sedoheptulose-1,7-bisphosphatase: SBPase), a carbon
redirection from RuBisCo through three enzymes (glycolate-oxidase: GO, catalase: CAT,
and malate synthase: MS) into the MEP pathway, leading to two enzymes (farnesyl-
pyrophosphate: FPPS, squalene synthase: SQS) that create the squalene compound.
Squalene is a natural 30-carbon organic compound originally obtained for commercial
purposes primarily from shark liver oil – thus the current method is not sustainable. For this
reason funding in production of bioproducts, such as squalene, helps to produce commercial
and industrial inputs in an environmentally sustainable fashion.
Objectives:
•Separate pT8.3&4 lines in to homozygous by selecting them through Kanamycin
selection gradient.
•Confirm positive plants using gPCR.
•Perform qPCR to show elevated transcripts levels.
•Use GC-MS to measure squalene.
1. T Seed Selection₁ T1 generation seeds from two high squalene producing lines (pT8.3&4) were
germinated in vitro along with their background genotype (G1) and a WT cultivar (1068) using
MS media. After cotyledon emergence they were transferred to MS media containing kanamycin
concentrations of 0, 50, 75, 100, 150mg*L-1
. Three replications were performed to look for ¾
survival, assuming T0 lines are of a single insert. Survival was determined two weeks post
treatment based on plant health, where general chlorosis and death were scored as selected,
and phenotype similar to control treatment was scored as resistant.
2. gPCR: PCR was performed on the selected pT8.3&4. For the PCR, pT8.3 T was selected as a₀
positive control. Each leaf tissue sample DNA was extracted using the CTAB method. After the
genomic DNAs were acquired and checked for quality, PCR were performed using the Econtaq
polymerase and gene specific primers for the tDNA SBPase gene. Amplification imaging was
conducted using electrophoresis with 1% agarose gel.
3. qPCR: PCR positive lines will under-go expression analysis by qPCR to collect transcription
data, primarily for the transgenic SBPase activity.
• The selection of T1 seed varies from selection in leaf disks in regards to antibiotic
concentration. Although the selection from the background (G1) was not clear, positive
pT8 T1 generation plants were generated and confirmed with PCR. The selection strength,
and variation of, may be result of: old stocks, improper storage or thawing, and
deactivation by adding it too early to the MS media during preparation.
• qPCR will be done after completion of gPCR results, and plants are not yet of size nor
maturity to perform squalene analysis.
• This experience has taught me many useful things such as growing tobacco from seeds,
taking care of tobacco, testing certain organisms in selective media for different genes,
field work, PCR, and work values which will help me reach my dream of feeding the world.
Acknowledgements
I would like to acknowledge and thank the BESC department and Dr. Joshua Yuan for
providing the funds for this opportunity. A big thanks to the Yuan lab specifically Connor
Gorman, Zhao Cheng, Ryan Syrenne, Zain Ul Abedin, Mustafa Presswala, Hu Cheng, Dr.
Xin Wang, and Dr. Hong Ma for guiding me through this project and taking the time to
answer all of my questions. Sponsors for high impact experiences for BESC and the
BESC poster symposium include the Department of Plant Pathology and
Microbiology, the College of Agriculture and Life Sciences, the Office of the Provost
and Executive Vice President for Academic Affairs.
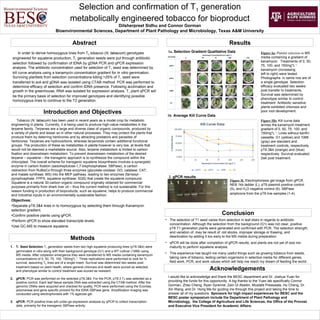
1a. Selection Gradient Qualitative Data
1b. Average Kill Curve Data
2. gPCR results
Figure II. Electrophoresis gel image from gPCR.
NEB 1kb ladder (L), pT8 plasmid positive control
(5), and H2O negative control (6). SBPase
amplicons from the pT8 line samples (1-4).
Figure Ia: Plantlet selection in MS
media containing a gradient of
kanamycin. Treatments of 0, 50,
75, 100, and 150mg*L-1
kanamycin (increasing
left to right) were tested.
Photographs in same row are of
a single genotype. Selection
efficacy evaluated two weeks
post transfer to treatments.
Survival was determined by
phenotype similar to control
treatment. Antibiotic sensitive
plants exhibited chlorosis and
poor root development.
Figure IIb: Kill curve data
across the kanamycin treatment
gradient of 0, 50, 75, 100, and
150mg*L-1
. Lines without kanR+
cassette, G1 (yellow) and 1068
(gray) are standard and
treatment controls, respectively.
pT8.3&4 (orange) and (blue)
respectively. Survival evaluated
2wk post treatment.
L 1 2 3 4 5 6 LL 1 2 3 4 5 6 L
Editor's Notes
Poster is meant to be flexible with defined/standardized sections. Posters are standardized to 36X36 inches for the symposium. Additional recommendations and required information are indicated within the template. Feel free to change the background colors and or design of the headers as you would like. The idea is to simply use the template to organize your presentation. Each section can be whatever length you find appropriate to fully describe your project.