Recommended

Recommended
More Related Content
Similar to Optimization of Electrolyte Synthesis for Safer Lithium Ion Batteries
Similar to Optimization of Electrolyte Synthesis for Safer Lithium Ion Batteries (20)
Recently uploaded
Recently uploaded (20)
Optimization of Electrolyte Synthesis for Safer Lithium Ion Batteries
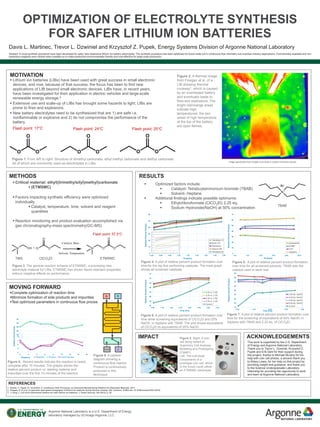
- 1. Argonne National Laboratory is a U.S. Department of Energy laboratory managed by UChicago Argonne, LLC. 1. Dziniel, T.; Pupek, K.; Krumdick, G. Continuous Flow Processes: an Advanced Manufacturing Platform for Electrolyte Materials, 2017. 2. Finegan, D. P. et al. In-operando high-speed tomography of lithium-ion batteries during thermal runaway. Nat. Commun. 6:6924 doi: 10.1038/ncomms7924 (2015). 3. J. Feng, L. LuA novel bifunctional additive for safer lithium ion batteries. J. Power Sources, 243 (2013), p. 29 OPTIMIZATION OF ELECTROLYTE SYNTHESIS FOR SAFER LITHIUM ION BATTERIES Davis L. Martinec, Trevor L. Dzwiniel and Krzysztof Z. Pupek, Energy Systems Division of Argonne National Laboratory Abstract: A novel synthetic procedure have been developed for safer, less hazardous lithium ion battery electrolytes. The synthetic procedure has been optimized for future scale out in continuous flow chemistry and eventual industry applications. Commercially available and non hazardous reagents were utilized when possible so to make production environmentally friendly and cost effective for large scale production. Complete optimization of reaction time Minimize formation of side products and impurities Test optimized parameters in continuous flow process IMPACT METHODS MOTIVATION Lithium ion batteries (LIBs) have been used with great success in small electronic devices, and now, because of that success, the focus has been to find new applications of LIB beyond small electronic devices. LIBs have, in recent years, have been investigated for their application in electric vehicles and large-scale renewable energy storage.3 Extensive use and scale-up of LIBs has brought some hazards to light; LIBs are prone to fires and explosions. New battery electrolytes need to be synthesized that are 1) are safe i.e. nonflammable or explosive and 2) do not compromise the performance of the battery. Figure 1. From left to right: Structure of dimethyl carbonate, ethyl methyl carbonate and diethyl carbonate. All of which are commonly used as electrolytes in LIBs. Flash point: 17°C Figure 2. A thermal image from Finegan et al. of a LIB showing thermal runaway1, which is caused by an overheated battery and eventually leads to fires and explosions. The bright red/orange areas indicate high temperatures; the two areas of high temperature at the top of the battery are open flames. RESULTS MOVING FORWARD This work is supported by the U.S. Department of Energy and Argonne National Laboratory. Thank you to Trevor L. Dzwiniel, Krzysztof Z. Pupek and Erik Dahl for their support during this project, thanks to Michael Murphy for his help with coin cell photos, a sincere thank you to Abbey Lewis, for her help on this project by providing insight and guidance and thank you to the Science Undergraduate Laboratory Internship for providing the opportunity to work and learn at Argonne National Laboratory. ACKNOWLEDGEMENTS Critical material: ethyl((trimethylsilyl)methyl)carbonate (ETMSMC) Factors impacting synthetic efficiency were optimized individually Catalyst, temperature, time, solvent and reagent quantities Reaction monitoring and product evaluation accomplished via gas chromatography-mass spectrometry(GC-MS) Image reproduced from Finegan et al under a creative commons license. Figure 3. The general reaction scheme of ETMSMC, a promising new electrolyte material for LIBs. ETMSMC has shown flame retardant properties without negative effects on performance. Flash point: 25°CFlash point: 24°C Optimized factors include: Catalyst- Tetrabuylammonium bromide (TBAB) Solvent- Heptane Additional findings indicate possible optimums: Ethylchloroformate (ClCO2Et) 2.25 eq. Sodium Hydroxide(NaOH) at 50% concentration Flash point: 57.5°C ETMSMC 0 10 20 30 40 50 60 70 0.0 5.0 10.0 15.0 20.0 25.0 RelativePercentProduct Time(hrs) Acetonitrile MTBE THF Heptane Figure 4. A plot of relative percent product formation over time for the top five performing catalysts. The inset graph shows all screened catalysts. Figure 5. A plot of relative percent product formation over time for all screened solvents. TBAB was the catalyst used in each trial. 0 10 20 30 40 50 60 0.45 0.65 0.85 1.05 1.25 1.45 1.65 1.85 2.05 RelativePercentProduct Time(hrs) TetraButyl Cl Bu4N OH TetraOctyl Aliquat 336 TetraButyl Br ClCO2EtTMS TBAB Figure 8. Recent results indicate the reaction is nearly complete after 15 minutes. The graphs shows the relative percent product vs. starting material and impurities over the first 15 minutes of the reaction. 4 5 6 7 8 0 2 4 6 8 10 12 14 16 RelativePercentArea Time(min) Reactant Product Total Impurities 80 83 86 89 92 Figure 9. A cartoon diagram showing a continuous flow reactor. Product is continuously produced in this technique. Figure 8. Right: A coin cell being tested at Argonne’s Cell Analysis, Modeling and Prototyping (CAMP). Left: The individual components of a prototype coin cell, which in the future could utilize an ETMSMC electrolyte. 10 20 30 40 50 60 70 80 90 0.45 1.45 2.45 3.45 4.45 RelativePercentProduct Time (hrs) 3.00 Eq. NaOH 4.00 Eq. NaOH 5.00 Eq. NaOH 6.00 Eq. NaOH Control40 45 50 55 60 65 70 75 0.95 1.45 1.95 2.45 2.95 3.45 3.95 4.45 RelativePercentProduct Time (hrs) 2.00 vs. 2.50 2.00 vs. 2.25 2.25 vs. 2.50 2.25 vs. 2.25 Control 1 Figure 7. A plot of relative percent product formation over time for the screening of equivalents of 50% NaOH, in heptane with TBAB and 2.25 eq. of ClCO2Et. Figure 6. A plot of relative percent product formation over time while screening equivalents of ClCO2Et and 25% NaOH, in heptane with TBAB. The plot shows equivalents of ClCO2Et vs equivalents of 25% NaOH. REFERENCES