Tricumen / Capital Markets: Results Review 3Q13/9m13_OPEN

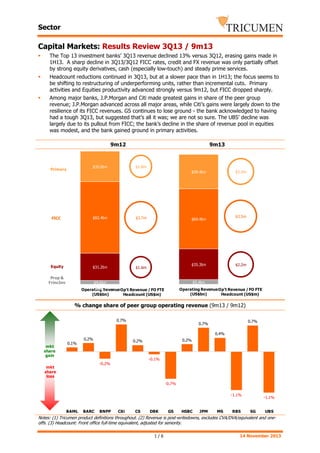
Capital Markets: Results Review 3Q13 / 9m13 The Top 13 investment banks’ 3Q13 revenue declined 13% versus 3Q12, erasing gains made in 1H13. A sharp decline in 3Q13/3Q12 FICC rates, credit and FX revenue was only partially offset by strong equity derivatives, cash (especially low-touch) and steady prime services. Headcount reductions continued in 3Q13, but at a slower pace than in 1H13; the focus seems to be shifting to restructuring of underperforming units, rather than incremental cuts. Primary activities and Equities productivity advanced strongly versus 9m12, but FICC dropped sharply. Among major banks, J.P.Morgan and Citi made greatest gains in share of the peer group revenue; J.P.Morgan advanced across all major areas, while Citi’s gains were largely down to the resilience of its FICC revenues. GS continues to lose ground - the bank acknowledged to having had a tough 3Q13, but suggested that’s all it was; we are not so sure. The UBS’ decline was largely due to its pullout from FICC; the bank’s decline in the share of revenue pool in equities was modest, and the bank gained ground in primary activities.

Recommended
Recommended
More Related Content
What's hot
What's hot (20)
Viewers also liked
Viewers also liked (7)
Similar to Tricumen / Capital Markets: Results Review 3Q13/9m13_OPEN
Similar to Tricumen / Capital Markets: Results Review 3Q13/9m13_OPEN (20)
More from Tricumen Ltd
More from Tricumen Ltd (9)
Recently uploaded
Recently uploaded (20)
Tricumen / Capital Markets: Results Review 3Q13/9m13_OPEN
- 1. Sector Capital Markets: Results Review 3Q13 / 9m13 The Top 13 investment banks’ 3Q13 revenue declined 13% versus 3Q12, erasing gains made in 1H13. A sharp decline in 3Q13/3Q12 FICC rates, credit and FX revenue was only partially offset by strong equity derivatives, cash (especially low-touch) and steady prime services. Headcount reductions continued in 3Q13, but at a slower pace than in 1H13; the focus seems to be shifting to restructuring of underperforming units, rather than incremental cuts. Primary activities and Equities productivity advanced strongly versus 9m12, but FICC dropped sharply. Among major banks, J.P.Morgan and Citi made greatest gains in share of the peer group revenue; J.P.Morgan advanced across all major areas, while Citi’s gains were largely down to the resilience of its FICC revenues. GS continues to lose ground - the bank acknowledged to having had a tough 3Q13, but suggested that’s all it was; we are not so sure. The UBS’ decline was largely due to its pullout from FICC; the bank’s decline in the share of revenue pool in equities was modest, and the bank gained ground in primary activities. 9m12 9m13 3 3 140 $1.8m $35.0bn Primary $2.3m $39.4bn 120 2.5 2.5 2 2 100 80 $82.4bn FICC 60 $3.7m $3.5m $69.4bn 1.5 1.5 40 1 20 Equity $31.2bn Prop & 0 PrincInv $35.3bn $1.6m 1 $2.2m $5.4bn $4.6bn 9m12 0.5 Operating Revenue Op't Revenue / FO FTE (US$bn) 0.8 Headcount (US$m) 1.2 1 0.5 Operating Revenue Op't Revenue / FO FTE 1 (US$bn) 0.8 Headcount (US$m) 1.2 % change share of peer group operating revenue (9m13 / 9m12) 0.01 0.7% 0.005 0.4% 0.2% mkt share 0 gain 0.7% 0.7% 0.2% 0.2% 0.1% -0.1% -0.2% mkt -0.005 share loss -0.7% -0.01 -1.1% -1.1% -0.015 BAML BARC BNPP Citi CS DBK GS HSBC JPM MS RBS SG UBS Notes: (1) Tricumen product definitions throughout. (2) Revenue is post-writedowns, excludes CVA/DVA/equivalent and oneoffs. (3) Headcount: Front office full-time equivalent, adjusted for seniority. 1/6 14 November 2013
- 2. Sector Primary issuance & Advisory In 3Q13, DCM extended year-on-year gains of 1H13. For the banks in this report, bond fees were flat versus 3Q12, with modest growth in volume being negated by lower margins; high yield (especially outside the US) was resilient and emerging market bonds grew. Loan fees jumped 15% in 3Q13/3Q12 and 11% in 9m13/9m12; leveraged deals were the key driver, despite a sharp decline versus 3Q12. Securitisation in the US fell in both Agency MBS and CMBS in 3Q13. MBS trading weakened at the start of 3Q13 on falling volumes and tighter margins, but picked up in September. After a strong 2Q13, CMBS issuance in Europe faltered but RMBS and ABS grew. Relative to 3Q12, ECM fees grew in all regions except APAC ex-Japan, where Chinese IPOs faltered. In the US, margins surged on growing supply; several of our sources expect to see the same in EMEA in 4Q13/1Q14. Converts had a strong quarter versus 3Q12. M&A volumes grew strongly, driven by US, but also Europe (despite the strong EUR) and APAC. There are signs of margin contraction, but most banks agree that backlogs are very high indeed. 9m12 9m13 3 3 140 $1.8m $35.0bn Primary $2.3m $39.4bn 120 2.5 2.5 2 2 100 80 $82.4bn FICC 60 $3.7m $3.5m $69.4bn 1.5 1.5 40 1 20 Equity $31.2bn Prop & 0 PrincInv $35.3bn $1.6m 1 $2.2m $5.4bn $4.6bn 9m12 0.5 Operating Revenue Op't Revenue / FO FTE 1 (US$bn) 0.8 Headcount (US$m) 1.2 0.5 Operating Revenue Op't Revenue / FO FTE 1 (US$bn) 0.8 Headcount (US$m) 1.2 % change share of peer group operating revenue (9m13 / 9m12) 0.012 1.1% 1.0% 0.01 0.9% 0.8% 0.008 0.006 mkt share 0.004 gain 0.002 0.6% 0.5% 0.0% mkt share 0 loss -0.002 -0.1% -0.1% -0.1% -0.2% -0.004 -0.4% -0.006 -0.6% -0.008 BAML BARC BNPP Citi CS DBK GS HSBC JPM MS RBS SG UBS Notes: (1) Tricumen product definitions throughout. (2) Revenue is post-writedowns, excludes CVA/DVA/equivalent and oneoffs. (3) Headcount: Front office full-time equivalent, adjusted for seniority. 2/6 14 November 2013
- 3. Sector FICC The G10 FX trading revenues fell slightly in 3Q13/3Q12; this, however, did little to dent a strong advance in 9m13/9m12, which was driven in part by equity-related trading in Japan. Emerging markets FX remain an area of weakness. There is little sign of a recovery in margins. Rates trading was the key area of weakness: the banks’ 3Q13 revenues were barely 50% of the 3Q12 level; this extends a decline seen in 1H13. The US flow markets and global short end suffered the steepest drop; structured rates and developed APAC were comparatively resilient. Credit revenues also plunged in 3Q13: down 26% y/y. Emerging markets debt trading and APAC underperformed, and some banks also took losses on legacy inventory. The high yield market – an area of strength in 1H13 – declined. Commodities revenue grew due to metals, softs, and APAC. Having missed the Sept-13 deadline, the Fed is still considering whether to allow banks to continue operating in physical commodities. 9m12 9m13 80 $17.2bn 3 3 $4.0m 70 FX 60 $16.8bn 2.5 2.5 $4.5m 50 $35.0bn Rates $3.8m 2 2 $24.1bn 40 30 20 1.5 1.5 Credit $2.9m $4.8m $24.8bn $22.5bn $5.1m 1 1 10 Commodities $1.9m $5.4bn $2.8m $6.0bn 0 9m12 0.5 Operating Revenue Op't Revenue / FO FTE (US$bn) 0.8 Headcount (US$m) 1.2 1 0.5 Operating Revenue Op't Revenue / FO FTE 1 (US$bn) 0.8 Headcount (US$m) 1.2 % change share of peer group operating revenue: FICC total (9m13 / 9m12) 0.02 1.6% 1.1% 0.5% 0.2% mkt 0 share gain -0.01 1.1% 0.8% 0.01 0.1% 0.0% -0.2% -0.2% -0.5% -0.9% mkt share -0.02 loss -0.03 -3.0% -0.04 BAML BARC BNPP Citi CS DBK GS HSBC JPM MS RBS SG UBS Notes: (1) Tricumen product definitions throughout. (2) Revenue is post-writedowns, excludes CVA/DVA/equivalent and oneoffs. (3) Headcount: Front office full-time equivalent, adjusted for seniority. 3/6 14 November 2013
- 4. Sector Equities Cash equity year-on-year revenue growth in 9m13 was largely due to increased Asian volume. In late 3Q13, Japanese trading began to retreat to historical levels after the stellar 1H13. Equity derivatives grew strongly during 9m13/9m12, largely thanks to index option trading in the US and APAC (the latter also recording a strong growth in single stock trading). Globally, structured equity derivatives fared well; the strongest growth was seen in the US as the trend in retail structured products turned away from fixed income based to equity-based products. Institutional use of lightly structured equities continues to grow in Europe and APAC. Prime services posted a modest year-on-year growth, revenue benefiting from increased securities lending/financing revenues and - to a lesser extent - growing client balances at hedge funds. 9m12 9m13 35 3 3 $1.4m $10.2bn 30 $0.9m $8.9bn2.5 2.5 25 EQ Cash 20 2 2 $3.5m $17.6bn 15 EQ Derv'& COnverts $15.2bn $2.8m 1.5 1.5 1 1 10 5 Prime Services $7.1bn $7.5bn $2.1m $2.4m 0 9m12 0.5 Operating Revenue Op't Revenue / FO FTE 1 (US$bn) 0.8 Headcount (US$m) 1.2 0.5 Operating Revenue Op't Revenue / FO FTE 1 (US$bn) 0.8 Headcount (US$m) 1.2 % change share of peer group operating revenue (9m13 / 9m12) 0.02 0.01 0.9% 0.9% 0.4% 0.3% 0.4% 0.4% 0.5% 0.5% 0.0% mkt 0 share gain -0.01 -0.4% -0.4% -0.4% mkt share -0.02 loss -0.03 -0.04 BAML BARC BNPP Citi CS DBK -3.7% GS HSBC JPM MS RBS SG UBS Notes: (1) Tricumen product definitions throughout. (2) Revenue is post-writedowns, excludes CVA/DVA/equivalent and oneoffs. (3) Headcount: Front office full-time equivalent, adjusted for seniority. 4/6 14 November 2013
- 5. Sector Product Revenue: Momentum* 3Q13/3Q12 (TRIC product definitions, post-writedowns, % change, Global Level 1) BAML BARC BNPP Citi CS DBK GS HSBC JPM MS RBS SG UBS Primary Top 25% Bottom 25% +0% Total capital markets -19% +14% -10% DCM Bonds +5% -12% DCM Loans +57% +1% Securitisation +4% -44% ECM N/M N/M +19% -26% M&A / Advisory N/M +18% -19% -3% -22% FX -3% -31% Rates -42% -62% Credit -7% -35% N/M +52% -26% N/M +32% +3% +47% +14% Secondary Commodities N/M EQ Cash EQ Derv & Converts Prime Services Prop Trading Principal Inv N/M N/M N/M N/M N/M N/M N/M N/M +16% N/M N/M N/M -2% N/M +2% -52% N/M +184% +5% Top 25% Bottom 25% +3% N/M -7% 9m13/9m12 (TRIC product definitions, post-writedowns, % change, Global Level 1) BAML BARC BNPP Citi CS DBK GS HSBC JPM MS RBS SG UBS Total capital markets Primary +21% +7% DCM Bonds +36% +7% DCM Loans +45% +3% +17% -22% Securitisation N/M N/M ECM N/M +41% +10% M&A / Advisory N/M +5% -13% Secondary -3% -12% FX -1% -12% Rates -17% -51% +17% -18% Credit N/M Commodities N/M +21% -14% EQ Cash N/M +23% +12% EQ Derv&Conv't +33% Prime Services Prop Trading Principal Inv +4% +7% +3% N/M -32% -41% N/M +179% +4% N/M N/M N/M N/M N/M N/M N/M N/M N/M N/M N/M Source: Tricumen analysis. * Arrows show % change in revenue vs peers. Up-/down-arrows: top-/bottom-quartile. One-off and extraordinary items, as described in the Company Section, are excluded. 5/6 14 November 2013
- 6. Sector About Tricumen Tricumen was founded in 2008. It quickly become a strong provider of diversified market intelligence across the capital markets and has since expanded into transaction and corporate banking coverage. Tricumen’s data has been used by many of the world’s leading investment banks as well as strategy consulting firms, investment managers and ‘blue chip’ corporations. Situated near Cambridge in the UK, Tricumen is almost exclusively staffed with senior individuals with an extensive track record of either working for or analysing banks; and boasts what we believe is the largest capital markets-focused research network of its peer group. Notes & Caveats This report and the information contained herein may not be reproduced or distributed in the whole or in part without the prior written consent of Tricumen Limited. Such consent is often given provided that the information released does not prejudice Tricumen Limited’s business or compromise the company’s ability to analyse the financial markets. Tricumen Limited has used all reasonable care in writing, editing and presenting the information found in this report. All reasonable effort has been made to ensure the information supplied is accurate and not misleading. For the purposes of cross- market comparison, all numerical data is normalised in accordance to Tricumen Limited’s proprietary product classification. Fully-researched dataset may contain margin of error of +/-10%; for modelled datasets, this margin may be wider. The information and commentary provided in this report has been compiled for informational purposes only. We recommend that independent advice and enquiries should be sought before acting upon it. Readers should not rely on this information for legal, accounting, investment, or similar purposes. No part of this report constitutes investment advice, any form of recommendation, or a solicitation to buy or sell any instrument or to engage in any trading or investment activity or strategy. Tricumen Limited does not provide investment advice or personal recommendation nor will it be deemed to have done so. Tricumen Limited makes no representation, guarantee or warranty as to the suitability, accuracy or completeness of the report or the information therein. Tricumen Limited assumes no responsibility for information contained in this report and disclaims all liability arising from negligence or otherwise in respect of such information. Tricumen Limited is not liable for any damages arising in contract, tort or otherwise from the use of or inability to use this report or any material contained in it, or from any action or decision taken as a result of using the report. 6/6 14 November 2013