Tricumen / Capital Markets Revenue & Profit rankings FY14_open 230315
•
1 like•374 views

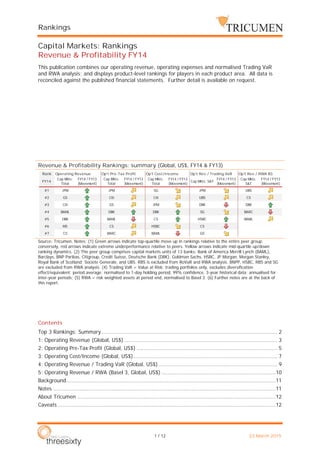
Capital Markets: Revenue & Profitability rankings FY14 This publication combines our operating revenue, operating expenses and normalised Trading VaR and RWA analysis; and displays product-level rankings for players in each product area. All data is reconciled against the published financial statements. Further detail is available on request.

Recommended
Recommended
More Related Content
Similar to Tricumen / Capital Markets Revenue & Profit rankings FY14_open 230315
Similar to Tricumen / Capital Markets Revenue & Profit rankings FY14_open 230315 (20)
More from Tricumen Ltd
More from Tricumen Ltd (20)
Recently uploaded
Recently uploaded (20)
Tricumen / Capital Markets Revenue & Profit rankings FY14_open 230315
- 1. Rankings 1 / 12 23 March 2015 Capital Markets: Rankings Revenue & Profitability FY14 This publication combines our operating revenue, operating expenses and normalised Trading VaR and RWA analysis; and displays product-level rankings for players in each product area. All data is reconciled against the published financial statements. Further detail is available on request. Revenue & Profitability Rankings: summary (Global, US$, FY14 & FY13) Source: Tricumen. Notes: (1) Green arrows indicate top-quartile move up in rankings relative to the entire peer group; conversely, red arrows indicate extreme underperformance relative to peers. Yellow arrows indicate mid-quartile up/down ranking dynamics. (2) The peer group comprises capital markets units of 13 banks: Bank of America Merrill Lynch (BAML), Barclays, BNP Paribas, Citigroup, Credit Suisse, Deutsche Bank (DBK), Goldman Sachs, HSBC, JP Morgan, Morgan Stanley, Royal Bank of Scotland; Societe Generale, and UBS. RBS is excluded from RoVaR and RWA analysis. BNPP, HSBC, RBS and SG are excluded from RWA analysis. (4) Trading VaR = Value at Risk; trading portfolios only, excludes diversification effect/equivalent; period average; normalised to 1-day holding period, 99% confidence, 3-year historical data; annualised for inter-year periods; (5) RWA = risk weighted assets at period end, normalised to Basel 3. (6) Further notes are at the back of this report. Contents Top 3 Rankings: Summary ............................................................................................................. 2 1: Operating Revenue (Global, US$) ............................................................................................... 3 2: Operating Pre-Tax Profit (Global, US$) ....................................................................................... 5 3: Operating Cost/Income (Global, US$) ......................................................................................... 7 4: Operating Revenue / Trading VaR (Global, US$).......................................................................... 9 5: Operating Revenue / RWA (Basel 3, Global, US$) .......................................................................10 Background..................................................................................................................................11 Notes ..........................................................................................................................................11 About Tricumen ...........................................................................................................................12 Caveats .......................................................................................................................................12 Rank Operating Revenue Op't Pre-Tax Profit Op't Cost/Income Op't Rev / Trading VaR Op't Rev / RWA B3 #1 JPM JPM SG JPM UBS #2 GS Citi Citi UBS CS #3 Citi GS JPM DBK DBK #4 BAML DBK DBK SG BARC #5 DBK BAML CS HSBC BAML #6 MS CS HSBC CS #7 CS BARC BAML GS Cap Mkts: Total Cap Mkts: Total FY14 / FY13 (Movement) FY14 Cap Mkts: S&T FY14 / FY13 (Movement) FY14 / FY13 (Movement) Cap Mkts: Total FY14 / FY13 (Movement) Cap Mkts: S&T FY14 / FY13 (Movement)
- 2. Rankings 2 / 12 23 March 2015 Top 3 Rankings: Summary Revenue & Profitability Rankings: Top 3 by Level 1 products (Global, US$, FY14) Source: Tricumen. Notes: (1) Each product category is calculated separately. Rankings are based on ordinal (‘1234’) system, with no shared rankings. (2) Further notes are at the back of this report. 1 Op't revenue post-w/down (US$) BAML BARC BNPP Citi CS DBK GS HSBC JPM MS RBS SG UBS Capital Markets: Total #3 #2 #1 Capital Markets: Primary #3 #2 #1 DCM Bonds #3 #2 #1 DCM Loans #2 #3 #1 Securitisation #1 #2 #3 ECM #1 #3 #2 M&A / Advisory #1 #3 #2 Capital Markets: Sales & Trading #3 #2 #1 FICC FX #2 #1 #3 FICC Rates #3 #2 #1 FICC Credit #1 #3 #2 FICC Commodities #3 #1 #2 EQ Cash #2 #3 #1 EQ Derv & Converts #3 #1 #2 Prime Services #3 #1 #2 2 Op't Pre-Tax Profit (US$) BAML BARC BNPP Citi CS DBK GS HSBC JPM MS RBS SG UBS Capital Markets: Total #2 #3 #1 Capital Markets: Primary #2 #3 #1 DCM Bonds #2 #1 #3 DCM Loans #2 #3 #1 Securitisation #3 #1 #2 ECM #3 #2 #1 M&A / Advisory #2 #1 #3 Capital Markets: Sales & Trading #1 #3 #2 FICC FX #2 #3 #1 FICC Rates #3 #2 #1 FICC Credit #3 #1 #2 FICC Commodities #2 #3 #1 EQ Cash #2 #3 #1 EQ Derv & Converts #2 #3 #1 Prime Services #3 #2 #1 3 Op't Cost/Income BAML BARC BNPP Citi CS DBK GS HSBC JPM MS RBS SG UBS Capital Markets: Total #2 #3 #1 Capital Markets: Primary #2 #3 #1 DCM Bonds #1 #2 #3 DCM Loans #3 #2 #1 Securitisation #1 #3 #2 ECM #3 #1 #2 M&A / Advisory #3 #1 #2 Capital Markets: Sales & Trading #2 #3 #1 FICC FX #3 #2 #1 FICC Rates #3 #2 #1 FICC Credit #3 #1 #2 #2 #3 FICC Commodities #1 #3 #2 EQ Cash #2 #3 #1 EQ Derv & Converts #3 #1 #2 Prime Services #2 #3 #1 5 Op't Revenue / Trading VaR (US$) BAML BARC BNPP Citi CS DBK GS HSBC JPM MS RBS SG UBS Capital Markets: Sales & Trading #3 #1 #2 FICC FX #3 #1 #2 FICC Rates #2 #1 #3 FICC Credit #2 #3 #1 FICC Commodities #3 #2 #1 EQ Cash #3 #2 #1 EQ Derv & Converts #3 #2 #1 6 Op't Revenue / RWA B3 (US$) BAML BARC Citi CS DBK GS JPM MS UBS Capital Markets: Sales & Trading #3 #2 #1 FICC FX #3 #2 #1 FICC Rates #3 #2 #1 FICC Credit #3 #1 #2 FICC Commodities #2 #3 #1 EQ Cash #3 #2 #1 EQ Derv & Converts #1 #2 #3 Prime Services #1 #2 #3
- 3. Rankings 3 / 12 23 March 2015 1: Operating Revenue (Global, US$) Capital Markets: TOTAL Capital Markets: Primary DCM Bonds ECM IPO & APO & Converts DCM Loans M&A / Advisory Securitisation Source: Tricumen. Notes: (1) Arrows indicate movement in ranking relative to the entire peer group; up/green arrows indicate Top 25% performance, red/down arrows indicate Bottom 25% performance. Top/Bottom Quartile values are calculated for the entire peer group, in US$. Each product category is calculated separately. Rankings are based on ordinal (‘1234’) system, with no shared rankings. (2) Further notes are at the back of this report. FY13 FY14 JPM #1 #1 GS #2 #2 Citi #3 #3 BAML #4 #4 DBK #5 #5 MS #6 #6 CS #7 #7 Rank FY14 / FY13 (Movement) FY13 FY14 JPM #1 #1 GS #3 #2 BAML #2 #3 CS #4 #4 MS #7 #5 Citi #6 #6 DBK #5 #7 Rank FY14 / FY13 (Movement) FY13 FY14 JPM #1 #1 DBK #4 #2 Citi #6 #3 BAML #2 #4 GS #5 #5 CS #3 #6 MS #7 #7 Rank FY14 / FY13 (Movement) FY13 FY14 GS #1 #1 MS #4 #2 JPM #2 #3 BAML #3 #4 Citi #5 #5 DBK #6 #6 CS #8 #7 Rank FY14 / FY13 (Movement) FY13 FY14 JPM #1 #1 BAML #2 #2 DBK #3 #3 Citi #5 #4 CS #6 #5 BARC #4 #6 GS #7 #7 Rank FY14 / FY13 (Movement) FY13 FY14 GS #1 #1 MS #3 #2 JPM #2 #3 BAML #4 #4 BARC #5 #5 Citi #6 #6 CS #7 #7 Rank FY14 / FY13 (Movement) FY13 FY14 CS #1 #1 JPM #3 #2 RBS #2 #3 BAML #5 #4 DBK #4 #5 GS #6 #6 Citi #7 #7 Rank FY14 / FY13 (Movement)
- 4. Rankings 4 / 12 23 March 2015 1: Operating Revenue (Global, US$) (cont.) Capital Markets: Sales & Trading FICC FX EQ Cash FICC Rates EQ Derv & Converts FICC Credit Prime Services FICC Commodities Source: Tricumen. Notes: (1) Arrows indicate movement in ranking relative to the entire peer group; up/green arrows indicate Top 25% performance, red/down arrows indicate Bottom 25% performance. Top/Bottom Quartile values are calculated for the entire peer group, in US$. Each product category is calculated separately. Rankings are based on ordinal (‘1234’) system, with no shared rankings. (2) Further notes are at the back of this report. FY13 FY14 JPM #1 #1 GS #3 #2 Citi #2 #3 BAML #4 #4 DBK #5 #5 MS #6 #6 HSBC #8 #7 Rank FY14 / FY13 (Movement) FY13 FY14 HSBC #1 #1 Citi #2 #2 JPM #3 #3 DBK #4 #4 BAML #6 #5 GS #9 #6 RBS #5 #7 Rank FY14 / FY13 (Movement) FY13 FY14 MS #2 #1 BAML #3 #2 GS #1 #3 UBS #4 #4 DBK #7 #5 Citi #5 #6 CS #6 #7 Rank FY14 / FY13 (Movement) FY13 FY14 JPM #1 #1 Citi #2 #2 BAML #3 #3 GS #4 #4 DBK #5 #5 HSBC #6 #6 MS #10 #7 Rank FY14 / FY13 (Movement) FY13 FY14 JPM #2 #1 SG #1 #2 CS #4 #3 DBK #5 #4 BARC #3 #5 GS #6 #6 BAML #7 #7 Rank FY14 / FY13 (Movement) FY13 FY14 Citi #1 #1 GS #2 #2 DBK #4 #3 BAML #5 #4 JPM #3 #5 CS #6 #6 BARC #9 #7 Rank FY14 / FY13 (Movement) FY13 FY14 MS #1 #1 UBS #2 #2 GS #3 #3 CS #4 #4 BARC #5 #5 JPM #6 #6 DBK #7 #7 Rank FY14 / FY13 (Movement) FY13 FY14 GS #1 #1 MS #2 #2 BAML #4 #3 JPM #3 #4 Citi #8 #5 BNPP #7 #6 DBK #5 #7 Rank FY14 / FY13 (Movement)
- 5. Rankings 5 / 12 23 March 2015 2: Operating Pre-Tax Profit (Global, US$) Capital Markets: TOTAL Capital Markets: Primary DCM Bonds ECM IPO & APO & Converts DCM Loans M&A / Advisory Securitisation Source: Tricumen. Notes: (1) Arrows indicate movement in ranking relative to the entire peer group; up/green arrows indicate Top 25% performance, red/down arrows indicate Bottom 25% performance. Top/Bottom Quartile values are calculated for the entire peer group, in US$. Each product category is calculated separately. Rankings are based on ordinal (‘1234’) system, with no shared rankings. (2) Further notes are at the back of this report. FY13 FY14 JPM #1 #1 Citi #2 #2 GS #3 #3 DBK #5 #4 BAML #4 #5 CS #6 #6 BARC #7 #7 Rank FY14 / FY13 (Movement) FY13 FY14 JPM #1 #1 BAML #2 #2 GS #5 #3 CS #3 #4 MS #9 #5 DBK #6 #6 Citi #4 #7 Rank FY14 / FY13 (Movement) FY13 FY14 JPM #1 #1 DBK #3 #2 MS #9 #3 BAML #2 #4 GS #6 #5 CS #4 #6 Citi #5 #7 Rank FY14 / FY13 (Movement) FY13 FY14 MS #8 #1 JPM #1 #2 GS #2 #3 BAML #3 #4 Citi #4 #5 DBK #5 #6 CS #6 #7 Rank FY14 / FY13 (Movement) FY13 FY14 JPM #1 #1 BAML #2 #2 CS #5 #3 DBK #3 #4 Citi #6 #5 BARC #4 #6 MS #7 #7 Rank FY14 / FY13 (Movement) FY13 FY14 GS #1 #1 BARC #2 #2 MS #7 #3 JPM #4 #4 BAML #3 #5 Citi #5 #6 UBS #6 #7 Rank FY14 / FY13 (Movement) FY13 FY14 CS #2 #1 JPM #1 #2 BAML #3 #3 DBK #6 #4 RBS #4 #5 Citi #5 #6 GS #7 #7 Rank FY14 / FY13 (Movement)
- 6. Rankings 6 / 12 23 March 2015 2: Operating Pre-Tax Profit (Global, US$) (cont.) Capital Markets: Sales & Trading FICC FX EQ Cash FICC Rates EQ Derv & Converts FICC Credit Prime Services FICC Commodities Source: Tricumen. Notes: (1) Arrows indicate movement in ranking relative to the entire peer group; up/green arrows indicate Top 25% performance, red/down arrows indicate Bottom 25% performance. Top/Bottom Quartile values are calculated for the entire peer group, in US$. Each product category is calculated separately. Rankings are based on ordinal (‘1234’) system, with no shared rankings. (2) Further notes are at the back of this report. FY13 FY14 Citi #1 #1 JPM #2 #2 DBK #4 #3 GS #3 #4 HSBC #5 #5 SG #11 #6 BAML #6 #7 Rank FY14 / FY13 (Movement) FY13 FY14 HSBC #1 #1 Citi #2 #2 DBK #3 #3 JPM #4 #4 BARC #6 #5 BAML #7 #6 CS #9 #7 Rank FY14 / FY13 (Movement) FY13 FY14 UBS #1 #1 Citi #5 #2 GS #2 #3 HSBC #3 #4 DBK #4 #5 CS #7 #6 BAML #11 #7 Rank FY14 / FY13 (Movement) FY13 FY14 JPM #1 #1 GS #3 #2 Citi #2 #3 HSBC #6 #4 SG #7 #5 BAML #4 #6 DBK #5 #7 Rank FY14 / FY13 (Movement) FY13 FY14 SG #7 #1 Citi #2 #2 JPM #1 #3 GS #5 #4 DBK #3 #5 UBS #6 #6 BARC #4 #7 Rank FY14 / FY13 (Movement) FY13 FY14 Citi #1 #1 DBK #5 #2 BAML #3 #3 JPM #4 #4 GS #2 #5 CS #6 #6 BARC #7 #7 Rank FY14 / FY13 (Movement) FY13 FY14 UBS #1 #1 MS #3 #2 JPM #2 #3 CS #4 #4 BARC #7 #5 Citi #6 #6 DBK #5 #7 Rank FY14 / FY13 (Movement) FY13 FY14 GS #4 #1 BNPP #2 #2 Citi #3 #3 BARC #6 #4 SG #7 #5 UBS #8 #6 DBK #10 #7 Rank FY14 / FY13 (Movement)
- 7. Rankings 7 / 12 23 March 2015 3: Operating Cost/Income (Global, US$) Capital Markets: TOTAL Capital Markets: Primary DCM Bonds ECM IPO & APO & Converts DCM Loans M&A / Advisory Securitisation Source: Tricumen. Notes: (1) Arrows indicate movement in ranking relative to the entire peer group; up/green arrows indicate Top 25% performance, red/down arrows indicate Bottom 25% performance. Top/Bottom Quartile values are calculated for the entire peer group, in US$. Each product category is calculated separately. Rankings are based on ordinal (‘1234’) system, with no shared rankings. (2) Further notes are at the back of this report. FY13 FY14 SG #1 #1 Citi #5 #2 JPM #3 #3 DBK #8 #4 CS #11 #5 HSBC #6 #6 BAML #4 #7 Rank FY14 / FY13 (Movement) FY13 FY14 JPM #2 #1 BAML #3 #2 DBK #4 #3 CS #7 #4 MS #5 #5 Citi #9 #6 GS #8 #7 Rank FY14 / FY13 (Movement) FY13 FY14 GS #7 #1 JPM #1 #2 MS #8 #3 BAML #4 #4 CS #3 #5 DBK #5 #6 BARC #6 #7 Rank FY14 / FY13 (Movement) FY13 FY14 JPM #1 #1 MS #4 #2 DBK #5 #3 BAML #2 #4 Citi #7 #5 GS #8 #6 CS #6 #7 Rank FY14 / FY13 (Movement) FY13 FY14 JPM #2 #1 CS #1 #2 BAML #3 #3 MS #9 #4 DBK #4 #5 BARC #7 #6 Citi #8 #7 Rank FY14 / FY13 (Movement) FY13 FY14 BARC #9 #1 GS #5 #2 BAML #7 #3 MS #4 #4 UBS #2 #5 Citi #8 #6 CS #10 #7 Rank FY14 / FY13 (Movement) FY13 FY14 BAML #2 #1 UBS #5 #2 DBK #1 #3 JPM #3 #4 Citi #10 #5 BARC #4 #6 CS #6 #7 Rank FY14 / FY13 (Movement)
- 8. Rankings 8 / 12 23 March 2015 3: Operating Cost/Income (Global, US$) (cont.) Capital Markets: Sales & Trading FICC FX EQ Cash FICC Rates EQ Derv & Converts FICC Credit Prime Services FICC Commodities Source: Tricumen. Notes: (1) Arrows indicate movement in ranking relative to the entire peer group; up/green arrows indicate Top 25% performance, red/down arrows indicate Bottom 25% performance. Top/Bottom Quartile values are calculated for the entire peer group, in US$. Each product category is calculated separately. Rankings are based on ordinal (‘1234’) system, with no shared rankings. (2) Further notes are at the back of this report. FY13 FY14 SG #1 #1 Citi #4 #2 HSBC #3 #3 DBK #9 #4 JPM #5 #5 BNPP #12 #6 GS #7 #7 Rank FY14 / FY13 (Movement) FY13 FY14 SG #1 #1 Citi #3 #2 BNPP #11 #3 HSBC #6 #4 DBK #9 #5 CS #12 #6 JPM #4 #7 Rank FY14 / FY13 (Movement) FY13 FY14 UBS #12 #1 HSBC #1 #2 SG #2 #3 GS #3 #4 Citi #9 #5 DBK #4 #6 CS #10 #7 Rank FY14 / FY13 (Movement) FY13 FY14 SG #1 #1 HSBC #3 #2 Citi #4 #3 JPM #5 #4 GS #6 #5 DBK #10 #6 BAML #7 #7 Rank FY14 / FY13 (Movement) FY13 FY14 SG #1 #1 UBS #12 #2 GS #2 #3 DBK #3 #4 JPM #4 #5 Citi #13 #6 BNPP #11 #7 Rank FY14 / FY13 (Movement) FY13 FY14 Citi #2 #1 DBK #8 #2 RBS #12 #3 BAML #3 #4 JPM #4 #5 SG #6 #6 CS #10 #7 Rank FY14 / FY13 (Movement) FY13 FY14 UBS #11 #1 Citi #7 #2 DBK #1 #3 CS #9 #4 HSBC #5 #5 BARC #8 #6 MS #6 #7 Rank FY14 / FY13 (Movement) FY13 FY14 BNPP #1 #1 UBS #12 #2 SG #2 #3 BARC #5 #4 GS #9 #5 Citi #10 #6 DBK #8 #7 Rank FY14 / FY13 (Movement)
- 9. Rankings 9 / 12 23 March 2015 4: Operating Revenue / Trading VaR (Global, US$) Capital Markets: Sales & Trading FICC FX EQ Cash FICC Rates EQ Derv & Converts FICC Credit FICC Commodities Source: Tricumen. Notes: (1) VaR = Value at Risk; trading portfolios only, excludes diversification effect/equivalent; period average; normalised to 1-day holding period, 99% confidence, 3-year historical data; annualised for inter-year periods; (2) The peer group comprises capital markets units of 12 banks: Bank of America Merrill Lynch (BAML), Barclays, BNP Paribas, Citigroup, Credit Suisse, Deutsche Bank (DBK), Goldman Sachs, HSBC, JP Morgan, Morgan Stanley; Societe Generale, and UBS. (3) Arrows indicate movement in ranking relative to the entire peer group, in US$; up/green arrows indicate Top 25% performance, red/down arrows indicate Bottom 25% performance. (4) Each product category is calculated separately. Rankings are based on ordinal (‘1234’) system, with no shared rankings. (5) Further Notes & Caveats are at the back of this report. FY13 FY14 JPM #1 #1 UBS #3 #2 DBK #2 #3 SG #4 #4 HSBC #8 #5 CS #5 #6 GS #7 #7 Rank FY14 / FY13 (Movement) FY13 FY14 SG #7 #1 UBS #2 #2 JPM #1 #3 HSBC #4 #4 DBK #5 #5 BARC #6 #6 Citi #3 #7 Rank FY14 / FY13 (Movement) FY13 FY14 SG #1 #1 JPM #2 #2 BARC #5 #3 CS #3 #4 UBS #4 #5 BAML #10 #6 DBK #6 #7 Rank FY14 / FY13 (Movement) FY13 FY14 DBK #4 #1 Citi #5 #2 JPM #1 #3 CS #6 #4 BARC #2 #5 UBS #9 #6 GS #3 #7 Rank FY14 / FY13 (Movement) FY13 FY14 SG #2 #1 JPM #1 #2 HSBC #9 #3 UBS #3 #4 BAML #11 #5 BARC #5 #6 DBK #6 #7 Rank FY14 / FY13 (Movement) FY13 FY14 JPM #2 #1 DBK #1 #2 GS #3 #3 BNPP #5 #4 UBS #12 #5 SG #8 #6 CS #6 #7 Rank FY14 / FY13 (Movement) FY13 FY14 HSBC #1 #1 DBK #9 #2 CS #2 #3 JPM #7 #4 BARC #10 #5 BAML #6 #6 GS #4 #7 Rank FY14 / FY13 (Movement)
- 10. Rankings 10 / 12 23 March 2015 5: Operating Revenue / RWA (Basel 3, Global, US$) Capital Markets: Sales & Trading FICC FX EQ Cash FICC Rates EQ Derv & Converts FICC Credit Prime Services FICC Commodities Source: Tricumen. Notes: (1) RWA = risk weighted assets at period end; normalised to Basel 3 standard. Dedicated proprietary trading, principal investments and banking/primary revenue and fees are excluded. (2) The peer group comprises capital markets units of 9 banks: Bank of America Merrill Lynch, Barclays, Citigroup, Credit Suisse, Deutsche Bank (DBK), Goldman Sachs, JP Morgan, Morgan Stanley; and UBS. (3) Arrows indicate movement in ranking relative to the entire peer group; up/green arrows indicate Top 25% performance, red/down arrows indicate Bottom 25% performance. Top/Bottom Quartile values are calculated for the entire peer group, in US$. Each product category is calculated separately. Rankings are based on ordinal (‘1234’) system, with no shared rankings. (4) Further notes are at the back of this report. FY13 FY14 UBS #1 #1 DBK #4 #2 BARC #2 #3 CS #3 #4 BAML #6 #5 Rank FY14 / FY13 (Movement) FY13 FY14 UBS #1 #1 DBK #4 #2 BARC #2 #3 CS #3 #4 BAML #6 #5 Rank FY14 / FY13 (Movement) FY13 FY14 UBS #1 #1 DBK #3 #2 BAML #5 #3 BARC #2 #4 CS #4 #5 Rank FY14 / FY13 (Movement) FY13 FY14 UBS #1 #1 BARC #2 #2 BAML #3 #3 DBK #5 #4 Citi #4 #5 Rank FY14 / FY13 (Movement) FY13 FY14 BARC #1 #1 DBK #3 #2 UBS #2 #3 CS #4 #4 BAML #6 #5 Rank FY14 / FY13 (Movement) FY13 FY14 CS #1 #1 DBK #2 #2 BARC #3 #3 Citi #4 #4 BAML #6 #5 Rank FY14 / FY13 (Movement) FY13 FY14 BARC #2 #1 DBK #5 #2 UBS #1 #3 MS #3 #4 BAML #4 #5 Rank FY14 / FY13 (Movement) FY13 FY14 GS #4 #1 BAML #3 #2 DBK #7 #3 MS #5 #4 UBS #1 #5 Rank FY14 / FY13 (Movement)
- 11. Rankings 11 / 12 23 March 2015 Background The environment in which investment banks now operate is undergoing a profound change. Tighter margins, increased capital constraints and the looming threats of a variety of event risks (such as the ongoing Eurozone sovereign saga) dominate the agenda, underscoring the importance of timely and granular performance benchmarks. Comparison between seemingly similar product groups at different banks is fraught with difficulty, however: for example, product definitions and revenue recognition policies vary between banks, as does operating cost and risk allocation. On top of this, regulatory hurdles currently demanded by each jurisdiction vary and are, in our opinion, far from being harmonised. Tricumen’s 360-degree analysis seeks to address some of these issues by normalising banks’ performance parameters. The result is that the true profitability of individual banks’ business lines becomes more transparent and comparable to their peers. The current dataset, developed partly in conjunction with our industry expert partners, covers 13 key capital markets players: Bank of America Merrill Lynch, Barclays, BNP Paribas, Citi, Credit Suisse, Deutsche Bank, Goldman Sachs, HSBC, JP Morgan, Morgan Stanley, Royal Bank of Scotland, Societe Generale and UBS. Key features are that it: …covers the main (‘Level 1’) products globally and in EMEA, Americas and APAC; …is normalised for accounting and regulatory differences; …is fully reconciled against the banks’ financial reporting; …is back-dated, on normalised basis, to 2005. Notes 1. Tricumen Product definitions used throughout. 2. In instances where a bank has changed its reporting format – often reflecting an introduction of a new corporate structure - Tricumen restated all historical data, typically going back to 2005. 3. Pre-Tax Profit: Operating Revenue net of allocated Comp & Benefits and non-Comp operating expenses. 4. Operating revenue: Post-writedowns/writebacks; DVA and one-off items occurring outside of the regular course of business are excluded; operating items attributable to Capital Markets, wherever booked (e.g. in Corporate Centre), are added back. 5. Operating expenses exclude one-off non-operational items, insurance-related benefits & claims, and credit expense/recovery/NPL provisions. Capital expenditure is included as accrued. (a) Compensation and benefits includes calendar period salary, bonus, amortised equity awards and severance payments. Re-allocations from the Corporate Centre are also included. The full version of the dataset features fully researched, product-level comp and benefits and non- comp expenses, at the regional level. (b) Non-comp expenses are adjusted for significant investments/disposals on an ongoing basis, then modelled. Non-comp expenses include technology & operations (including staff comp & benefits), occupancy, depreciation & amortisation, and corporate overhead. Corporate overhead includes legal provisions; the actual legal fees incurred are, where meaningful, allocated to front office directs. 6. Front office headcounts are defined as full-time equivalent (FTE) and are adjusted for seniority. The full version of our dataset also features role types (coverage, sales, trading, support, and others), by products and regions. 7. VaR = Value at Risk; trading portfolios only, excludes diversification effect/equivalent; period average; modelled and normalised to 1-day holding period, 99% confidence, 3-year historical data; annualised for inter-year periods; 8. RWA = Risk Weighted Assets; normalised to Basel 3 standard. 9. All financial data is fully reconciled against the published financial statements. 10. Top/Bottom Quartile is based on the entire peer group included in the report.
- 12. Rankings 12 / 12 23 March 2015 About Tricumen Tricumen was founded in 2008. It quickly become a strong provider of diversified market intelligence across the capital markets and has since expanded into transaction and corporate banking coverage. Tricumen’s data has been used by many of the world’s leading investment banks as well as strategy consulting firms, investment managers and ‘blue chip’ corporations. Situated near Cambridge in the UK, Tricumen is almost exclusively staffed with senior individuals with an extensive track record of either working for or analysing banks; and boasts what we believe is the largest capital markets-focused research network of its peer group. Caveats No part of this document may be reproduced or transmitted in any form by any means without written permission of Tricumen Limited. Such consent is often given, provided that the information released is sourced to Tricumen and that it does not prejudice Tricumen Limited’s business or compromise the company’s ability to analyse the financial markets. Full acknowledgement of Tricumen Limited must be given. Tricumen Limited has used all reasonable care in writing, editing and presenting the information found in this report. All reasonable effort has been made to ensure the information supplied is accurate and not misleading. For the purposes of cross- market comparison, all numerical data is normalised in accordance to Tricumen Limited’s proprietary product classification. Fully-researched dataset may contain margin of error of 10%; for modelled datasets, this margin may be wider. The information and commentary provided in this report has been compiled for informational purposes only. We recommend that independent advice and enquiries should be sought before acting upon it. Readers should not rely on this information for legal, accounting, investment, or similar purposes. No part of this report constitutes investment advice, any form of recommendation, or a solicitation to buy or sell any instrument or to engage in any trading or investment activity or strategy. Tricumen Limited does not provide investment advice or personal recommendation nor will it be deemed to have done so. Tricumen Limited makes no representation, guarantee or warranty as to the suitability, accuracy or completeness of the report or the information therein. Tricumen Limited assumes no responsibility for information contained in this report and disclaims all liability arising from negligence or otherwise in respect of such information. Tricumen Limited is not liable for any damages arising in contract, tort or otherwise from the use of or inability to use this report or any material contained in it, or from any action or decision taken as a result of using the report. © Tricumen Limited 2014. All rights reserved