1. Detecting and Decoding Barcodes in Images
Daniel Taller
Research Adviser: Roberto Manduchi
Grad Student: Orazio Gallo
Introduction Barcode Localization Barcode Decoding Conclusions
o For the past several decades, handheld laser
scanners allow workers in stores to read barcodes
o It would be desirable to allow consumers to read
barcodes via camera phone to quickly find product
descriptions, reviews, and pricing information
o Current methods are not robust due to dim,
unfocused, noisy, or low-resolution image data.
oThis research focuses on making more efficient
and robust algorithms to localize and then decode
barcodes within images.
Fig 1. A cell phone is used to scan a barcode. This
technology may become ubiquitous if algorithms to
localize and decode barcodes can be made more robust.
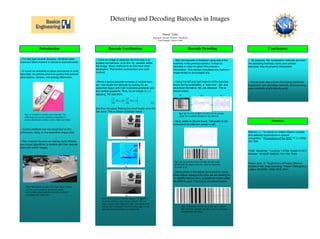
o Once an image is obtained, the first step is to
localize the barcode, or to find its location within
the image. Many methods to do this have been
developed. This section summarizes one such
method.
oSince a typical barcode consists of vertical bars,
we may locate the barcode by looking for an
extended region with high horizontal gradients and
low vertical gradients. Thus, for an image ,
applying the operation
(1)
and then low-pass filtering the result leads us to the
bar code. This is shown pictorially below
Fig 2. Although the barcode in the image above is blurry
and the scene is cluttered, the barcode can be
successfully localized and decoded using methods
developed at UC Santa Cruz.
),(),( yxI
y
yxI
x ∂
∂
−
∂
∂
(a)
(b)
(c)
Fig 3. (a) The original image (b) Equation 1 is applied to
the image, and the result is low-pass filtered . The red
region, which is of the highest intensity, corresponds to the
barcode. (c) The barcode is localized using image b). Left
and right barcode boundaries are determined.
),( yxI
o After the barcode is localized using one of the
methods in the previous section, it must be
decoded in order to obtain the product’s
information. This section discusses one method I
implemented to accomplish this.
o Using the left and right bounds of the barcode
found during localization, a “scan line”, s(t), and
smoothed derivative, f(t), are obtained. This is
shown below:
o Next, peaks in f(t) are found. The peaks in f(t)
correspond to inflection points in s(t):
o Some peaks in the signal correspond to noise,
while others represent the bars we are looking for.
To identify the true bars, a statistical model called
an HMM is used. The results are shown below:
o By applying the localization methods and then
the decoding methods, blurry and unclear
barcodes may be properly interpreted.
o Future work may involve developing additional
localization and decoding methods, and improving
upon methods which already exist.
Sources
Rabiner, Lr. "A tutorial on hidden Markov models
and selected applications in speech
recognition." Proceedings of the IEEE 77.2 (1989):
257-286.
Tropf, Alexander. "Locating 1-D Bar Codes in DCT-
Domain." ICASSP 2(2006): 741-744. Print.
Kresic-Juric, S. "Applications of hidden Markov
models in bar code decoding." Pattern Recognition
Letters 27(2006): 1665-1672. Print.
Fig 4. (a) The barcode (b) A scan-line from the barcode,
s(t) (c) The smoothed derivative of s(t), called f(t)
Fig 5. (a) The derivative of the scan-line, f(t), with peaks
identified (b) The edges of the bars, which correspond to
the peaks of (a)
Fig 5. Final Result. The left side of each bar is marked
with a red circle, the right side with a red circle, and noise
is marked with red crosses
(a) (b) (c)
(a)
(b)