CEI-BEI Dashboard
•
1 like•262 views

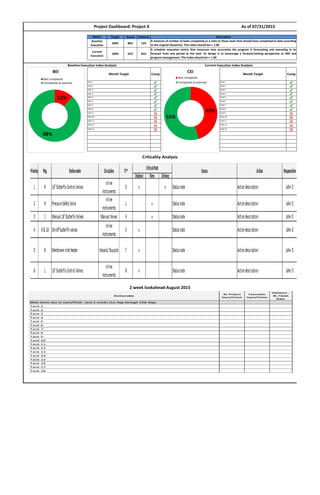
The project dashboard shows the target, actual, and variance percentages for two metrics measuring project completion. For the first metric, the completion was 88% against a target of 100%, resulting in a variance of 12%. For the second metric, completion was 55% against a target of 100%, with a variance of 45%. A schedule execution index of 1.00 or greater indicates the project is forecasting and executing accurately from period to period.

Recommended
More Related Content
What's hot
What's hot (20)
Similar to CEI-BEI Dashboard
Similar to CEI-BEI Dashboard (20)
CEI-BEI Dashboard
- 1. Target Actual Variance 100% 88% 12% 100% 55% 45% Comp Comp Project Dashboard: Project X A measure of number of tasks completed as a ratio to those tasks that should have completed to date according to the original (baseline). This index should be>= 1.00 Task 4 Task 5 Task 6 Task 3 Month Target Task 1 Task 5 Task 6 Task 12 As of 07/31/2015 Baseline Execution Index Analysis Current Execution Index Analysis Metric Description A schedule execution metric that measures how accurately the program is forecasting and executing to its forecast from one period to the next. Its design is to encourage a forward-looking perspective to IMS and program management. This index should be>= 1.00 Task 2 Task 3 Task 4 Task 1 Task 2 Baseline Execution Current Execution Task 12 Task 11 Month Target Task 7 Task 8 Task 9 Task 10 Task 7 Task 8 Task 9 Task 10 Task 11 Criticality Analysis Task 13 2 week lookahead-August 2015 Task 13 12% 88% BEI Not completed Completed as planned 45% 55% CEI Not completed Completed as planned