1. A STUDY ON THE EFFECT OF VARIOUS PARAMETERS ON THE P-V DIAGRAM
OF OTTO CYCLE USING OCTAVE –
- Cyril Mathew Samuel
The effect of the following parameters on the P –V
diagram were studied-
1. Bore of the engine cylinder
2. Stroke Length
3. Compression Ratio
4. Pressure before start of compression
The iterative process was done using functions , which
performed all the calculations under variable input
conditions . The function “ottofunctioncr “ has input
arguments as Compression Ratio , Bore , Stroke ,
Connecting Rod Length and Pressure before compression
.The output of the function is the volume and pressure
traces of all the four processes in the Otto Cycle .
The volume trace for the sections in the Otto Cycle was
performed using another function “EGK “. Function EGK
had bore, stroke, connecting rod length , compression
ratio and starting and ending crank angles as input
parameters .
The function EGK was programmed to be called from
function ottofunctioncr , which was in turn called from
the main program .
Figure 1 : Function EGK
Figure 2 : Function call to Function ‘ottofunctioncr‘
Effect of Compression Ratio on P-V Diagram
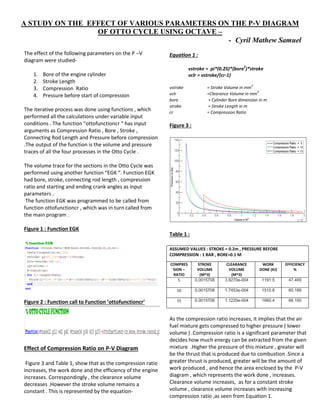
Figure 3 and Table 1, show that as the compression ratio
increases, the work done and the efficiency of the engine
increases. Correspondingly , the clearance volume
decreases .However the stroke volume remains a
constant . This is represented by the equation-
Equation 1 :
vstroke = pi*(0.25)*(bore
2
)*stroke
vclr = vstroke/(cr-1)
vstroke = Stroke Volume in mm
3
vclr =Clearance Volume in mm
3
bore = Cylinder Bore dimension in m
stroke = Stroke Length in m
cr = Compression Ratio
Figure 3 :
Table 1 :
ASSUMED VALUES : STROKE = 0.2m , PRESSURE BEFORE
COMPRESSION : 1 BAR , BORE=0.1 M
COMPRES
SION –
RATIO
STROKE
VOLUME
(M^3)
CLEARANCE
VOLUME
(M^3)
WORK
DONE (KJ)
EFFICIENCY
%
5 0.0015708 3.9270e-004 1191.5 47.469
10 0.0015708 1.7453e-004 1510.8 60.189
15 0.0015708 1.1220e-004 1660.4 66.150
As the compression ratio increases, it implies that the air
fuel mixture gets compressed to higher pressure ( lower
volume ) .Compression ratio is a significant parameter that
decides how much energy can be extracted from the given
mixture .Higher the pressure of this mixture , greater will
be the thrust that is produced due to combustion .Since a
greater thrust is produced, greater will be the amount of
work produced , and hence the area enclosed by the P-V
diagram , which represents the work done , increases.
Clearance volume increases, as for a constant stroke
volume , clearance volume increases with increasing
compression ratio ,as seen from Equation 1.
2. Effect of Pressure before Compression on P-V
Diagram
Figure 4 :
Table 2 :
ASSUMED VALUES : STROKE = 0.2m , COMPRESSION RATIO =5 ,
BORE=0.1 M
PRESSURE
BEFORE
COMPRES
ION (IN
BAR)
STROKE
VOLUME
(IN M^3)
CLEARANCE
VOLUME (IN
M^3)
WORK
DONE
(IN KJ)
EFFICIENCY
(%)
PEAK
PRESSUR
E IN
CYCLE IN
BAR
1 0.0015 3.9270e-004 1191.5 47.469 35.246
3 54.283
5 73.319
From Figure 4 and Table 2 it is evident that the area
enclosed by the P-V diagram remains the same , and that
the maximum pressure values alone show an increasing
trend with increasing pressure before compression . The
work still remains same because the maximum pressure
developed can be considered as proportional to the
pressure before compression .This means that the net
area enclosed in the PV diagram would still remain the
same . Variation in pressure before compression has no
effect on the clearance and stroke volume.
Effect of Stroke Length on the P-V Diagram
From the graph , it can be observed that stroke volume
and clearance volume increases with increasing stroke
length.The maximum pressure of the cycle decreases
with increasing stroke length. However Work done ie the
area enclosed by the P-V diagram remains the same .
Figure 5:
Table 3:
ASSUMED VALUES : PRESSURE BEFORE COMPRESSION = 1 BAR
COMPRESSION RATIO =5 , BORE=0.1 m
STROKE
LENGTH
(IN M )
STROKE
VOLUME
(IN M^3)
CLEARANCE
VOLUME (IN
M^3)
WORK
DONE
(IN KJ)
EFFICI
ENCY
(%)
PEAK
PRESSURE IN
CYCLE
(IN BAR)
0.2 0.00157 3.9270e-004 1191.5 47.46
9
35.246
0.3 0.00235 5.8905e-004 26.2
0.4 0.00314 7.8540e-004 22.33
From the graph , it can be observed that stroke volume
and clearance volume increases with increasing stroke
length. The maximum pressure of the cycle decreases
with increasing stroke length. However work done i.e.
the area enclosed by the P-V diagram remains the
same.
The effect on stoke and clearance volume can be clearly
seen from Equation 1 .The observation of decreasing
peak pressure with increasing stroke length , can be
understood from that fact that for a given compression
ratio ,an increasing stroke length would increase stroke
and clearance volume . Thus the condition with longest
stroke length would have a higher value of clearance
volume . This means that the corresponding pressure
will be reduced. This explains the trend. A possible
explanation for work done remaining the same would
be that the area enclosed by the P-V diagram remains
the same – as pressure values reduce with increasing
stroke, volume values increase , thus having no net
change on the area.
3. -
Effect of Bore Dimensions on P-V Diagram
Figure 6 :
Table 4 :
ASSUMED VALUES : PRESSURE BEFORE COMPRESSION = 1 BAR
COMPRESSION RATIO =5 STROKE = 0.2M
BORE
DIMENSI
ONS
(IN M)
STROKE
VOLUME
(IN M^3)
CLEARANCE
VOLUME (IN
M^3)
WORK
DONE
(IN KJ)
EFFICIEN
CY
(%)
PEAK
PRESSURE
IN
CYCLE
( IN BAR)
0.1 0.0015 3.9270e-004 1191.5 47.469 35.246
0.12 0.0022 5.6905e-004 27.38
0.15 0.0035 8.8540e-004 20.953
The observations derived from the Figure 6 and table 4
are very similar to the observation seen in the effect of
varying stroke length on P-V diagram . This is because,
from Equation 1 , it can be seen that both bore and
stroke affect the same parameter – stroke volume .This
causes similar variation in clearance volume and peak
pressure , as discussed in the previous case of variable
stroke length . Hence the net work done and efficiency
remain the same.
Conclusions
The conclusions based on the observations seen from
the graphs and tables , can be summarized as follows :
PARAMETER
VARIATION
EFFECT ON
CLEARANC
E VOLUME
EFFECT ON
STROKE
VOLUME
EFFECT ON
WORK
DONE
EFFECT ON
PEAK
PRESSURE
INCREASING
COMPRESSION
RATIO
DECREASES REMAINS
SAME
INCREASES INCREASES
INCREASING
PRESSURE
BEFORE
COMPRESSION
REMAINS
SAME
REMAINS
SAME
REMAINS
SAME
INCREASES
INCREASING
STROKE LENGTH
INCREASES INCREASES REMAINS
SAME
DECREASES
INCREASING
CYLINDER BORE
INCREASES INCREASES REMAINS
SAME
DECREASES