Advanced Mining Economics
•Download as PPTX, PDF•
2 likes•332 views

Beating the NPV discount rate by applying classical economics and optimal cut-off grades. Stockpiling low grade ores provides marginal economic optionality at end of life of mine

Recommended
Recommended
More Related Content
What's hot
What's hot (20)
Similar to Advanced Mining Economics
Similar to Advanced Mining Economics (20)
Recently uploaded
Recently uploaded (20)
Advanced Mining Economics
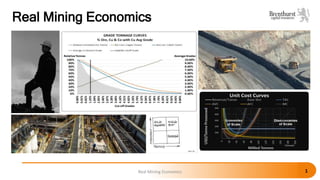
- 1. Real Mining Economics Real Mining Economics 1
- 2. Northern Miner & PwC Round Table 2015 2Real Mining Economics Mining Weekly April 2014 Article: Mining majors prioritizing value over volume as profits, valuations sag Are Miners as Profitable as they Could Be?
- 3. Chasing ones Tail or Delivering Value • Volume over Value 3Real Mining Economics • Value over Volume Root Cause Mining Weekly April 2014 Article: Mining majors prioritizing value over volume as profits, valuations sag
- 4. Portfolio Orebodies Failing to Understand your Ore Bodies Economic Potential can be Fatal 4Real Mining Economics Project 1 Project 2 Project 5
- 5. Understanding your Orebodies 5Real Mining Economics Project 01 Project 02 Project 03 Project 04 Project 05 Project 06 Project 07 Project 08 Project 09 Project 10 Project 11 Project 12 Project 01 Project 02 Project 03 Project 04 Project 05 Project 06 Project 07 Project 08 Project 09 Project 10 Project 11 Project 12 Different Economic Signatures Provide Different Economic Outcomes
- 6. Basic Modelling Philosophy • Objective • Maximize the NPV over the Life of Mine • Determination of the longest Life of Mine at the highest average grade • Operate at optimal economic scale • Method • Determine the optimal economic rate of production • Determine the optimal cut-off grade 6Real Mining Economics Orebody dictates mining footprint
- 7. Basic Philosophy 7Real Mining Economics The Orebody The Orebody The Orebody Cash Flow maximization must be the preoccupation Cash is Fact Profit is Opinion Cash Margin is KING Often Preached Rarely Practiced
- 8. Choice of Mineral Resource Exploitation Focus on Volume & Output 8Real Mining Economics 60 ktpa Targeted Average Grade Significant Determinant of Plant Size which Determines Capital Plant Size determines Pit Size Copper Output Target Determinant of Plant Size Pit Size Determine Capital Expenditure $$ “Forcing the lizard to confess it is a crocodile”
- 9. Choice of Mineral Resource Exploitation Focus on Orebody Capacity and Cash Generation 9Real Mining Economics XX ktpa to Maximize Cash Flow and ROI Optimal Throughput Determines Plant Size and Capital Expenditure Optimal Cut-off and Optimal Production Rate Determines Pit Size and Capital Expenditure $$ “Allowing the Orebody to dictate”
- 10. Production Rate Capex Opex Optimal Grade TAC TVC TFC MC Dollars Tonnes Construction Time LoM Tonnes C/O Grade Avg Grade Optimal Production Rate OBJECTIVES • Cash Maximization • Highest Discounted Cash Flow • Highest IRR • Quickest Payback • Lowest Peak Funding • Lowest Risk Dollars Years - LoM C/O Grade Dollars Dynamic Economic Modelling Integrating orebody signature, economic cost curves and capital expenditure curves
- 11. Capex Opex Production Rate Construction Time LoM 2 1 3 4 5 2. Development Period & Payback • Scale of operation 1. Capital Investment • Scale of operation • Project delays • Inflation 3. Production build-up • Mine planning & Schedule • Mining grades 5. Steady State Cash Flows • Commodity prices • Rates of production • Mined grades • Recovery factors • Mining costs • Inflation 4. Life of Mine • Ore resource • Ore reserve • Commodity cycle Metal(s) Price Recovered Grade Cash-flow Elements Dynamic modelling allows mines to test these elements in real time
- 12. Single Integrated Economic Model Executives have Line of Sight of Orebody Engineering well in advance of costly feasibility studies Benefits of Live Integrated Modelling • Executives have real time line of sight on assumptions applied and impact analysis • Multiple scenarios can be quickly generated • Orebody dictates optimal economic footprint • Optimal capital allocation • Focal point for executives and technicians to maximize value 12Real Mining Economics
- 13. Maximizing Cash-flow Grade Tonnage Curve Optimiser 13Real Mining Economics Tonnes C/O Grade Avg Grade C/O Grade Dollars Traditional Approach Optimized Approach Traditional Approach Cash Flow not Maximized Old paradigm (Volume focus) versus new paradigm (Value focus)
- 14. Maximizing Cash-flow Traditional Approach - Long Life, lowest possible cut-off to pass investment hurdles 14Real Mining Economics Tonnes C/O Grade Avg Grade Traditional Approach Optimized Approach Marginal economics Volume Maximization Value Maximization Volume maximization - 99% of Metal Extraction - 85% of Ore Extraction - Time value of money risk Value maximization - 65% of Metal Extraction prioritized - 30% of Ore Extraction prioritized - Remaining ore scheduled after high grade stockpiles processed - Time value of money maximized, risk minimized - Full exploitation still possible Value Maximization does not exclude full exploitation of a Mineral Resource, it is just smart business for all stakeholders Beating Discounting
- 15. Stockpiles Maximum Metal Processed in Shortest Time Ore Stockpile Metal Stockpile 15Real Mining Economics New paradigm • Maximize metal extraction in shortest possible time • Maximize cashflow • Avoid detrimental effects of compounding discounting factor • Process lower grade stockpiled ores at tail end of operations • Keep optionality open and war chest cash positive for commodity down turns
- 16. Determining the Optimal Rate of Production Minimizing Costs Cost Profiles Unit Cost Profiles 16Real Mining Economics TVC TFC MC AR USD Production Rate Production Rate USD/t Break even Shut down TAC Fixed Costs RevenueVariable Costs • Increased development • Increased Overtime • Higher Bonuses • Increased Consumables Consumption • Increased Power Consumption • Increased Logistic Costs • Increased Storage Costs • Increased Transport Costs • etc.
- 17. Determining the Optimal Rate of Production Real World Modelling 17Real Mining Economics
- 18. Capital Expenditure Prudent Allocation of Capital Investment – Right Economic Size Optimal Investment Quantum 18Real Mining Economics
- 19. Cash Maximising Paradigm Results • Optimal Cut-off Grade • Maximum Long life of mine to Maximise Cash • Optimal Mining Footprint • Optimal Capital Allocation • Optimal Lead Time to Production • NPV Maximised Risks • NPV discount Risk Minimized • Commodity Price- cycle Managed • Uncertainties Across Entire Value Proposition Reduced • Cash-flows Maximised 19Real Mining Economics
- 20. Modelling Operations Real World Econometric Modelling 20Real Mining Economics y = 0.000000017612x2 - 0.003765194208x + 251.725828733775 0 50 100 150 200 250 300 350 0 20000 40000 60000 80000 100000 120000 140000 160000 USD/Tonnes Tonnes Processed Unit Cost Data Plots 2 year data set Mining Unit Costs - normalized
- 21. Modelling Operations Real World Foxed and Variable Cost Curves 21Real Mining Economics - 10 20 30 40 50 0 20,000 40,000 60,000 80,000 100,000 120,000 140,000 160,000 180,000 200,000 220,000 240,000 260,000 280,000 300,000 USDMillions Production Rates Revenue and Total Costs Short Run Costs Total Revenue Fixed
- 22. Modelling Operations Real World Unit Cost Curves 22Real Mining Economics - 100 200 300 400 500 600 700 800 900 1,000 0 20,000 40,000 60,000 80,000 100,000 120,000 140,000 160,000 180,000 200,000 USD/TonneProcessed Production Rates Generate Best Fit Curve Short Run Average Cost Curve Marginal Costs TVC MC TFC Diseconomies of Scale Economies of Scale
- 23. Modelling Operations Determination of Operational Battery Limits 23Real Mining Economics 0 5,000 10,000 15,000 20,000 25,000 30,000 35,000 40,000 45,000 50,000 - 100 200 300 400 500 600 700 800 900 1,000 0 50,000 100,000 150,000 200,000 250,000 300,000 Thousands USD/TonneProcessed Production Rates Generate Best Fit Curve Short Run Average Cost Curve vs Profitability Marginal Costs MC Annual Profit LoM Profit Diseconomies of ScaleEconomies of Scale
- 24. Thank you 24Real Mining Economics