
Recommended
More Related Content
What's hot
What's hot (19)
Similar to Indian economy grows 7.7% in Q4 FY18
Similar to Indian economy grows 7.7% in Q4 FY18 (20)
Recently uploaded
Recently uploaded (20)
Indian economy grows 7.7% in Q4 FY18
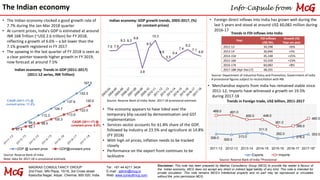
- 1. Disclaimer: This note has been prepared by Madras Consultancy Group (MCG) to provide the reader a flavour of the Indian economy. MCG does not accept any direct or indirect legal liability of any kind. This note is intended for private circulation. This note remains MCG’s intellectual property and no part may be reproduced or circulated without the prior permission MCG. The Indian economy • The Indian economy clocked a good growth rate of 7.7% during the Jan-Mar 2018 quarter • At current prices, India’s GDP is estimated at around INR 168 Trillion (~US$ 2.6 trillion) for FY 2018, reflecting a growth of 6.6% – a bit lower than the 7.1% growth registered in FY 2017 • The upswing in the last quarter of FY 2018 is seen as a clear pointer towards higher growth in FY 2019, now forecast at around 7.5% MADRAS CONSULTANCY GROUP 2nd Floor, MN Plaza, 15/16, 3rd Cross street Kasturba Nagar, Adyar, Chennai, 600 020, India Tel : +91 44 4211 3434 E-mail : admin@mcg.in Web: www.consultmcg.com Source: Reserve Bank of India Note: data for 2017-18 is provisional estimate Source: Reserve Bank of India; Note: 2017-18 provisional estimate Info-Capsule from Indian economy: Trends in GDP (2011-2017) (2011-12 series, INR Trillion) Indian economy: GDP growth trends, 2003-2017, (%) (at constant prices) Year FDI inflows US$ Mn. Growth (%) Year-on-year 2012-13 34,298 -26% 2013-14 36,046 +5% 2014-15# 45,148 +25% 2015-16# 55,559 +23% 2016-17# 60,082 +8% 2017-18# (Apr-Dec17) 48,201 Trends in FDI inflows into India Source: Department of industrial Policy and Promotion, Government of India # provisional figures subject to reconciliation with RBI • Foreign direct inflows into India has grown well during the last 5 years and stood at around US$ 60,082 million during 2016-17 306.0 300.0 313.0 311.0 262.0 276.0 303.0 489.0 491.0 450.0 448.0 381.0 385.0 460.0 2011-12 2012-13 2013-14 2014-15 2015-16 2016-17 2017-18* Exports Imports Trends in Foreign trade, US$ billion, 2011-2017 Source: Reserve Bank of India *Provisional • Merchandise exports from India has remained stable since 2011-12; Imports have witnessed a growth on 19.5% during 2017-18 • The economy appears to have tided over the temporary blip caused by demonetisation and GST implementation • Services sector accounts for 61.8% share of the GDP, followed by industry at 23.5% and agriculture at 14.8% (FY 2018) • With high oil prices, inflation needs to be tracked closely • Performance on the export front continues to be lacklustre 7.9 7.9 9.3 9.3 9.8 3.9 8.5 10.3 6.6 5.5 6.4 7.4 8.2 7.1 6.6 CAGR (2011-17) @ current price: 11.5% CAGR (2011-17) @ constant price: 6.9% 87.4 99.4 112.3 124.7 137.6 152.5 167.5 92.1 98.0 105.3 113.9 122.0 130.0 GDP @ current price GDP@constant price