SlideShare a Scribd company logo
1 of 8
Download to read offline
State of the States
April 2015 State & territory economic performance report.
Executive Summary
NSW TOPS THE RANKINGS
How are Australia’s states and territories performing? Each
quarter CommSec attempts to find out by analysing eight key
indicators: economic growth; retail spending; equipment
investment; unemployment; construction work done;
population growth; housing finance and dwelling
commencements.
Just as the Reserve Bank uses long-term averages to
determine the level of ‘normal’ interest rates; we have done
the same with key economic indicators. For each state and
territory, latest readings for the key indicators were compared
with decade averages – that is, against the ‘normal’
performance.
Last quarter NSW shared the top spot of Australia’s
economic performance rankings alongside the Northern
Territory. However this time around NSW has edged
ahead to take sole ownership of the top ranking.
In second place is the Northern Territory. The next
grouping is Western Australia and Victoria.
Queensland holds on to fifth spot. The ACT and South
Australia are closely grouped in sixth and seventh
respectively. Tasmania is ranked eighth.
Over the past quarter, NSW has improved its position on
housing finance and dwelling starts to consolidate its
position at the top of the economic performance rankings.
3
2
7
4
8
5
1
+
-
Unemployment
Housing finance
The Northern Territory is pushed
back into second spot in the rankings
of best performing economies.
NT
+
-
Queensland is the fifth strongest
economy but lags on unemployment
and population growth.
QLD
Unemployment
Business investment
+
-
NSW retains the top spot of the best
performing economies. Home
building is strong.
NSW
Construction work
Retail spending
+
-
The ACT economy is the sixth best
performing economy, supported by
housing finance but constrained by
weak business investment.
ACT
Equipment spending
Housing finance
6
+
-
Tasmania remains at the bottom of
the economic performance table.
TAS
Various
Unemployment
+
-
Victoria is the fourth strongest
economy, and is ranked first on
housing finance and second on
population growth.
VIC
Equipment spending
Home lending
+
-
South Australia is the seventh
strongest economy but is third
ranked on population growth and
business investment.
SA
Dwelling Starts
Population growth
+
-
Western Australia has held its position
of third best performing economy in
the nation, supported by home
building.
WA
Unemployment
Retail trade
State of the States April 2015
2
NSW has retained its top ranking on population growth
and retail trade and is also now number one on dwelling
starts. It is second placed on business investment, and
housing finance. NSW is fourth on overall construction
work, unemployment and fifth on economic growth.
The Northern Territory has drifted to second place, giving
up the mantle of best-performing economy. The NT is top
on four indicators including the job market, and third on
retail trade. But NT is seventh on population growth and
eighth on housing finance. Huge gas projects are driving
the NT economy.
Western Australia is second-strongest on four indicators –
economic growth, retail trade, construction work and
dwelling starts. The state has slipped to fourth on housing
finance and is now fifth on equipment investment. Being
ranked last on unemployment was the biggest drag.
Victoria is still the fourth-ranked economy but is closing
fast on Western Australia. Victoria is best on housing
finance and second ranked on population growth. But
Victoria is sixth ranked on both economic growth and
equipment investment.
Queensland retains fifth position. Queensland does best
on overall construction work done. But Queensland is
seventh ranked on unemployment and sixth ranked on
population growth.
The ACT economy is the sixth ranked on economic
performance. The territory ranks third on housing finance
and economic growth but seventh ranked on equipment
investment, dwelling starts, and construction work.
South Australia holds seventh spot on the economic
performance rankings. South Australia has improved its
position on retail trade, equipment investment, and
construction work. But it is eighth ranked on dwelling
starts.
Tasmania remains at the bottom of the Australian
economic performance table. But it is now ranked second
on unemployment. The Tasmanian jobless rate is now
holding at 39-month low of 6.5 per cent. In addition
dwelling starts are up 50 per cent on a year ago – the
fastest growth rate in 12 years.
Methodology
Each of the states and territory economies were assessed on eight key indicators:
economic growth; retail spending; equipment investment; unemployment,
construction work done; population growth; housing finance and dwelling
commencements.
The aim was to find how each economy was performing compared with “normal”.
And just like the Reserve Bank does with interest rates, we used decade-averages
to judge the “normal” state of affairs. For each economy, the latest level of the
indicator – such as retail spending or economic growth – was compared with the
decade average.
While we also looked at the current pace of growth to look at economic momentum,
it may yield perverse results to judge performance. For instance retail spending may
be up sharply on a year ago but from depressed levels. Overall spending may still
be well below “normal”. And clearly some states such as Queensland and Western
Australia consistently have faster economic growth rates due to historically faster
population growth. So the best way to assess economic performance is to look at
each indicator in relation to what would be considered ‘normal’ for that state or
territory.
For instance, the trend jobless rate in the ACT of 4.4 per cent is second lowest of all
economies. But this jobless rate is actually up 26.2 per cent on its ‘normal’ or
decade-average rate of 3.5 per cent, ranking it sixth on this indicator – that is, it is
doing relatively poorly compared with other states & territories.
Trend measures of the economic indicators were used to assess performance rather
than more volatile seasonally adjusted or original estimates.
ECONOMIC GROWTH
Ideally gross state product (GSP) would be used to
assess broad economic growth. But the data isn’t
available quarterly. Rather, state final demand (household
and business spending) is added to exports less imports
to act as a proxy for GSP. Exclusion of the trade sector
would provide an incorrect assessment of growth for
economies such as Western Australia and Queensland.
The Northern Territory continues to lead the rankings on
economic activity. Activity in the ‘top end’ is just under 45
per cent above its ‘normal’ or decade-average level of
output.
Next strongest is Western Australia, with output around
26 per cent higher than the decade average level of
output. Then follows ACT (up 15.2 per cent) from
Queensland (up 10.9 per cent).
At the other end of the scale, economic activity in
Tasmania in the December quarter was just 0.8 per cent
above its decade average, while South Australian activity
was up just under 9 per cent on its ‘normal’ or average
output over the past decade.
Northern Territory also has the fastest annual economic
growth rate in the nation, up by 3.2 per cent on a year ago,
ahead of Western Australia with 3.1 per cent and NSW
(2.7 per cent).
By contrast, the Queensland economy is down 1.1 per
cent on a year ago, while Tasmanian economic activity is
up just 0.3 per cent on a year ago with the South
Australian economy up 1.2 per cent on a year ago.
“Northern Territory also has the fastest
annual economic growth rate in the nation,
up by 3.2 per cent on a year ago, ahead of
Western Australia with 3.1 per cent and
NSW (2.7 per cent).”
State of the States April 2015
3
RETAIL SPENDING
The measure used was real (inflation-adjusted) retail
trade in trend terms with December quarter data the latest
available.
NSW has held onto the top spot on the retail rankings
from Western Australia and Northern Territory with
spending in the December quarter 17.1 per cent above
decade average levels. Solid activity in the housing
sector and higher home prices are supporting
spending.
Western Australia was next strongest, up 16.3 per cent
above decade-average levels. Unemployment remains
below that of other states, while home building is solidly
up on decade averages.
Northern Territory was next strongest, with spending 13.5
per cent above decade averages, followed by Victoria (up
13.0 per cent).
Tasmania now has the weakest result on retail spending,
up just 5.5 per cent on the decade average and below
South Australia with 6.2 per cent growth and the ACT with
9.1 per cent growth.
If monthly retail trade was assessed instead to calculate
the rankings (February data available), the rankings
would be exactly the same, except Queensland would be
ahead of joint 4th
, Northern Territory and Victoria
In terms of annual growth of real retail trade, NSW is
strongest, up 6.3 per cent, from Victoria, up 4.1 per cent,
and Tasmania, up 2.4 per cent. NSW has also the fastest
annual growth in monthly retail trade, up 5.5 per cent over
the year.
“In terms of annual growth of real retail
trade, NSW is strongest, up 6.3 per cent,
from Victoria, up 4.1 per cent, and
Tasmania, up 2.4 per cent.”
EQUIPMENT INVESTMENT
Northern Territory remains well out in front of the other
states and territories when it comes to equipment
investment. Spending in the December quarter was a
massive 67.9 per cent above ‘normal’ – or decade-
average levels.
Up until the September quarter, resource-driven
economies led the way on investment. However NSW
remained in second spot for a second quarter with
equipment spending 10.7 per cent above decade-
averages.
Equipment investment in South Australia was up 6.6 per
cent above decade-average levels, followed by
Queensland (up 2.6 per cent).
By contrast, new equipment spending in Tasmania was
20.1 per cent below its longer-term average in the
December quarter after being down 20.8 per cent on the
‘normal’ level in the September quarter.
Equipment spending is also below decade-average levels
in ACT (-7.4 per cent) and Victoria (-1.9 per cent).
On a shorter-run analysis, equipment investment in the
December quarter was higher than a year ago in six of
the state and territory economies (last quarter, four states
and territories had equipment spending up on a year ago).
Equipment investment is up the most on a year ago in
Northern Territory (up 51.5 per cent), followed by ACT (up
16.7 per cent) and South Australia (up 12.3 per cent).
By contrast new equipment investment in both Western
Australia and Queensland were down 4.9 per cent on a
year ago.
“On a shorter-run analysis, equipment
investment in the December quarter was
higher than a year ago in six of the state
and territory economies.”
State of the States April 2015
4
UNEMPLOYMENT
The Northern Territory has retained the position of
strongest job market in the nation. Not only is
unemployment in the Northern Territory the lowest in the
nation in trend terms (4.3 per cent), but its jobless rate is
only 3.6 per cent below its ‘normal’ or decade average
level of 4.2 per cent.
At the other end of the scale is the Western Australia.
While trend unemployment is the third lowest in the nation
at 5.7 per cent, this is over 35 per cent higher than the 4.2
per cent ‘normal’ or decade-average rate level – the worst
performance in the nation.
The Tasmanian jobless rate has fallen from 8.1 per cent
in August 2013 to a 39-month low of 6.5 per cent in March.
As a result, Tasmania is ranked second on
unemployment with the current jobless rate up almost 7.6
per cent on its “normal” or decade average level of 6.0
per cent.
Across all the states and territories, the latest
unemployment rates are above their decade-average
levels. In Victoria, unemployment stands at 6.1 per cent,
up 13.9 per cent on its decade average of 5.4 per cent.
Similarly in NSW the jobless rate is holding at 6.1 per cent,
but it is 15.4 per cent above its decade average level of
5.3 per cent.
Next best is South Australia where its 6.7 per cent jobless
rate is almost 22 per cent above the decade-average.
The ACT has the second lowest unemployment rate
across the nation at 4.4 per cent but it 26.2 per cent
above its decade average of 3.5 per cent.
Queensland’s 6.5 per cent jobless rate is up 26.5 per cent
on the ‘normal’ level.
“The Tasmanian jobless rate has fallen from
8.1 per cent in August 2013 to a 39-month
low of 6.5 per cent in March.”
CONSTRUCTION WORK
The measure used for analysis was the total amount of
residential, commercial and engineering work actually
completed in seasonally adjusted terms in the December
quarter.
The Bureau of Statistics couldn’t provide a trend estimate
for the Northern Territory. But we assessed both the
seasonally adjusted and other trend results and it is clear
that the rankings are the same while growth rates were
very close between both estimates.
In six states and territories, construction work is higher
than decade averages. And there still remains a large gap
between the strongest states (the resource states) and
weakest state (Tasmania).
Construction work done in the Northern Territory was
almost 171 per cent above its decade average, ahead of
Western Australia (up 33.4 per cent) while Queensland
construction was up 10.7 per cent on ‘normal’ levels.
In Tasmania, overall new construction work completed is
now 4.7 per cent below the decade average after being
up 0.3 per cent on its decade average in the September
quarter.
Next weakest to Tasmania is ACT where construction
work is just 0.2 per cent below decade averages, followed
by South Australia (up 3.3 per cent).
NSW is fourth ranked with construction work 10 per cent
above decade averages. Victoria is fifth ranked with
construction work almost 8 per cent above ‘normal’ levels.
In terms of annual growth rates, Northern Territory
construction work done in the December quarter was up
113 per cent on a year ago, followed by Tasmania, up 7
per cent, and Victoria, up 4 per cent.
“In terms of annual growth rates, Northern
Territory construction work done in the
December quarter was up 113 per cent on a
year ago, followed by Tasmania, up 7 per
cent, and Victoria, up 4 per cent.”
State of the States April 2015
5
POPULATION GROWTH
To assess population performance we looked at the
current annual growth rate and compared it with each
economy’s decade-average (‘normal’) growth pace.
It is clear that population growth is not providing the same
boost to economic activity that it provided in recent years.
In fact population growth is only above ‘normal’ or the
decade-average in two states and annual growth has
eased in all except Northern Territory in the past quarter.
While NSW has only the fourth fastest annual growth rate
at 1.43 per cent, this is 17 per cent above the decade
average (last quarter was 22.8 per cent above ‘normal’.)
Victoria is second strongest in annual population growth
as well as the differential with the decade-average rate.
Victoria’s population is 1.77 per cent higher than a year
ago and this growth rate is 3.8 per cent higher than the
‘normal’ or decade-average level.
Western Australia is the clear leader in population growth
with an annual growth rate of 2.12 per cent – but the
slowest in more than eight years. And population growth
is 20.3 per cent below decade-average levels.
At the other end of the leader-board is Tasmania where
the annual population growth of 0.31 per cent was 51.2
per cent below the decade average rate of 0.64 per cent
but annual growth was just below the strongest rate in 2½
years. Next lowest was Northern Territory with population
growth of 1.14 per cent, down 40.9 per cent on the
decade average.
“Western Australia is the clear leader in
population growth with an annual growth
rate of 2.12 per cent – but the slowest in
more than eight years. And population
growth is 20.3 per cent below decade-
average levels.”
HOUSING FINANCE
The measure used was the trend number of housing
finance commitments and this was compared with the
decade-average for each respective state and territory.
Housing finance is not just a leading indicator for real
estate activity and housing construction but also is a
useful indicator of activity in the financial sector. It would
be useful to compare figures on commercial, personal
and lease finance, but unfortunately trend data is not
available for states and territories.
In four of the states and territories – Victoria, NSW, ACT,
and Western Australia – trend housing finance
commitments are above decade averages. And in four of
the eight economies, trend commitments in February
were above year-ago levels.
Victoria has now taken top spot for housing finance, with
the number of commitments 11.5 per cent above the
long-term average. Next strongest was NSW, up 10.4 per
cent on the decade-average.
The ACT has slipped from first to third spot on housing
finance, up 8.4 per cent on the decade average, followed
by Western Australia (up 5.5 per cent).
Northern Territory is now the weakest for housing finance
with trend commitments 23 per cent lower than its decade
average. Next weakest was South Australia with trend
commitments down 13.7 per cent on the decade average.
In Tasmania, home loan commitments are 10.8 per cent
below decade averages. But encouragingly commitments
are growing – up 0.7 per cent on a year ago.
“Victoria has now taken top spot for housing
finance, with the number of commitments
11.5 per cent above the long-term average.”
State of the States April 2015
6
DWELLING STARTS
The measure used was the trend number of dwelling
commencements (starts) with the comparison made to
the decade-average level of starts. Starts are driven in
part by population growth and housing finance and can
affect retail trade, unemployment and overall economic
growth. However any over-building or under-building in
previous years can affect the current level of starts.
The outlook for housing construction remains positive
with interest rates low and the job market improving.
Dwelling starts are above decade averages in seven of
the states and territories and starts are above levels of a
year ago in all but the ACT.
NSW has taken the mantle of the strongest in the nation
for new home construction, with starts almost 49 per cent
above decade averages. In addition in the December
quarter the number of dwellings started was 9.3 per cent
higher than a year earlier.
In second spot was Western Australia, with starts 43.1
per cent above decade averages, followed by Northern
Territory with starts up 39 per cent on decade averages
and Victoria, up 22.9 per cent.
At the other end of the scale, South Australian dwelling
starts were 0.3 per cent below decade averages. And
even in the December quarter starts were only 0.1 per
cent higher than a year earlier. Next weakest was the
ACT (up 0.6 per cent on the decade average), and
Tasmania (up 0.8 per cent). On a positive note
Tasmanian dwelling starts were up 50 per cent in the
December quarter compared with a year ago – the
strongest growth in 12 years.
“NSW has taken the mantle of the strongest
in the nation for new home construction,
with starts almost 49 per cent above decade
averages”
OTHER INDICATORS
In the June quarter, real wages were positive in just one
of the eight state and territory economies and flat in
another. In the September quarter, real wages were
positive in five of the states and territories. And in the
December quarter all states and territories recorded real
wage growth.
Strongest real wage growth was recorded in both in
Victoria and Tasmania with wages 1.4 percentage points
(pp) higher than consumer prices. Real wage growth was
also solid in both South Australia and Northern Territory
at 0.9pp.
In Western Australia wage growth of 2.3 per cent was
only modestly above the 2.0 per cent annual growth of
prices. Real wages were only modestly positive in the
ACT (+0.5pp).
Turning to home prices, in March only five of the capital
cities had positive annual growth of home prices. Back in
December it was only the ACT that had home prices
lower than a year earlier.
Strongest growth in home prices was in Sydney (up 13.9
per cent) and then there was a fair gap to Melbourne (up
5.6 per cent) and then another fair gap to the other capital
cities.
Next strongest was Brisbane with home prices up 2.7 per
cent on a year ago, followed by Adelaide (up 2.2 per cent)
and Canberra (up 1.5 per cent).
Home prices were lower than a year ago in Darwin (-0.8
per cent), Tasmania (-0.3 per cent) and Western Australia
(-0.1 per cent).
Across Australia there continues to be evidence that
annual growth of home prices has eased. Nationally
home prices were up by 7.4 per cent on a year ago – the
slowest growth in 18 months.
“Home prices were lower than a year ago in
Darwin (-0.8 per cent), Tasmania (-0.3 per
cent) and Western Australia (-0.1 per cent).”
State of the States April 2015
7
STATE BY STATE BREAKDOWN
NSW
NSW has improved its position on housing finance
and dwelling starts to consolidate its position at the
top of the economic performance rankings.
Northern Territory
The NT is top on four indicators including the job
market, but it’s seventh on population growth and
eighth on housing finance.
Western Australia
Western Australia is second-strongest on four
indicators – economic growth, retail trade, dwelling
starts and construction work.
Victoria
Victoria is best on housing finance and population
(second ranked).”
Queensland
Queensland does best on construction work and
business investment.
South Australia
South Australia is third ranked on population growth
and business investment but seventh ranked on
economic growth, retail trade, housing finance.”
ACT
The ACT held its position on economic growth (third
ranked) but drifted lower on housing finance, dwelling
starts and business investment.
Tasmania
“…the trend jobless rate is at a 39-month low
…dwelling starts are up 50 per cent on a year ago –
the fastest growth rate in 12 years.”
IMPLICATIONS AND OUTLOOK
In the October 2014 report, Western Australia was
passed by NSW for the top spot. And in the January 2015
report, Western Australia had slipped to third, behind
NSW and Northern Territory. In the latest report NSW
improved its position, pushing Northern Territory into
second place on the performance rankings.
There will always be a changing of the guard in terms of
economic performance as relative economic growth
drivers variably strengthen or fade. The end of the mining
construction boom should lead to more balanced growth
in Western Australia.
NSW is on top because population has been growing in
recent years and now home construction is responding to
the shortage of accommodation. NSW looks to be well
supported by home construction and infrastructure
spending over 2015.
The Northern Territory is in second spot. While the NT
economy is top-ranked on four of the eight economic
indicators, it lags on population growth, thus affecting
home building activity. Attracting labour to the ‘top end’
remains a constraint on growth.
In Victoria, strong population growth is supporting home
building activity and in turn employment. It is now
showing signs of closing the gap on Western Australia in
the economic performance ladder.
In Queensland, overall construction work and equipment
spending are supporting economic activity. But the soft
job market and relative under-performance on population
growth are constraining growth in home building.
In South Australia, annual population growth is higher
than a year ago and unemployment is middle-ranked. But
the state underperforms on retail spending and home
building and buying.
The ACT is third ranked on housing finance but is sixth
ranked on unemployment. As a result the ACT economy
lacks momentum.
There are brighter signs in Tasmania with the trend
jobless rate at 39-month lows. Further, dwelling starts are
up 50 per cent on a year ago – the fastest growth rate in
12 years.
-0.1%
-0.8%
2.2%
2.7%
13.9%
5.6%
1.5%
-0.3%
Home price index
State of the States
8
Terms and conditions
Produced by Commonwealth Research based on information available at the time of
publishing. We believe that the information in this report is correct and any opinions,
conclusions or recommendations are reasonably held or made as at the time of its
compilation, but no warranty is made as to accuracy, reliability or completeness. To
the extent permitted by law, neither Commonwealth Bank of Australia ABN 48 123
123 124 nor any of its subsidiaries accept liability to any person for loss or damage
arising from the use of this report.
The report has been prepared without taking account of the objectives, financial
situation or needs of any particular individual. For this reason, any individual should,
before acting on the information in this report, consider the appropriateness of the
information, having regard to the individual’s objectives, financial situation and
needs and, if necessary, seek appropriate professional advice. In the case of certain
securities Commonwealth Bank of Australia is or may be the only market maker.
This report is approved and distributed in Australia by Commonwealth Securities
Limited ABN 60 067 254 399 a wholly owned but not guaranteed subsidiary of
Commonwealth Bank of Australia.
This report is approved and distributed in the UK by Commonwealth Bank of
Australia incorporated in Australia with limited liability. Registered in England No.
BR250 and regulated in the UK by the Financial Conduct Authority (FCA). This
report does not purport to be a complete statement or summary. For the purpose of
the FCA rules, this report and related services are not intended for private
customers and are not available to them.
Commonwealth Bank of Australia and its subsidiaries have effected or may effect
transactions for their own account in any investments or related investments referred
to in this report.
CONTACTS
Craig James
Chief Economist
Twitter: @CommSec
Savanth Sebastian
Economist
Twitter: @CommSec

More Related Content

What's hot

The Latvian Economy, No 4, 20 May 2011
The Latvian Economy, No 4, 20 May 2011The Latvian Economy, No 4, 20 May 2011
The Latvian Economy, No 4, 20 May 2011Swedbank
 
Getting Rntervention Rights Rodrik Korean Economic Development
Getting Rntervention Rights Rodrik Korean Economic DevelopmentGetting Rntervention Rights Rodrik Korean Economic Development
Getting Rntervention Rights Rodrik Korean Economic DevelopmentSievleang Ly
 
ESCAP Survey 2015 Presentation
ESCAP Survey 2015 PresentationESCAP Survey 2015 Presentation
ESCAP Survey 2015 PresentationUNDP Policy Centre
 
DEMOGRAPHIC PROFILE OF CONTINENTAL ODISHA
DEMOGRAPHIC PROFILE OF CONTINENTAL ODISHADEMOGRAPHIC PROFILE OF CONTINENTAL ODISHA
DEMOGRAPHIC PROFILE OF CONTINENTAL ODISHAKamlesh Kumar
 
Migration Profile of Odisha with focus on Bhubaneswar
Migration Profile of Odisha with focus on BhubaneswarMigration Profile of Odisha with focus on Bhubaneswar
Migration Profile of Odisha with focus on BhubaneswarKamlesh Kumar
 
The new government in Peru: Perspectives of its economic and foreign policy
The new government in Peru: Perspectives of its economic and foreign policyThe new government in Peru: Perspectives of its economic and foreign policy
The new government in Peru: Perspectives of its economic and foreign policyCarlos Alberto Aquino Rodriguez
 
Q4 2014 Global Talent Market Quarterly
Q4 2014 Global Talent Market QuarterlyQ4 2014 Global Talent Market Quarterly
Q4 2014 Global Talent Market QuarterlyKelly Services
 
5.akinbobola temidayo 46-60
5.akinbobola temidayo 46-605.akinbobola temidayo 46-60
5.akinbobola temidayo 46-60Alexander Decker
 
Union budget 2017 speech by FM
Union budget 2017 speech by FMUnion budget 2017 speech by FM
Union budget 2017 speech by FMZaheen Ahmed
 
A guide to inclusive prosperity
A guide to inclusive prosperityA guide to inclusive prosperity
A guide to inclusive prosperitydanielstone29
 
The State of Households 2018 - Different Realities (Presentation Slides)
The State of Households 2018 - Different Realities (Presentation Slides)The State of Households 2018 - Different Realities (Presentation Slides)
The State of Households 2018 - Different Realities (Presentation Slides)KhazanahResearchInstitute
 
Statistical case study on uttar pradesh & uttarakhand ppt
Statistical case study on uttar pradesh & uttarakhand pptStatistical case study on uttar pradesh & uttarakhand ppt
Statistical case study on uttar pradesh & uttarakhand pptPranay chowdary Vunnam
 
Pakistan economy and debts on pakistan
Pakistan economy and debts on pakistanPakistan economy and debts on pakistan
Pakistan economy and debts on pakistanshahidbangash258
 
Ipsos Consumer Confidence Index: UK economic confidence returns to pre-crash ...
Ipsos Consumer Confidence Index: UK economic confidence returns to pre-crash ...Ipsos Consumer Confidence Index: UK economic confidence returns to pre-crash ...
Ipsos Consumer Confidence Index: UK economic confidence returns to pre-crash ...Ipsos UK
 
Manifesto of pml n (features, loopholes and recommendations)
Manifesto of pml n (features, loopholes and recommendations)Manifesto of pml n (features, loopholes and recommendations)
Manifesto of pml n (features, loopholes and recommendations)qadrianum
 

What's hot (19)

The Latvian Economy, No 4, 20 May 2011
The Latvian Economy, No 4, 20 May 2011The Latvian Economy, No 4, 20 May 2011
The Latvian Economy, No 4, 20 May 2011
 
Getting Rntervention Rights Rodrik Korean Economic Development
Getting Rntervention Rights Rodrik Korean Economic DevelopmentGetting Rntervention Rights Rodrik Korean Economic Development
Getting Rntervention Rights Rodrik Korean Economic Development
 
Pakistan: Building the economy of tomorrow
Pakistan: Building the economy of tomorrowPakistan: Building the economy of tomorrow
Pakistan: Building the economy of tomorrow
 
ESCAP Survey 2015 Presentation
ESCAP Survey 2015 PresentationESCAP Survey 2015 Presentation
ESCAP Survey 2015 Presentation
 
DEMOGRAPHIC PROFILE OF CONTINENTAL ODISHA
DEMOGRAPHIC PROFILE OF CONTINENTAL ODISHADEMOGRAPHIC PROFILE OF CONTINENTAL ODISHA
DEMOGRAPHIC PROFILE OF CONTINENTAL ODISHA
 
Migration Profile of Odisha with focus on Bhubaneswar
Migration Profile of Odisha with focus on BhubaneswarMigration Profile of Odisha with focus on Bhubaneswar
Migration Profile of Odisha with focus on Bhubaneswar
 
The new government in Peru: Perspectives of its economic and foreign policy
The new government in Peru: Perspectives of its economic and foreign policyThe new government in Peru: Perspectives of its economic and foreign policy
The new government in Peru: Perspectives of its economic and foreign policy
 
The new government in Peru: Perspectives of its economic and foreign policy
The new government in Peru: Perspectives of its economic and foreign policyThe new government in Peru: Perspectives of its economic and foreign policy
The new government in Peru: Perspectives of its economic and foreign policy
 
Q4 2014 Global Talent Market Quarterly
Q4 2014 Global Talent Market QuarterlyQ4 2014 Global Talent Market Quarterly
Q4 2014 Global Talent Market Quarterly
 
5.akinbobola temidayo 46-60
5.akinbobola temidayo 46-605.akinbobola temidayo 46-60
5.akinbobola temidayo 46-60
 
Quarterly Labour Force Survey - Q1:2017
Quarterly Labour Force Survey - Q1:2017Quarterly Labour Force Survey - Q1:2017
Quarterly Labour Force Survey - Q1:2017
 
Union budget 2017 speech by FM
Union budget 2017 speech by FMUnion budget 2017 speech by FM
Union budget 2017 speech by FM
 
A guide to inclusive prosperity
A guide to inclusive prosperityA guide to inclusive prosperity
A guide to inclusive prosperity
 
The State of Households 2018 - Different Realities (Presentation Slides)
The State of Households 2018 - Different Realities (Presentation Slides)The State of Households 2018 - Different Realities (Presentation Slides)
The State of Households 2018 - Different Realities (Presentation Slides)
 
Statistical case study on uttar pradesh & uttarakhand ppt
Statistical case study on uttar pradesh & uttarakhand pptStatistical case study on uttar pradesh & uttarakhand ppt
Statistical case study on uttar pradesh & uttarakhand ppt
 
Pakistan economy and debts on pakistan
Pakistan economy and debts on pakistanPakistan economy and debts on pakistan
Pakistan economy and debts on pakistan
 
Ipsos Consumer Confidence Index: UK economic confidence returns to pre-crash ...
Ipsos Consumer Confidence Index: UK economic confidence returns to pre-crash ...Ipsos Consumer Confidence Index: UK economic confidence returns to pre-crash ...
Ipsos Consumer Confidence Index: UK economic confidence returns to pre-crash ...
 
Manifesto of pml n (features, loopholes and recommendations)
Manifesto of pml n (features, loopholes and recommendations)Manifesto of pml n (features, loopholes and recommendations)
Manifesto of pml n (features, loopholes and recommendations)
 
The myth of high income nation
The myth of high income nationThe myth of high income nation
The myth of high income nation
 

Viewers also liked

Bab2 mobile apllication
Bab2 mobile apllicationBab2 mobile apllication
Bab2 mobile apllicationDony Ardi
 
CommSec's State of the States - May 2016
CommSec's State of the States - May 2016CommSec's State of the States - May 2016
CommSec's State of the States - May 2016CommSec
 
Competing on analytics
Competing on analyticsCompeting on analytics
Competing on analyticsj_morales
 
Tobacco Consumption between 18-24 (2005)
Tobacco Consumption between 18-24 (2005)Tobacco Consumption between 18-24 (2005)
Tobacco Consumption between 18-24 (2005)Elizabeth E. Brait
 
CommSec August 2015 Reporting Season - Full Results
CommSec August 2015 Reporting Season - Full ResultsCommSec August 2015 Reporting Season - Full Results
CommSec August 2015 Reporting Season - Full ResultsCommSec
 
Cardiff ifp japanese entry requirements ak
Cardiff ifp   japanese entry requirements akCardiff ifp   japanese entry requirements ak
Cardiff ifp japanese entry requirements akAlys Kowalik
 
International Use of Smokeless Tobacco and Other Tobacco Products (2006)
International Use of Smokeless Tobacco and Other Tobacco Products (2006)International Use of Smokeless Tobacco and Other Tobacco Products (2006)
International Use of Smokeless Tobacco and Other Tobacco Products (2006)Elizabeth E. Brait
 
CommSec Reporting Season Wrap Up - August 2015 (Infographic)
CommSec Reporting Season Wrap Up - August 2015 (Infographic)CommSec Reporting Season Wrap Up - August 2015 (Infographic)
CommSec Reporting Season Wrap Up - August 2015 (Infographic)CommSec
 
HCAHPS Cornerstones of Care
HCAHPS Cornerstones of CareHCAHPS Cornerstones of Care
HCAHPS Cornerstones of CareStarlingHealth
 
Zombie apocalypse powerpoint
Zombie apocalypse powerpointZombie apocalypse powerpoint
Zombie apocalypse powerpointAlys Kowalik
 

Viewers also liked (13)

AUG11_PW-Final
AUG11_PW-FinalAUG11_PW-Final
AUG11_PW-Final
 
Bab2 mobile apllication
Bab2 mobile apllicationBab2 mobile apllication
Bab2 mobile apllication
 
CommSec's State of the States - May 2016
CommSec's State of the States - May 2016CommSec's State of the States - May 2016
CommSec's State of the States - May 2016
 
Zombie apocalypse
Zombie apocalypseZombie apocalypse
Zombie apocalypse
 
Competing on analytics
Competing on analyticsCompeting on analytics
Competing on analytics
 
Rico de coro
Rico de coroRico de coro
Rico de coro
 
Tobacco Consumption between 18-24 (2005)
Tobacco Consumption between 18-24 (2005)Tobacco Consumption between 18-24 (2005)
Tobacco Consumption between 18-24 (2005)
 
CommSec August 2015 Reporting Season - Full Results
CommSec August 2015 Reporting Season - Full ResultsCommSec August 2015 Reporting Season - Full Results
CommSec August 2015 Reporting Season - Full Results
 
Cardiff ifp japanese entry requirements ak
Cardiff ifp   japanese entry requirements akCardiff ifp   japanese entry requirements ak
Cardiff ifp japanese entry requirements ak
 
International Use of Smokeless Tobacco and Other Tobacco Products (2006)
International Use of Smokeless Tobacco and Other Tobacco Products (2006)International Use of Smokeless Tobacco and Other Tobacco Products (2006)
International Use of Smokeless Tobacco and Other Tobacco Products (2006)
 
CommSec Reporting Season Wrap Up - August 2015 (Infographic)
CommSec Reporting Season Wrap Up - August 2015 (Infographic)CommSec Reporting Season Wrap Up - August 2015 (Infographic)
CommSec Reporting Season Wrap Up - August 2015 (Infographic)
 
HCAHPS Cornerstones of Care
HCAHPS Cornerstones of CareHCAHPS Cornerstones of Care
HCAHPS Cornerstones of Care
 
Zombie apocalypse powerpoint
Zombie apocalypse powerpointZombie apocalypse powerpoint
Zombie apocalypse powerpoint
 

Similar to CommSec State of the States - April 2015

Economics movie location
Economics movie locationEconomics movie location
Economics movie locationAliDavid1998
 
Tasmania Magazine FINAL (web)
Tasmania Magazine FINAL (web)Tasmania Magazine FINAL (web)
Tasmania Magazine FINAL (web)Kevin Leong
 
Economic and government policies for Australia - june 2016
Economic and government policies for  Australia - june 2016Economic and government policies for  Australia - june 2016
Economic and government policies for Australia - june 2016paul young cpa, cga
 
Pop Growth Highlights Trends Qld 2009
Pop Growth Highlights Trends Qld 2009Pop Growth Highlights Trends Qld 2009
Pop Growth Highlights Trends Qld 2009chrislaval
 
Australian Housing Affordability Report
Australian Housing Affordability Report Australian Housing Affordability Report
Australian Housing Affordability Report John Sexton
 
Monthly update november 2010
Monthly update november 2010Monthly update november 2010
Monthly update november 2010Martin Leduc
 
Economics Analysis of Australia & Saudi Arabia of last 20 years, since 1991
Economics Analysis of Australia & Saudi Arabia of last 20 years, since 1991Economics Analysis of Australia & Saudi Arabia of last 20 years, since 1991
Economics Analysis of Australia & Saudi Arabia of last 20 years, since 1991rehan012
 
Economic Development and Corporate Intelligence: How Information Fuels Growth
Economic Development and Corporate Intelligence: How Information Fuels GrowthEconomic Development and Corporate Intelligence: How Information Fuels Growth
Economic Development and Corporate Intelligence: How Information Fuels GrowthCorporate Affiliations
 
Country risk analysis of australia
Country risk analysis of australiaCountry risk analysis of australia
Country risk analysis of australiaShounSarker
 
Economic update - April 2016
Economic update - April 2016Economic update - April 2016
Economic update - April 2016Sasanka Liyanage
 

Similar to CommSec State of the States - April 2015 (14)

Economics movie location
Economics movie locationEconomics movie location
Economics movie location
 
2016 MiQ Summer Newsletter
2016 MiQ Summer Newsletter2016 MiQ Summer Newsletter
2016 MiQ Summer Newsletter
 
Tasmania Magazine FINAL (web)
Tasmania Magazine FINAL (web)Tasmania Magazine FINAL (web)
Tasmania Magazine FINAL (web)
 
Economic and government policies for Australia - june 2016
Economic and government policies for  Australia - june 2016Economic and government policies for  Australia - june 2016
Economic and government policies for Australia - june 2016
 
Pop Growth Highlights Trends Qld 2009
Pop Growth Highlights Trends Qld 2009Pop Growth Highlights Trends Qld 2009
Pop Growth Highlights Trends Qld 2009
 
Australian Housing Affordability Report
Australian Housing Affordability Report Australian Housing Affordability Report
Australian Housing Affordability Report
 
Monthly update november 2010
Monthly update november 2010Monthly update november 2010
Monthly update november 2010
 
NEG Economic Monitor
NEG Economic MonitorNEG Economic Monitor
NEG Economic Monitor
 
Economics Analysis of Australia & Saudi Arabia of last 20 years, since 1991
Economics Analysis of Australia & Saudi Arabia of last 20 years, since 1991Economics Analysis of Australia & Saudi Arabia of last 20 years, since 1991
Economics Analysis of Australia & Saudi Arabia of last 20 years, since 1991
 
Economic Development and Corporate Intelligence: How Information Fuels Growth
Economic Development and Corporate Intelligence: How Information Fuels GrowthEconomic Development and Corporate Intelligence: How Information Fuels Growth
Economic Development and Corporate Intelligence: How Information Fuels Growth
 
Directions 2015
Directions 2015Directions 2015
Directions 2015
 
Country risk analysis of australia
Country risk analysis of australiaCountry risk analysis of australia
Country risk analysis of australia
 
Economic update - April 2016
Economic update - April 2016Economic update - April 2016
Economic update - April 2016
 
Australia pest
Australia   pestAustralia   pest
Australia pest
 

More from CommSec

Federal Budget 2016/17 - What it means for you
Federal Budget 2016/17 - What it means for youFederal Budget 2016/17 - What it means for you
Federal Budget 2016/17 - What it means for youCommSec
 
The Big Issues 2003 - 2016
The Big Issues 2003 - 2016The Big Issues 2003 - 2016
The Big Issues 2003 - 2016CommSec
 
Inflation - July Quarter
Inflation - July QuarterInflation - July Quarter
Inflation - July QuarterCommSec
 
2014 / 2015 Year in Review - Economic Perspectives
2014 / 2015 Year in Review - Economic Perspectives2014 / 2015 Year in Review - Economic Perspectives
2014 / 2015 Year in Review - Economic PerspectivesCommSec
 
Federal Budget 2015 / 2016
Federal Budget 2015 / 2016Federal Budget 2015 / 2016
Federal Budget 2015 / 2016CommSec
 
February 2015 Reporting Season Wrap Up
February 2015 Reporting Season Wrap UpFebruary 2015 Reporting Season Wrap Up
February 2015 Reporting Season Wrap UpCommSec
 
2014 In Review - ASX 200 Performance
2014 In Review - ASX 200 Performance2014 In Review - ASX 200 Performance
2014 In Review - ASX 200 PerformanceCommSec
 

More from CommSec (7)

Federal Budget 2016/17 - What it means for you
Federal Budget 2016/17 - What it means for youFederal Budget 2016/17 - What it means for you
Federal Budget 2016/17 - What it means for you
 
The Big Issues 2003 - 2016
The Big Issues 2003 - 2016The Big Issues 2003 - 2016
The Big Issues 2003 - 2016
 
Inflation - July Quarter
Inflation - July QuarterInflation - July Quarter
Inflation - July Quarter
 
2014 / 2015 Year in Review - Economic Perspectives
2014 / 2015 Year in Review - Economic Perspectives2014 / 2015 Year in Review - Economic Perspectives
2014 / 2015 Year in Review - Economic Perspectives
 
Federal Budget 2015 / 2016
Federal Budget 2015 / 2016Federal Budget 2015 / 2016
Federal Budget 2015 / 2016
 
February 2015 Reporting Season Wrap Up
February 2015 Reporting Season Wrap UpFebruary 2015 Reporting Season Wrap Up
February 2015 Reporting Season Wrap Up
 
2014 In Review - ASX 200 Performance
2014 In Review - ASX 200 Performance2014 In Review - ASX 200 Performance
2014 In Review - ASX 200 Performance
 

Recently uploaded

(ANIKA) Budhwar Peth Call Girls Just Call 7001035870 [ Cash on Delivery ] Pun...
(ANIKA) Budhwar Peth Call Girls Just Call 7001035870 [ Cash on Delivery ] Pun...(ANIKA) Budhwar Peth Call Girls Just Call 7001035870 [ Cash on Delivery ] Pun...
(ANIKA) Budhwar Peth Call Girls Just Call 7001035870 [ Cash on Delivery ] Pun...ranjana rawat
 
Solution Manual for Financial Accounting, 11th Edition by Robert Libby, Patri...
Solution Manual for Financial Accounting, 11th Edition by Robert Libby, Patri...Solution Manual for Financial Accounting, 11th Edition by Robert Libby, Patri...
Solution Manual for Financial Accounting, 11th Edition by Robert Libby, Patri...ssifa0344
 
The Economic History of the U.S. Lecture 23.pdf
The Economic History of the U.S. Lecture 23.pdfThe Economic History of the U.S. Lecture 23.pdf
The Economic History of the U.S. Lecture 23.pdfGale Pooley
 
Independent Call Girl Number in Kurla Mumbai📲 Pooja Nehwal 9892124323 💞 Full ...
Independent Call Girl Number in Kurla Mumbai📲 Pooja Nehwal 9892124323 💞 Full ...Independent Call Girl Number in Kurla Mumbai📲 Pooja Nehwal 9892124323 💞 Full ...
Independent Call Girl Number in Kurla Mumbai📲 Pooja Nehwal 9892124323 💞 Full ...Pooja Nehwal
 
The Economic History of the U.S. Lecture 19.pdf
The Economic History of the U.S. Lecture 19.pdfThe Economic History of the U.S. Lecture 19.pdf
The Economic History of the U.S. Lecture 19.pdfGale Pooley
 
06_Joeri Van Speybroek_Dell_MeetupDora&Cybersecurity.pdf
06_Joeri Van Speybroek_Dell_MeetupDora&Cybersecurity.pdf06_Joeri Van Speybroek_Dell_MeetupDora&Cybersecurity.pdf
06_Joeri Van Speybroek_Dell_MeetupDora&Cybersecurity.pdfFinTech Belgium
 
Log your LOA pain with Pension Lab's brilliant campaign
Log your LOA pain with Pension Lab's brilliant campaignLog your LOA pain with Pension Lab's brilliant campaign
Log your LOA pain with Pension Lab's brilliant campaignHenry Tapper
 
The Economic History of the U.S. Lecture 18.pdf
The Economic History of the U.S. Lecture 18.pdfThe Economic History of the U.S. Lecture 18.pdf
The Economic History of the U.S. Lecture 18.pdfGale Pooley
 
Booking open Available Pune Call Girls Wadgaon Sheri 6297143586 Call Hot Ind...
Booking open Available Pune Call Girls Wadgaon Sheri  6297143586 Call Hot Ind...Booking open Available Pune Call Girls Wadgaon Sheri  6297143586 Call Hot Ind...
Booking open Available Pune Call Girls Wadgaon Sheri 6297143586 Call Hot Ind...Call Girls in Nagpur High Profile
 
Stock Market Brief Deck (Under Pressure).pdf
Stock Market Brief Deck (Under Pressure).pdfStock Market Brief Deck (Under Pressure).pdf
Stock Market Brief Deck (Under Pressure).pdfMichael Silva
 
Best VIP Call Girls Noida Sector 18 Call Me: 8448380779
Best VIP Call Girls Noida Sector 18 Call Me: 8448380779Best VIP Call Girls Noida Sector 18 Call Me: 8448380779
Best VIP Call Girls Noida Sector 18 Call Me: 8448380779Delhi Call girls
 
Top Rated Pune Call Girls Viman Nagar ⟟ 6297143586 ⟟ Call Me For Genuine Sex...
Top Rated  Pune Call Girls Viman Nagar ⟟ 6297143586 ⟟ Call Me For Genuine Sex...Top Rated  Pune Call Girls Viman Nagar ⟟ 6297143586 ⟟ Call Me For Genuine Sex...
Top Rated Pune Call Girls Viman Nagar ⟟ 6297143586 ⟟ Call Me For Genuine Sex...Call Girls in Nagpur High Profile
 
03_Emmanuel Ndiaye_Degroof Petercam.pptx
03_Emmanuel Ndiaye_Degroof Petercam.pptx03_Emmanuel Ndiaye_Degroof Petercam.pptx
03_Emmanuel Ndiaye_Degroof Petercam.pptxFinTech Belgium
 
02_Fabio Colombo_Accenture_MeetupDora&Cybersecurity.pptx
02_Fabio Colombo_Accenture_MeetupDora&Cybersecurity.pptx02_Fabio Colombo_Accenture_MeetupDora&Cybersecurity.pptx
02_Fabio Colombo_Accenture_MeetupDora&Cybersecurity.pptxFinTech Belgium
 
The Economic History of the U.S. Lecture 22.pdf
The Economic History of the U.S. Lecture 22.pdfThe Economic History of the U.S. Lecture 22.pdf
The Economic History of the U.S. Lecture 22.pdfGale Pooley
 
Indore Real Estate Market Trends Report.pdf
Indore Real Estate Market Trends Report.pdfIndore Real Estate Market Trends Report.pdf
Indore Real Estate Market Trends Report.pdfSaviRakhecha1
 
Basic concepts related to Financial modelling
Basic concepts related to Financial modellingBasic concepts related to Financial modelling
Basic concepts related to Financial modellingbaijup5
 
Dharavi Russian callg Girls, { 09892124323 } || Call Girl In Mumbai ...
Dharavi Russian callg Girls, { 09892124323 } || Call Girl In Mumbai ...Dharavi Russian callg Girls, { 09892124323 } || Call Girl In Mumbai ...
Dharavi Russian callg Girls, { 09892124323 } || Call Girl In Mumbai ...Pooja Nehwal
 
The Economic History of the U.S. Lecture 26.pdf
The Economic History of the U.S. Lecture 26.pdfThe Economic History of the U.S. Lecture 26.pdf
The Economic History of the U.S. Lecture 26.pdfGale Pooley
 

Recently uploaded (20)

(ANIKA) Budhwar Peth Call Girls Just Call 7001035870 [ Cash on Delivery ] Pun...
(ANIKA) Budhwar Peth Call Girls Just Call 7001035870 [ Cash on Delivery ] Pun...(ANIKA) Budhwar Peth Call Girls Just Call 7001035870 [ Cash on Delivery ] Pun...
(ANIKA) Budhwar Peth Call Girls Just Call 7001035870 [ Cash on Delivery ] Pun...
 
Solution Manual for Financial Accounting, 11th Edition by Robert Libby, Patri...
Solution Manual for Financial Accounting, 11th Edition by Robert Libby, Patri...Solution Manual for Financial Accounting, 11th Edition by Robert Libby, Patri...
Solution Manual for Financial Accounting, 11th Edition by Robert Libby, Patri...
 
The Economic History of the U.S. Lecture 23.pdf
The Economic History of the U.S. Lecture 23.pdfThe Economic History of the U.S. Lecture 23.pdf
The Economic History of the U.S. Lecture 23.pdf
 
Independent Call Girl Number in Kurla Mumbai📲 Pooja Nehwal 9892124323 💞 Full ...
Independent Call Girl Number in Kurla Mumbai📲 Pooja Nehwal 9892124323 💞 Full ...Independent Call Girl Number in Kurla Mumbai📲 Pooja Nehwal 9892124323 💞 Full ...
Independent Call Girl Number in Kurla Mumbai📲 Pooja Nehwal 9892124323 💞 Full ...
 
The Economic History of the U.S. Lecture 19.pdf
The Economic History of the U.S. Lecture 19.pdfThe Economic History of the U.S. Lecture 19.pdf
The Economic History of the U.S. Lecture 19.pdf
 
06_Joeri Van Speybroek_Dell_MeetupDora&Cybersecurity.pdf
06_Joeri Van Speybroek_Dell_MeetupDora&Cybersecurity.pdf06_Joeri Van Speybroek_Dell_MeetupDora&Cybersecurity.pdf
06_Joeri Van Speybroek_Dell_MeetupDora&Cybersecurity.pdf
 
VIP Independent Call Girls in Andheri 🌹 9920725232 ( Call Me ) Mumbai Escorts...
VIP Independent Call Girls in Andheri 🌹 9920725232 ( Call Me ) Mumbai Escorts...VIP Independent Call Girls in Andheri 🌹 9920725232 ( Call Me ) Mumbai Escorts...
VIP Independent Call Girls in Andheri 🌹 9920725232 ( Call Me ) Mumbai Escorts...
 
Log your LOA pain with Pension Lab's brilliant campaign
Log your LOA pain with Pension Lab's brilliant campaignLog your LOA pain with Pension Lab's brilliant campaign
Log your LOA pain with Pension Lab's brilliant campaign
 
The Economic History of the U.S. Lecture 18.pdf
The Economic History of the U.S. Lecture 18.pdfThe Economic History of the U.S. Lecture 18.pdf
The Economic History of the U.S. Lecture 18.pdf
 
Booking open Available Pune Call Girls Wadgaon Sheri 6297143586 Call Hot Ind...
Booking open Available Pune Call Girls Wadgaon Sheri  6297143586 Call Hot Ind...Booking open Available Pune Call Girls Wadgaon Sheri  6297143586 Call Hot Ind...
Booking open Available Pune Call Girls Wadgaon Sheri 6297143586 Call Hot Ind...
 
Stock Market Brief Deck (Under Pressure).pdf
Stock Market Brief Deck (Under Pressure).pdfStock Market Brief Deck (Under Pressure).pdf
Stock Market Brief Deck (Under Pressure).pdf
 
Best VIP Call Girls Noida Sector 18 Call Me: 8448380779
Best VIP Call Girls Noida Sector 18 Call Me: 8448380779Best VIP Call Girls Noida Sector 18 Call Me: 8448380779
Best VIP Call Girls Noida Sector 18 Call Me: 8448380779
 
Top Rated Pune Call Girls Viman Nagar ⟟ 6297143586 ⟟ Call Me For Genuine Sex...
Top Rated  Pune Call Girls Viman Nagar ⟟ 6297143586 ⟟ Call Me For Genuine Sex...Top Rated  Pune Call Girls Viman Nagar ⟟ 6297143586 ⟟ Call Me For Genuine Sex...
Top Rated Pune Call Girls Viman Nagar ⟟ 6297143586 ⟟ Call Me For Genuine Sex...
 
03_Emmanuel Ndiaye_Degroof Petercam.pptx
03_Emmanuel Ndiaye_Degroof Petercam.pptx03_Emmanuel Ndiaye_Degroof Petercam.pptx
03_Emmanuel Ndiaye_Degroof Petercam.pptx
 
02_Fabio Colombo_Accenture_MeetupDora&Cybersecurity.pptx
02_Fabio Colombo_Accenture_MeetupDora&Cybersecurity.pptx02_Fabio Colombo_Accenture_MeetupDora&Cybersecurity.pptx
02_Fabio Colombo_Accenture_MeetupDora&Cybersecurity.pptx
 
The Economic History of the U.S. Lecture 22.pdf
The Economic History of the U.S. Lecture 22.pdfThe Economic History of the U.S. Lecture 22.pdf
The Economic History of the U.S. Lecture 22.pdf
 
Indore Real Estate Market Trends Report.pdf
Indore Real Estate Market Trends Report.pdfIndore Real Estate Market Trends Report.pdf
Indore Real Estate Market Trends Report.pdf
 
Basic concepts related to Financial modelling
Basic concepts related to Financial modellingBasic concepts related to Financial modelling
Basic concepts related to Financial modelling
 
Dharavi Russian callg Girls, { 09892124323 } || Call Girl In Mumbai ...
Dharavi Russian callg Girls, { 09892124323 } || Call Girl In Mumbai ...Dharavi Russian callg Girls, { 09892124323 } || Call Girl In Mumbai ...
Dharavi Russian callg Girls, { 09892124323 } || Call Girl In Mumbai ...
 
The Economic History of the U.S. Lecture 26.pdf
The Economic History of the U.S. Lecture 26.pdfThe Economic History of the U.S. Lecture 26.pdf
The Economic History of the U.S. Lecture 26.pdf
 

CommSec State of the States - April 2015

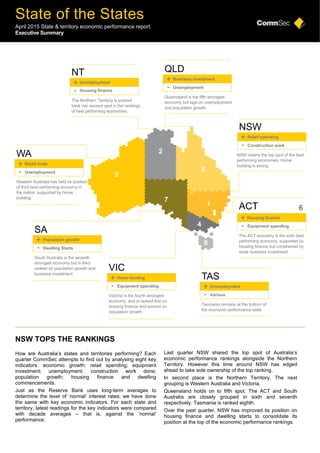
  • 1. State of the States April 2015 State & territory economic performance report. Executive Summary NSW TOPS THE RANKINGS How are Australia’s states and territories performing? Each quarter CommSec attempts to find out by analysing eight key indicators: economic growth; retail spending; equipment investment; unemployment; construction work done; population growth; housing finance and dwelling commencements. Just as the Reserve Bank uses long-term averages to determine the level of ‘normal’ interest rates; we have done the same with key economic indicators. For each state and territory, latest readings for the key indicators were compared with decade averages – that is, against the ‘normal’ performance. Last quarter NSW shared the top spot of Australia’s economic performance rankings alongside the Northern Territory. However this time around NSW has edged ahead to take sole ownership of the top ranking. In second place is the Northern Territory. The next grouping is Western Australia and Victoria. Queensland holds on to fifth spot. The ACT and South Australia are closely grouped in sixth and seventh respectively. Tasmania is ranked eighth. Over the past quarter, NSW has improved its position on housing finance and dwelling starts to consolidate its position at the top of the economic performance rankings. 3 2 7 4 8 5 1 + - Unemployment Housing finance The Northern Territory is pushed back into second spot in the rankings of best performing economies. NT + - Queensland is the fifth strongest economy but lags on unemployment and population growth. QLD Unemployment Business investment + - NSW retains the top spot of the best performing economies. Home building is strong. NSW Construction work Retail spending + - The ACT economy is the sixth best performing economy, supported by housing finance but constrained by weak business investment. ACT Equipment spending Housing finance 6 + - Tasmania remains at the bottom of the economic performance table. TAS Various Unemployment + - Victoria is the fourth strongest economy, and is ranked first on housing finance and second on population growth. VIC Equipment spending Home lending + - South Australia is the seventh strongest economy but is third ranked on population growth and business investment. SA Dwelling Starts Population growth + - Western Australia has held its position of third best performing economy in the nation, supported by home building. WA Unemployment Retail trade
  • 2. State of the States April 2015 2 NSW has retained its top ranking on population growth and retail trade and is also now number one on dwelling starts. It is second placed on business investment, and housing finance. NSW is fourth on overall construction work, unemployment and fifth on economic growth. The Northern Territory has drifted to second place, giving up the mantle of best-performing economy. The NT is top on four indicators including the job market, and third on retail trade. But NT is seventh on population growth and eighth on housing finance. Huge gas projects are driving the NT economy. Western Australia is second-strongest on four indicators – economic growth, retail trade, construction work and dwelling starts. The state has slipped to fourth on housing finance and is now fifth on equipment investment. Being ranked last on unemployment was the biggest drag. Victoria is still the fourth-ranked economy but is closing fast on Western Australia. Victoria is best on housing finance and second ranked on population growth. But Victoria is sixth ranked on both economic growth and equipment investment. Queensland retains fifth position. Queensland does best on overall construction work done. But Queensland is seventh ranked on unemployment and sixth ranked on population growth. The ACT economy is the sixth ranked on economic performance. The territory ranks third on housing finance and economic growth but seventh ranked on equipment investment, dwelling starts, and construction work. South Australia holds seventh spot on the economic performance rankings. South Australia has improved its position on retail trade, equipment investment, and construction work. But it is eighth ranked on dwelling starts. Tasmania remains at the bottom of the Australian economic performance table. But it is now ranked second on unemployment. The Tasmanian jobless rate is now holding at 39-month low of 6.5 per cent. In addition dwelling starts are up 50 per cent on a year ago – the fastest growth rate in 12 years. Methodology Each of the states and territory economies were assessed on eight key indicators: economic growth; retail spending; equipment investment; unemployment, construction work done; population growth; housing finance and dwelling commencements. The aim was to find how each economy was performing compared with “normal”. And just like the Reserve Bank does with interest rates, we used decade-averages to judge the “normal” state of affairs. For each economy, the latest level of the indicator – such as retail spending or economic growth – was compared with the decade average. While we also looked at the current pace of growth to look at economic momentum, it may yield perverse results to judge performance. For instance retail spending may be up sharply on a year ago but from depressed levels. Overall spending may still be well below “normal”. And clearly some states such as Queensland and Western Australia consistently have faster economic growth rates due to historically faster population growth. So the best way to assess economic performance is to look at each indicator in relation to what would be considered ‘normal’ for that state or territory. For instance, the trend jobless rate in the ACT of 4.4 per cent is second lowest of all economies. But this jobless rate is actually up 26.2 per cent on its ‘normal’ or decade-average rate of 3.5 per cent, ranking it sixth on this indicator – that is, it is doing relatively poorly compared with other states & territories. Trend measures of the economic indicators were used to assess performance rather than more volatile seasonally adjusted or original estimates. ECONOMIC GROWTH Ideally gross state product (GSP) would be used to assess broad economic growth. But the data isn’t available quarterly. Rather, state final demand (household and business spending) is added to exports less imports to act as a proxy for GSP. Exclusion of the trade sector would provide an incorrect assessment of growth for economies such as Western Australia and Queensland. The Northern Territory continues to lead the rankings on economic activity. Activity in the ‘top end’ is just under 45 per cent above its ‘normal’ or decade-average level of output. Next strongest is Western Australia, with output around 26 per cent higher than the decade average level of output. Then follows ACT (up 15.2 per cent) from Queensland (up 10.9 per cent). At the other end of the scale, economic activity in Tasmania in the December quarter was just 0.8 per cent above its decade average, while South Australian activity was up just under 9 per cent on its ‘normal’ or average output over the past decade. Northern Territory also has the fastest annual economic growth rate in the nation, up by 3.2 per cent on a year ago, ahead of Western Australia with 3.1 per cent and NSW (2.7 per cent). By contrast, the Queensland economy is down 1.1 per cent on a year ago, while Tasmanian economic activity is up just 0.3 per cent on a year ago with the South Australian economy up 1.2 per cent on a year ago. “Northern Territory also has the fastest annual economic growth rate in the nation, up by 3.2 per cent on a year ago, ahead of Western Australia with 3.1 per cent and NSW (2.7 per cent).”
  • 3. State of the States April 2015 3 RETAIL SPENDING The measure used was real (inflation-adjusted) retail trade in trend terms with December quarter data the latest available. NSW has held onto the top spot on the retail rankings from Western Australia and Northern Territory with spending in the December quarter 17.1 per cent above decade average levels. Solid activity in the housing sector and higher home prices are supporting spending. Western Australia was next strongest, up 16.3 per cent above decade-average levels. Unemployment remains below that of other states, while home building is solidly up on decade averages. Northern Territory was next strongest, with spending 13.5 per cent above decade averages, followed by Victoria (up 13.0 per cent). Tasmania now has the weakest result on retail spending, up just 5.5 per cent on the decade average and below South Australia with 6.2 per cent growth and the ACT with 9.1 per cent growth. If monthly retail trade was assessed instead to calculate the rankings (February data available), the rankings would be exactly the same, except Queensland would be ahead of joint 4th , Northern Territory and Victoria In terms of annual growth of real retail trade, NSW is strongest, up 6.3 per cent, from Victoria, up 4.1 per cent, and Tasmania, up 2.4 per cent. NSW has also the fastest annual growth in monthly retail trade, up 5.5 per cent over the year. “In terms of annual growth of real retail trade, NSW is strongest, up 6.3 per cent, from Victoria, up 4.1 per cent, and Tasmania, up 2.4 per cent.” EQUIPMENT INVESTMENT Northern Territory remains well out in front of the other states and territories when it comes to equipment investment. Spending in the December quarter was a massive 67.9 per cent above ‘normal’ – or decade- average levels. Up until the September quarter, resource-driven economies led the way on investment. However NSW remained in second spot for a second quarter with equipment spending 10.7 per cent above decade- averages. Equipment investment in South Australia was up 6.6 per cent above decade-average levels, followed by Queensland (up 2.6 per cent). By contrast, new equipment spending in Tasmania was 20.1 per cent below its longer-term average in the December quarter after being down 20.8 per cent on the ‘normal’ level in the September quarter. Equipment spending is also below decade-average levels in ACT (-7.4 per cent) and Victoria (-1.9 per cent). On a shorter-run analysis, equipment investment in the December quarter was higher than a year ago in six of the state and territory economies (last quarter, four states and territories had equipment spending up on a year ago). Equipment investment is up the most on a year ago in Northern Territory (up 51.5 per cent), followed by ACT (up 16.7 per cent) and South Australia (up 12.3 per cent). By contrast new equipment investment in both Western Australia and Queensland were down 4.9 per cent on a year ago. “On a shorter-run analysis, equipment investment in the December quarter was higher than a year ago in six of the state and territory economies.”
  • 4. State of the States April 2015 4 UNEMPLOYMENT The Northern Territory has retained the position of strongest job market in the nation. Not only is unemployment in the Northern Territory the lowest in the nation in trend terms (4.3 per cent), but its jobless rate is only 3.6 per cent below its ‘normal’ or decade average level of 4.2 per cent. At the other end of the scale is the Western Australia. While trend unemployment is the third lowest in the nation at 5.7 per cent, this is over 35 per cent higher than the 4.2 per cent ‘normal’ or decade-average rate level – the worst performance in the nation. The Tasmanian jobless rate has fallen from 8.1 per cent in August 2013 to a 39-month low of 6.5 per cent in March. As a result, Tasmania is ranked second on unemployment with the current jobless rate up almost 7.6 per cent on its “normal” or decade average level of 6.0 per cent. Across all the states and territories, the latest unemployment rates are above their decade-average levels. In Victoria, unemployment stands at 6.1 per cent, up 13.9 per cent on its decade average of 5.4 per cent. Similarly in NSW the jobless rate is holding at 6.1 per cent, but it is 15.4 per cent above its decade average level of 5.3 per cent. Next best is South Australia where its 6.7 per cent jobless rate is almost 22 per cent above the decade-average. The ACT has the second lowest unemployment rate across the nation at 4.4 per cent but it 26.2 per cent above its decade average of 3.5 per cent. Queensland’s 6.5 per cent jobless rate is up 26.5 per cent on the ‘normal’ level. “The Tasmanian jobless rate has fallen from 8.1 per cent in August 2013 to a 39-month low of 6.5 per cent in March.” CONSTRUCTION WORK The measure used for analysis was the total amount of residential, commercial and engineering work actually completed in seasonally adjusted terms in the December quarter. The Bureau of Statistics couldn’t provide a trend estimate for the Northern Territory. But we assessed both the seasonally adjusted and other trend results and it is clear that the rankings are the same while growth rates were very close between both estimates. In six states and territories, construction work is higher than decade averages. And there still remains a large gap between the strongest states (the resource states) and weakest state (Tasmania). Construction work done in the Northern Territory was almost 171 per cent above its decade average, ahead of Western Australia (up 33.4 per cent) while Queensland construction was up 10.7 per cent on ‘normal’ levels. In Tasmania, overall new construction work completed is now 4.7 per cent below the decade average after being up 0.3 per cent on its decade average in the September quarter. Next weakest to Tasmania is ACT where construction work is just 0.2 per cent below decade averages, followed by South Australia (up 3.3 per cent). NSW is fourth ranked with construction work 10 per cent above decade averages. Victoria is fifth ranked with construction work almost 8 per cent above ‘normal’ levels. In terms of annual growth rates, Northern Territory construction work done in the December quarter was up 113 per cent on a year ago, followed by Tasmania, up 7 per cent, and Victoria, up 4 per cent. “In terms of annual growth rates, Northern Territory construction work done in the December quarter was up 113 per cent on a year ago, followed by Tasmania, up 7 per cent, and Victoria, up 4 per cent.”
  • 5. State of the States April 2015 5 POPULATION GROWTH To assess population performance we looked at the current annual growth rate and compared it with each economy’s decade-average (‘normal’) growth pace. It is clear that population growth is not providing the same boost to economic activity that it provided in recent years. In fact population growth is only above ‘normal’ or the decade-average in two states and annual growth has eased in all except Northern Territory in the past quarter. While NSW has only the fourth fastest annual growth rate at 1.43 per cent, this is 17 per cent above the decade average (last quarter was 22.8 per cent above ‘normal’.) Victoria is second strongest in annual population growth as well as the differential with the decade-average rate. Victoria’s population is 1.77 per cent higher than a year ago and this growth rate is 3.8 per cent higher than the ‘normal’ or decade-average level. Western Australia is the clear leader in population growth with an annual growth rate of 2.12 per cent – but the slowest in more than eight years. And population growth is 20.3 per cent below decade-average levels. At the other end of the leader-board is Tasmania where the annual population growth of 0.31 per cent was 51.2 per cent below the decade average rate of 0.64 per cent but annual growth was just below the strongest rate in 2½ years. Next lowest was Northern Territory with population growth of 1.14 per cent, down 40.9 per cent on the decade average. “Western Australia is the clear leader in population growth with an annual growth rate of 2.12 per cent – but the slowest in more than eight years. And population growth is 20.3 per cent below decade- average levels.” HOUSING FINANCE The measure used was the trend number of housing finance commitments and this was compared with the decade-average for each respective state and territory. Housing finance is not just a leading indicator for real estate activity and housing construction but also is a useful indicator of activity in the financial sector. It would be useful to compare figures on commercial, personal and lease finance, but unfortunately trend data is not available for states and territories. In four of the states and territories – Victoria, NSW, ACT, and Western Australia – trend housing finance commitments are above decade averages. And in four of the eight economies, trend commitments in February were above year-ago levels. Victoria has now taken top spot for housing finance, with the number of commitments 11.5 per cent above the long-term average. Next strongest was NSW, up 10.4 per cent on the decade-average. The ACT has slipped from first to third spot on housing finance, up 8.4 per cent on the decade average, followed by Western Australia (up 5.5 per cent). Northern Territory is now the weakest for housing finance with trend commitments 23 per cent lower than its decade average. Next weakest was South Australia with trend commitments down 13.7 per cent on the decade average. In Tasmania, home loan commitments are 10.8 per cent below decade averages. But encouragingly commitments are growing – up 0.7 per cent on a year ago. “Victoria has now taken top spot for housing finance, with the number of commitments 11.5 per cent above the long-term average.”
  • 6. State of the States April 2015 6 DWELLING STARTS The measure used was the trend number of dwelling commencements (starts) with the comparison made to the decade-average level of starts. Starts are driven in part by population growth and housing finance and can affect retail trade, unemployment and overall economic growth. However any over-building or under-building in previous years can affect the current level of starts. The outlook for housing construction remains positive with interest rates low and the job market improving. Dwelling starts are above decade averages in seven of the states and territories and starts are above levels of a year ago in all but the ACT. NSW has taken the mantle of the strongest in the nation for new home construction, with starts almost 49 per cent above decade averages. In addition in the December quarter the number of dwellings started was 9.3 per cent higher than a year earlier. In second spot was Western Australia, with starts 43.1 per cent above decade averages, followed by Northern Territory with starts up 39 per cent on decade averages and Victoria, up 22.9 per cent. At the other end of the scale, South Australian dwelling starts were 0.3 per cent below decade averages. And even in the December quarter starts were only 0.1 per cent higher than a year earlier. Next weakest was the ACT (up 0.6 per cent on the decade average), and Tasmania (up 0.8 per cent). On a positive note Tasmanian dwelling starts were up 50 per cent in the December quarter compared with a year ago – the strongest growth in 12 years. “NSW has taken the mantle of the strongest in the nation for new home construction, with starts almost 49 per cent above decade averages” OTHER INDICATORS In the June quarter, real wages were positive in just one of the eight state and territory economies and flat in another. In the September quarter, real wages were positive in five of the states and territories. And in the December quarter all states and territories recorded real wage growth. Strongest real wage growth was recorded in both in Victoria and Tasmania with wages 1.4 percentage points (pp) higher than consumer prices. Real wage growth was also solid in both South Australia and Northern Territory at 0.9pp. In Western Australia wage growth of 2.3 per cent was only modestly above the 2.0 per cent annual growth of prices. Real wages were only modestly positive in the ACT (+0.5pp). Turning to home prices, in March only five of the capital cities had positive annual growth of home prices. Back in December it was only the ACT that had home prices lower than a year earlier. Strongest growth in home prices was in Sydney (up 13.9 per cent) and then there was a fair gap to Melbourne (up 5.6 per cent) and then another fair gap to the other capital cities. Next strongest was Brisbane with home prices up 2.7 per cent on a year ago, followed by Adelaide (up 2.2 per cent) and Canberra (up 1.5 per cent). Home prices were lower than a year ago in Darwin (-0.8 per cent), Tasmania (-0.3 per cent) and Western Australia (-0.1 per cent). Across Australia there continues to be evidence that annual growth of home prices has eased. Nationally home prices were up by 7.4 per cent on a year ago – the slowest growth in 18 months. “Home prices were lower than a year ago in Darwin (-0.8 per cent), Tasmania (-0.3 per cent) and Western Australia (-0.1 per cent).”
  • 7. State of the States April 2015 7 STATE BY STATE BREAKDOWN NSW NSW has improved its position on housing finance and dwelling starts to consolidate its position at the top of the economic performance rankings. Northern Territory The NT is top on four indicators including the job market, but it’s seventh on population growth and eighth on housing finance. Western Australia Western Australia is second-strongest on four indicators – economic growth, retail trade, dwelling starts and construction work. Victoria Victoria is best on housing finance and population (second ranked).” Queensland Queensland does best on construction work and business investment. South Australia South Australia is third ranked on population growth and business investment but seventh ranked on economic growth, retail trade, housing finance.” ACT The ACT held its position on economic growth (third ranked) but drifted lower on housing finance, dwelling starts and business investment. Tasmania “…the trend jobless rate is at a 39-month low …dwelling starts are up 50 per cent on a year ago – the fastest growth rate in 12 years.” IMPLICATIONS AND OUTLOOK In the October 2014 report, Western Australia was passed by NSW for the top spot. And in the January 2015 report, Western Australia had slipped to third, behind NSW and Northern Territory. In the latest report NSW improved its position, pushing Northern Territory into second place on the performance rankings. There will always be a changing of the guard in terms of economic performance as relative economic growth drivers variably strengthen or fade. The end of the mining construction boom should lead to more balanced growth in Western Australia. NSW is on top because population has been growing in recent years and now home construction is responding to the shortage of accommodation. NSW looks to be well supported by home construction and infrastructure spending over 2015. The Northern Territory is in second spot. While the NT economy is top-ranked on four of the eight economic indicators, it lags on population growth, thus affecting home building activity. Attracting labour to the ‘top end’ remains a constraint on growth. In Victoria, strong population growth is supporting home building activity and in turn employment. It is now showing signs of closing the gap on Western Australia in the economic performance ladder. In Queensland, overall construction work and equipment spending are supporting economic activity. But the soft job market and relative under-performance on population growth are constraining growth in home building. In South Australia, annual population growth is higher than a year ago and unemployment is middle-ranked. But the state underperforms on retail spending and home building and buying. The ACT is third ranked on housing finance but is sixth ranked on unemployment. As a result the ACT economy lacks momentum. There are brighter signs in Tasmania with the trend jobless rate at 39-month lows. Further, dwelling starts are up 50 per cent on a year ago – the fastest growth rate in 12 years. -0.1% -0.8% 2.2% 2.7% 13.9% 5.6% 1.5% -0.3% Home price index
  • 8. State of the States 8 Terms and conditions Produced by Commonwealth Research based on information available at the time of publishing. We believe that the information in this report is correct and any opinions, conclusions or recommendations are reasonably held or made as at the time of its compilation, but no warranty is made as to accuracy, reliability or completeness. To the extent permitted by law, neither Commonwealth Bank of Australia ABN 48 123 123 124 nor any of its subsidiaries accept liability to any person for loss or damage arising from the use of this report. The report has been prepared without taking account of the objectives, financial situation or needs of any particular individual. For this reason, any individual should, before acting on the information in this report, consider the appropriateness of the information, having regard to the individual’s objectives, financial situation and needs and, if necessary, seek appropriate professional advice. In the case of certain securities Commonwealth Bank of Australia is or may be the only market maker. This report is approved and distributed in Australia by Commonwealth Securities Limited ABN 60 067 254 399 a wholly owned but not guaranteed subsidiary of Commonwealth Bank of Australia. This report is approved and distributed in the UK by Commonwealth Bank of Australia incorporated in Australia with limited liability. Registered in England No. BR250 and regulated in the UK by the Financial Conduct Authority (FCA). This report does not purport to be a complete statement or summary. For the purpose of the FCA rules, this report and related services are not intended for private customers and are not available to them. Commonwealth Bank of Australia and its subsidiaries have effected or may effect transactions for their own account in any investments or related investments referred to in this report. CONTACTS Craig James Chief Economist Twitter: @CommSec Savanth Sebastian Economist Twitter: @CommSec