
Recommended
More Related Content
What's hot
What's hot (17)
Viewers also liked
Viewers also liked (15)
Similar to Eci watcher june 2016
Similar to Eci watcher june 2016 (20)
Recently uploaded
Recently uploaded (20)
Eci watcher june 2016
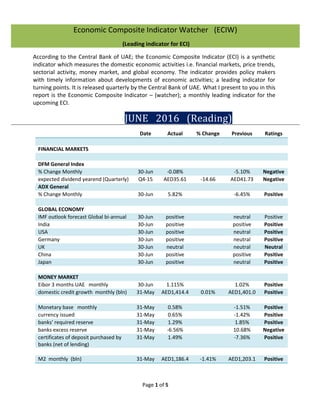
- 1. Page 1 of 5 Economic Composite Indicator Watcher (ECIW) (Leading indicator for ECI) According to the Central Bank of UAE; the Economic Composite Indicator (ECI) is a synthetic indicator which measures the domestic economic activities i.e. financial markets, price trends, sectorial activity, money market, and global economy. The indicator provides policy makers with timely information about developments of economic activities; a leading indicator for turning points. It is released quarterly by the Central Bank of UAE. What I present to you in this report is the Economic Composite Indicator – (watcher); a monthly leading indicator for the upcoming ECI. JUNE 2016 (Reading) Date Actual % Change Previous Ratings FINANCIAL MARKETS DFM General Index % Change Monthly 30-Jun -0.08% -5.10% Negative expected dividend yearend (Quarterly) Q4-15 AED35.61 -14.66 AED41.73 Negative ADX General % Change Monthly 30-Jun 5.82% -6.45% Positive GLOBAL ECONOMY IMF outlook forecast Global bi-annual 30-Jun positive neutral Positive India 30-Jun positive positive Positive USA 30-Jun positive neutral Positive Germany 30-Jun positive neutral Positive UK 30-Jun neutral neutral Neutral China 30-Jun positive positive Positive Japan 30-Jun positive neutral Positive MONEY MARKET Eibor 3 months UAE monthly 30-Jun 1.115% 1.02% Positive domestic credit growth monthly (bln) 31-May AED1,414.4 0.01% AED1,401.0 Positive Monetary base monthly 31-May 0.58% -1.51% Positive currency issued 31-May 0.65% -1.42% Positive banks' required reserve 31-May 1.29% 1.85% Positive banks excess reserve 31-May -6.56% 10.68% Negative certificates of deposit purchased by banks (net of lending) 31-May 1.49% -7.36% Positive M2 monthly (bln) 31-May AED1,186.4 -1.41% AED1,203.1 Positive
- 2. Page 2 of 5 Oil prices (Brent crude) monthly 30-Jun USD48.33 USD49.10 Negative SECTORIAL ACTIVITIES Business activities ( Dubai) Licenses by type Canceled Q1-16 829 791 Negative Renewed Q1-16 36,296 30,657 Positive New Q1-16 5,732 5,200 Positive Building completion statistics ( Abu Dhabi) building completed ( new & additions) Q1-16 977 841 Positive new buildings completed Q1-16 722 722 Neutral residential buildings completed Q1-16 781 706 Positive residential units completed Q1-16 1,551 1,283 Positive PRICES CPI 31-May 0.25% 0.38% Positive CPI - Non-tradables Transportation 30-May 4.08 3.42 Positive Housing 30-May 0.02 0.08 Negative medical care 30-May 0.25 -0.01 Negative Communication 30-May -0.01 -0.07 Positive restaurants and hotels 30-May -0.01 -0.04 Positive Education 30-May 0.00 0.41 Positive recreation & culture 30-May 0.00 -0.22 Positive miscellaneous goods & services 30-May 0.55 -0.01 Positive CPI – Tradables % % foods & soft drinks 30-May -0.96 0.32 Negative beverages and tobacco 30-May 0.23 0.00 Positive textiles, clothing and footware 30-May -0.03 -0.03 Negative furniture and households goods 30-May 0.04 -0.21 Positive Total PMI monthly (Markit Group) 30-Jun 53.40 54.00 Positive TOTAL INDICATOR USED 27
- 3. Page 3 of 5 ECI Watcher VS ECI 2015/ 2016 Total Positives Total Indicators Used ECI - Watcher monthly Score 2015/ 2016 ECI Dec-2015 12 27 Dec-2015 46.15% Total ECI Q4 2.8 Jan-2016 8 27 Jan-2016 30.77% Feb-2016 16 27 Feb-2016 59.26% Mar-2016 17 27 Mar-2016 62.96% Total ECI Q1 3.0 Apr-2016 13 27 Apr-2016 48.15% May-2016 15 27 May-2016 55.56% Jun-2016 20 27 Jun-2016 74.07% Total ECI Q2 ? The “Positives” (in bold-face) in the table above represent those indicators presenting positive outlook for healthy economic growth given the current circumstances, while the “negatives” are those militating against it. And the neutrals, no change. Having said so, the current reading for June 2016 of 74.07 per cent is above the 50.0 per cent mark as required in order to affirm the state of the economy as “positive”. A positive reading above 50.0 per cent is considered good for the economy. This current reading marks the end of Q2 reading and was seen up from the prior reading of 55.56 per cent recorded in May 2016, therefore indicating a possible uptrend in Q2 2016 ECI. The ECI reading was 3.0 for Q1 2016; up from 2.8 seen in Q4 2015. As a confirmation my ECI watcher (ECIW) also gained; moving from 46.15 to 62.96 percent during December 2015 and March 2016 respectively. See table above for details. However, given that the ECI is released at least a month after the end of every quarter the Q2 2016 data will be available towards the end of this month or early August. That is when the trend reading comparison between ECI- watcher (ECIW) and the ECI will be made. So keep this FYI and future reference. Economic Analysis and Overview Financial Market Trends: The Dubai financial market (DFMGI) lost 5.10 and 0.08 percent in May and June respectively; while the Abu Dhabi General Index (ADX) lost 6.45 percent during May rebounded with a gain of 5.82 percent in June. The hefty increase in index value was aided by banks, consumer staples, services and telecommunication indexes. The global markets also witnessed great recoveries since the BREXIT scare that caused market crash across the board. The Dow industrials and S&P 500 are currently at all-time highs; an indication of bullish trend an optimism not seen in recent time. You can be rest assured the DFMGI and the ADX will not be left holding the bag as global markets move in somewhat tandem. Going forward I expect further rally in both indexes; for the DFM 3,600 and a breakout from 4,600 for the ADX given the current global economic growth expectation after BREXIT. The UAE economy is also experiencing a recovery from bottom of economic cycle. The resulting capital gains from market rally will further fuel the consumer spending and greatly contribute to economic growth.
- 4. Page 4 of 5 Interest rate and Price Trends: The consumer price index (CPI) an index of basket of goods and services which measures household consumption price changes occurring within the economic system monthly recorded a drop in June from previous month to 0.25 percent from 0.38 percent (M-O-M). This marks the end of three consecutive monthly increases seen since February this year despite increases of 4.08 percent in transportation and 0.55 percent in miscellaneous goods & services which did more than others in contributing to the current price level which I think should be at a level somewhat higher than this to be considered desirable level. At a time like this when global recession has impeded consumer spending thereby contributing to stockpile in inventory; also given that years of global competition led to decreases in borrowing and lending rates across continents which ultimately led to inventory buildup over the years; it is only imperative for prices to rise so as to discourage borrowing and hence inventory buildup. The slowdown in rate of decreases seen in restaurant & hotels cost also points to growth in economic activities; it went from 0.04 percent decrease in April to 0.01 percent decrease in May prices. This is an indication people are eating out and traveling for business and leisure as restaurants & hotels stop given deep discounts finding it unnecessary to do so. Usually when such items pick up in momentum; it is always an indication people are optimistic about future income- “animal spirit”; this also explains why food & drinks fell as people are no longer cooking at home for the most part. With increases in prices comes an increase in rates which I consider good for the UAE economy at this time given the tight margins in interest rates and prices. Globally, investors are constantly seeking positive increases in real returns, the eibor rates increased in June to 1.115 percent after two consecutive monthly drops seen in May and April to 1.02 and 1.04 percent respectively. For several months now countries like Switzerland and Germany have been experiencing negative interest rates. In other words, banks have been a washed with cash with no borrower at sight. This is another example of a peak in inventory buildup. It is almost as if the companies are waiting for sales to pickup so as to offload inventory. Business and Economic Activities: Business activities in Dubai during Q1 was encouraging as 36,296 business licenses was renewed as against 30,657 renewed in Q4 2015; while new licenses issued was 5,732 as against 5,200 same period under review. This was dampened by the cancelation of 829 business licenses and increase of 38 over the previous quarter in review. The real estate and construction sector in Abu Dhabi also contributed to recent gains seen in ECI- Watcher as new buildings & additions completed came in at 977 in Q1 a change of 136 from 841 during Q4 2015. The residential component for Q1 saw homes completed coming in at 781 new homes compared to 706 in Q4 2015; while residential units (Apartments) completed Q1 was 1,551 versus 1,283 seen in Q4 2015. In furtherance to these, is the behemoth construction project in Dubai been undertaking by EMAAR Properties: The Dubai Creek Harbour capable of impacting the UAE economic growth far into the future.
- 5. Page 5 of 5 Money Market: The monetary policy stance during June was that of ease money as June monetary base increased by 0.58 relative to a drop of 1.51 percent in preceding month. It is from the base that the policy makers create new money. Currency issued added 0.65 versus a decrease of 1.42 percent seen in May. Certificates of deposit purchased by banks net of lending also increased by 1.49 percent as against a reduction of 7.39 percent in May. The certificate of deposit remains the largest component of the base. On the contrary bank excess reserve decreased by 6.56 relative to 10.68 percent observed in the preceding month. This is a confirmation the banks are fully loaned up; while bank required reserves was 1.29 as against 1.85 percent seen in May; this decrease is due to the ease money policy in June. However, M2 decreased by 1.41 percent to AED1, 186.4 (billion) relative to May figure of AED1, 203.1 (billion). The M2 comprise of checking deposit, currency in circulation, Vault cash plus near money. It is the monetary aggregate most commonly watched by policy makers as it comprises high powered money. Global Outlook 2016: Global economic outlook looks promising as positive growth expectation is foreseeable amongst major trading partners of UAE as India the largest of these in terms of trade remains the Worlds’ fastest growing economy; while US, Germany, China and Japan has positive outlook for 2016. June 2016 PMI- UAE: The Emirates NBD Purchasing Managers Index which measures the performance of companies in the non-oil private sector and derived from 400 companies survey; including services, manufacturing, construction, and retail. The component indexes have the following weights: New orders (30 percent), Output (25 percent) Employment (20 percent), Suppliers delivery Times (15 percent), and stock of items purchased (10 percent) fell to 53.6 in June from 54.0 percent in May. The April and March figures were 52.8 and 54.6 percent respectively. A reading above 50.0 percent indicates healthy economic growth; while a reading below 50 indicates contrary. Price : AED100 / Month Sources: Statistic Centre Abu Dhabi Dubai Statistic Centre Central Bank of UAE Dubai Financial Market Abu Dhabi Stock exchange International Monetary Fund (IMF) Markit Group Trading Economics Emaar Properties Produced by: Collins Okonkwo +971-052-7608-263 email: Collins_1994@yahoo.com