1. DistrictofColumbiaBiking toWork MoreThan Quadrupled
in Just Over A Decade inWashington, DC
By
Joy Phillips
Coleen Duncan
Washington, DC had 4.5 percent of commuters bike to work in 2013, according to the U.S. Census Bureau American Community Survey
(ACS) statistics which focused on commuting patterns of workers 16 years and over. The number of people who biked to work increased
from about 3,035 in 2000 to 14,854 in 2013, a 389 percent increase. Nationally, 0.6 percent of workers commute by bike in 2013.
D C S T A T E D A T A C E N T E R Government of the District of Columbia
Office of Planning
State Data Center
STATEDATACENTER
INFOGRAPHIC
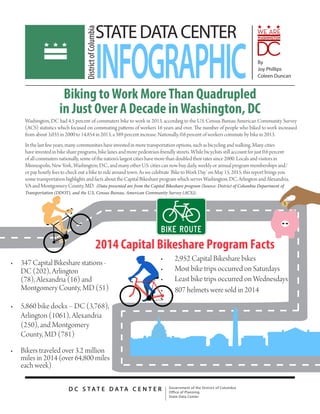
2014 Capital Bikeshare Program Facts
• 2,952 Capital Bikeshare bikes
• Most bike trips occurred on Saturdays
• Least bike trips occurred on Wednesdays
• 807 helmets were sold in 2014
• 347 Capital Bikeshare stations -
DC (202), Arlington
(78), Alexandria (16) and
Montgomery County, MD (51)
• 5,860 bike docks – DC (3,768),
Arlington (1061), Alexandria
(250), and Montgomery
County, MD (781)
• Bikers traveled over 3.2 million
miles in 2014 (over 64,800 miles
each week)
In the last few years, many communities have invested in more transportation options, such as bicycling and walking. Many cities
have invested in bike share programs, bike lanes and more pedestrian-friendly streets. While bicyclists still account for just 0.6 percent
of all commuters nationally, some of the nation’s largest cities have more than doubled their rates since 2000. Locals and visitors in
Minneapolis, New York, Washington, D.C., and many other U.S. cities can now buy daily, weekly or annual program memberships and/
or pay hourly fees to check out a bike to ride around town. As we celebrate ‘Bike to Work Day’ on May 15, 2015, this report brings you
some transportation highlights and facts about the Capital Bikeshare program which serves Washington, DC, Arlington and Alexandria,
VA and Montgomery County, MD. (Data presented are from the Capital Bikeshare program (Source: District of Columbia Department of
Transportation (DDOT), and the U.S. Census Bureau, American Community Survey (ACS)).
$
2. For more information contact:
D.C. Office of Planning State Data Center
1100 4th Street SW, Suite E650, Washington, DC 20024
202.442.7600 ph 202.442.7638 fax
www.planning.dc.gov
• Among the 330,087 District resident workers 16 years and
over, 38.5% took public transportation, 37.6% carpooled,
13.6% walked, 4.5 % biked, 4.4 % worked at home and 1.3%
use other means (ACS 2013)
• Seventy-six percent of all District resident workers 16 years
and older worked in the District (ACS 2013)
DidYou Know?
DC Facts
• There were 2.8 million trips of which
78.5% were member trips and 27.5%
were casual (non-member) trips
• Of workers who did not work from home, the average travel
time to work was 29.9 minutes (ACS 2013)
• Of all workers 16 years and over living in the District
households, 27.7% had no vehicle available (ACS 2013)
• There were 44 reported
crashes in 2014
• There were on average 31,433 active
members in the Capital Bikeshare
program each week
Graphic Design by Rishawna Gould
• There were 248,193 (9%)
trips over 30 minutes
• There are 88 miles of signed bike routes and
69 miles of bike lanes in DC (DDOT)
apital
ikeshare
• There were 25 reported thefts of
Capital Bikeshare bikes of which
19 were recovered