Determining the Pareto front of distributed generator and static VAR compens...
3M Technical Summary - Part 2
1. TECHNICAL SUMMARY
Big Data for Competitive Advantage / DSBA 6100
EXECUTIVE SUMMARY
Patent Data Overview
We analyze 3M’s US patent portfolio relative to seven competitors with
topic modeling, k-means clustering and network analysis. The dataset
includes about 33,000 patents for the eight companies (Appendix 1).
Relative to the selected competitors, 3M has a competitive advantage in
areas like stock materials, synthetic resins, optical systems and adhesives
(Appendix 2). Using cosine similarity on the class distribution by company,
3M’s patent portfolio is most similar to Bostik, Dow and Du Pont, who are
predominately synthetic materials and chemistry companies. General
Electric and Siemens focus more on energy and data & processing patents;
however, these companies compete with 3M in areas like surgery and stock
materials patents (Appendix 3).
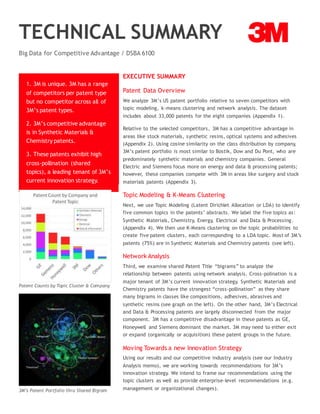
Topic Modeling & K-Means Clustering
Next, we use Topic Modeling (Latent Dirichlet Allocation or LDA) to identify
five common topics in the patents’ abstracts. We label the five topics as:
Synthetic Materials, Chemistry, Energy, Electrical and Data & Processing.
(Appendix 4). We then use K-Means clustering on the topic probabilities to
create five patent clusters, each corresponding to a LDA topic. Most of 3M’s
patents (75%) are in Synthetic Materials and Chemistry patents (see left).
Network Analysis
Third, we examine shared Patent Title “bigrams” to analyze the
relationship between patents using network analysis. Cross-polination is a
major tenant of 3M’s current innovation strategy. Synthetic Materials and
Chemistry patents have the strongest “cross-pollination” as they share
many bigrams in classes like compositions, adhesives, abrasives and
synthetic resins (see graph on the left). On the other hand, 3M’s Electrical
and Data & Processing patents are largely disconnected from the major
component. 3M has a competitive disadvantage in these patents as GE,
Honeywell and Siemens dominant the market. 3M may need to either exit
or expand (organically or acquisition) these patent groups in the future.
Moving Towards a new Innovation Strategy
Using our results and our competitive industry analysis (see our Industry
Analysis memo), we are working towards recommendations for 3M’s
innovation strategy. We intend to frame our recommendations using the
topic clusters as well as provide enterprise-level recommendations (e.g.
management or organizational changes).
1. 3M is unique. 3M has a range
of competitors per patent type
but no competitor across all of
3M’s patent types.
2. 3M’s competitive advantage
is in Synthetic Materials &
Chemistry patents.
3. These patents exhibit high
cross-pollination (shared
topics), a leading tenant of 3M’s
current innovation strategy.
Patent Counts by Topic Cluster & Company
3M’s Patent Portfolio thru Shared Bigram
2. APPENDIX
APPENDIX 1: PATENT COUNT BY COMPANY
[Write a paragraph on how we came up with each of the competitors]
APPENDIX 2: 3M’S TOP 20 PATENTS BY CLASS COMPARED TO FOUR COMPETITORS
[write a paragraph to explain the tables above]
Company Count % of Total
GE 12,528 38%
Siemens 7,329 22%
Honeywell 6,186 19%
3M 3,485 11%
Dow 2,581 8%
Du Pont 373 1%
Johnson & Johnson 296 1%
Bostik 56 0%
Total 32,834 100%
3. APPENDIX 3: 3M COSINE SIMILARITY BY CLASS DISTRIBUTION
Cosine similarity is calculated by taking the vector of the class distribution for each company and calculating a cosine
similarity for any two companies. For example, assume there are five patent classes and three companies: 3M, Dow and
General Electric.
Assume each company’s patent portfolio is distributed by class like:
We then take each patent portfolio distribution vector (e.g. for 3M: 40%, 30%, 20%, 10%, 0%) and plug each into cosine
similarity to get a sample cosine similarity matrix:
Cos Sim 3M Dow GE
3M 1.00 0.93 0.57
Dow 1.00 0.48
GE 1.00
% Patents 3M Dow GE
Stock Material 40% 60% 20%
Abrasives 30% 30% 10%
Surgery 20% 5% 20%
Optics 10% 5% 10%
Turbines 0% 0% 40%
Total 100% 100% 100%
4. APPENDIX 4: FIVE TOPICS IDENTIFIED AND LABELED FROM LDA
Labeled Topic Name Topic Word Cloud
(top 15 words by probability)
“Synthetic Materials”
“Chemistry”
“Energy”
“Electrical”
“Data & Processing”
![APPENDIX
APPENDIX 1: PATENT COUNT BY COMPANY
[Write a paragraph on how we came up with each of the competitors]
APPENDIX 2: 3M’S TOP 20 PATENTS BY CLASS COMPARED TO FOUR COMPETITORS
[write a paragraph to explain the tables above]
Company Count % of Total
GE 12,528 38%
Siemens 7,329 22%
Honeywell 6,186 19%
3M 3,485 11%
Dow 2,581 8%
Du Pont 373 1%
Johnson & Johnson 296 1%
Bostik 56 0%
Total 32,834 100%](data:image/gif;base64,R0lGODlhAQABAIAAAAAAAP///yH5BAEAAAAALAAAAAABAAEAAAIBRAA7)