Differential white blood cell counts and survival in Ethiopian village chickens
cp_poster_13
1. Christopher Plambeck1,4
, Sarah Heidl1,2
, Kevin Roberts1,2,4, Elizabeth Dahlhoff2,3, Nathan Rank1,2
1Sonoma State University, Dept of Biology; 2University of California White Mountain Research Station; 3Santa Clara University, Dept of Biology; 4Sierra Nevada Aquatic Research Lab
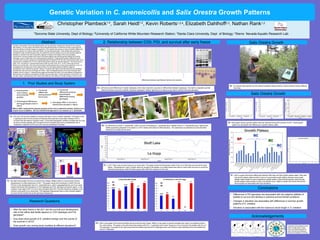
Genetic Variation in C. aneneicollis and Salix Orestra Growth Patterns
Abstract
Acknowledgements
Salix Orestra Growth2. Relationship between COII, PGI, and survival after early freeze
Climate in the Eastern Sierra Nevada Mountains can be extremely variable and stressful for the species
that inhabit it. For this reason the Eastern Sierra Nevada Mountains of California provide a great place to
study the effects of climate change on organisms. Prior studies have shown an array of genetic differences
among a species of montane willow leaf beetle, Chrysomela aeneicollis. These beetles are particularly
vulnerable to their climate because they are ectotherms and their ability to survive and develop depends
partially on whether they have the genetic capacity to respond and adapt to their ever changing
environment. Previous studies have shown that these beetles have specific genetic differences among
drainages, some of these also occur along elevation gradients. These specific genetic differences have
occurred at the enzyme nuclear locus phosphoglucose isomerase (PGI) and the mitochondrial protein locus
cytochrome II oxidase(COII). PGI is a well known genetic marker for thermal tolerance. This study has two
parts. First, I focused on a natural phenomenon that occurred in fall, 2011. In 2011 there was an early
freeze at our study sites. This rare event provided a great opportunity to study natural selection in vivo. To
investigate the consequences of this natural freeze, live and dead beetles at different stages of
development were collected for genetic testing. The genes that relate to thermal tolerance also predicted
development rate and survival through the freeze. I also investigated growth of the main host plant Salix
orestera, which is where C. aeneicollis lays eggs and develops as larvae. We found effects of elevation on
plant growth and additional unexplained variation among study sites. Further exploration of this plant may
provide a better understanding of the willow leaf beetle and the effects of climate change on their survival.
2a. Left shows small differences in beetle haplotypes which allow restriction enzymes to differentiate between haplotypes. Top right is a digestion gel that
utilized restriction enzymes to identify individual haplotypes. Bottom right shows an allozyme gel used to identify individual genotype.
I gratefully acknowledge the hard
work of Jordan Sayre, Tessa
Code, and Whitney Reynier for
help in the field and Stephanie
Parreira for assistance in the lab.
a. Polymorphism
occurs along
environmental
gradient
b. Functional
differences
among enzyme
forms exist
c. Functional
differences produce
physiological
differences among
genotypes
d. Physiological differences
among genotypes exist in
nature
e. Genotypes differ in survival or
reproductive success in nature
Mitton (1997)1 proposed the research program shown here to determine whether variation at an
enzyme locus is adaptive. We have followed this approach in our research on C. aeneicollis.
2b. Far left shows an adult C. aneneicollis. Left is a picture of developing C. aeneicollis larva. Middle shows a C. aneneicollis pupa. Right shows
beetle pupa being prepared to be stored in a -80 C freeze until ready for DNA extraction. Far right shows an adult that survived the lethal
freeze by burrowing into the snow.
2d. Left is a bar graph of the percent beetles that survived the early freeze. Right is a bar graph of percent samples that made it to adulthood before
the early freeze. The graph to the left shows that beetles with PGI 1-1 genotype had a lower frequency of surviving than the beetles with the 4-4
PGI genotype. The graph to the right shows that the beetles that had the h3 haplotype were more likely to reach adulthood then the beetles that
had a h1 haplotype.
2c. In 2011 there was an early freeze at our study sites. This graph shows the temperature data of two of our field sites and shows the early
freeze. Temperatures in early October were low enough to kill beetles, but mobile adults were able to crawl under the snow to avoid the
freezing temperatures, while immobile pupae often died from exposure to the cold.
3c. Left is a graph that shows differences between field sites and their growth plateau dates. Sites with
late growth plateau dates tended to have an exponential growth pattern whereas early growth
plateau dates tended to have a logarithmic growth pattern. Sites that fell between early and late
growth plateau dates tended to have a full growth curve. Right is a graph that shows that shorter
shoot lengths are associated with high elevations.
1b. Top right is the protein structure of cytochrome oxidase. Bottom right is a recent study of larval
development in a field experiment in 2011. This graph shows the contribution of both COII and
PGI loci in the development rate of C. aeneicollis larva. Left is a geographical lay out of our study
system that shows the divergence of COII haplotype and PGI genotype among the region. In the
southern-most region PGI-4 is much more prevalent than PGI-1 but this frequency changes in the
northern-most parts of our study area. The haplotype frequencies have a more complex pattern
but show similar tendencies as the genotype frequencies.
Conclusions
• Differences in PGI genotype are associated with the adaptive abilities of
beetles to survive and develop in extreme environmental conditions.
• Changes in elevation are associated with differences in summer growth
patterns of S. orestera.
• Elevation is associated with the maximum shoot length in S. orestera
PGI genotype
1-1 1-4 4-4
Larvaldevelopmentrate
0.04
0.06
0.08
0.10
0.12
COII 3
COII 1
1. Prior Studies and Study System
TP
BP
SL
RC
TL
PP
PC
PGI-1
PGI-4
h1 h2
h3 h4
Owens
Valley
Salix Orestra Growth
Research Questions
3a. To measure plant growth we took several repeated measurements of plant shoots at twenty different
field sites.
RC
SL
BC
• After the early freeze in fall 2011 did the survival and development
rate of the willow leaf beetle depend on COII haplotype and PGI
genotype?
• How does shoot growth of S. orestera change over the course of
the summer in 2012?
• Does growth vary among study localities at different elevations?
Differences between pyrimidines thymine and cytosine
1a. PGI and COII are two metabolic enzymes that play a role in cellular respiration. PGI plays a role
in glycolysis (which is the process of breaking down glucose to pyruvate) whereas COII is
involved with the electron transport chain. Concordant geographic variation at these two loci may
be due to random genetic drift, but since the two enzymes play such a fundamental role in
metabolism, selection at PGI and COII may be something to consider.
0
10
20
30
40
50
60
70
80
90
100
1-1 1-1 1-4 1-4 4-4 4-4
% Survival after freeze
0
10
20
30
40
50
60
70
80
90
100
1-1 1-1 1-4 1-4 4-4 4-4
% individuals in each life stage
H3 H3 H1 H1
3b. Each graph shows a growth pattern that was observed during the summer of 2012. These growth
pattern are associated with differences in growth plateau dates.