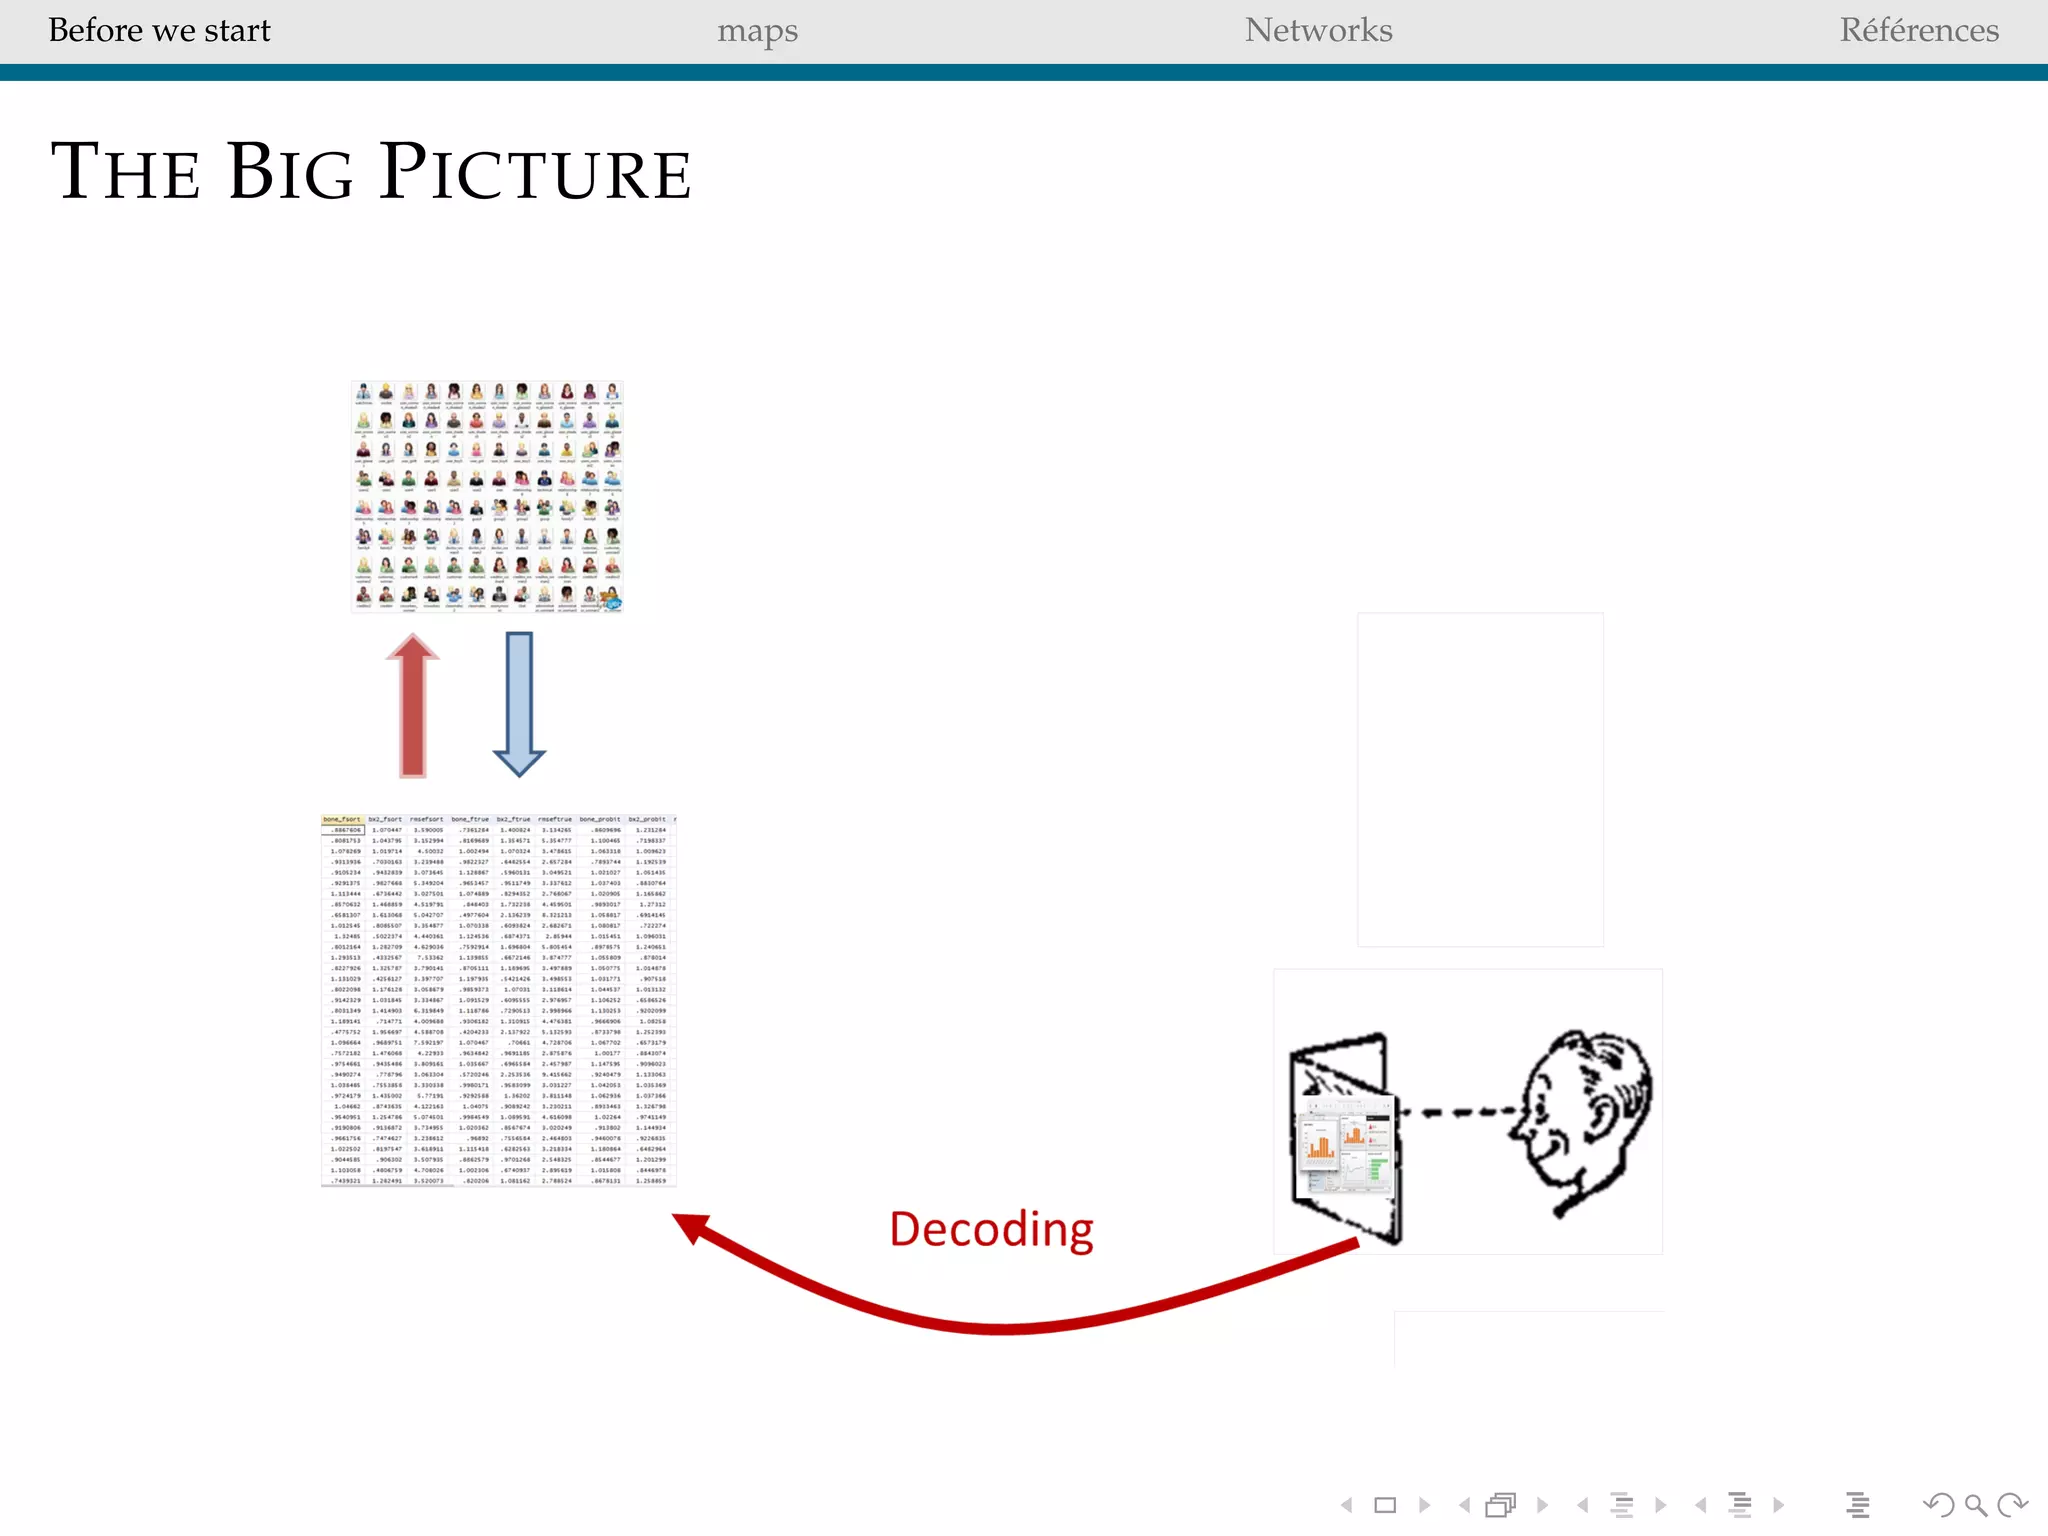
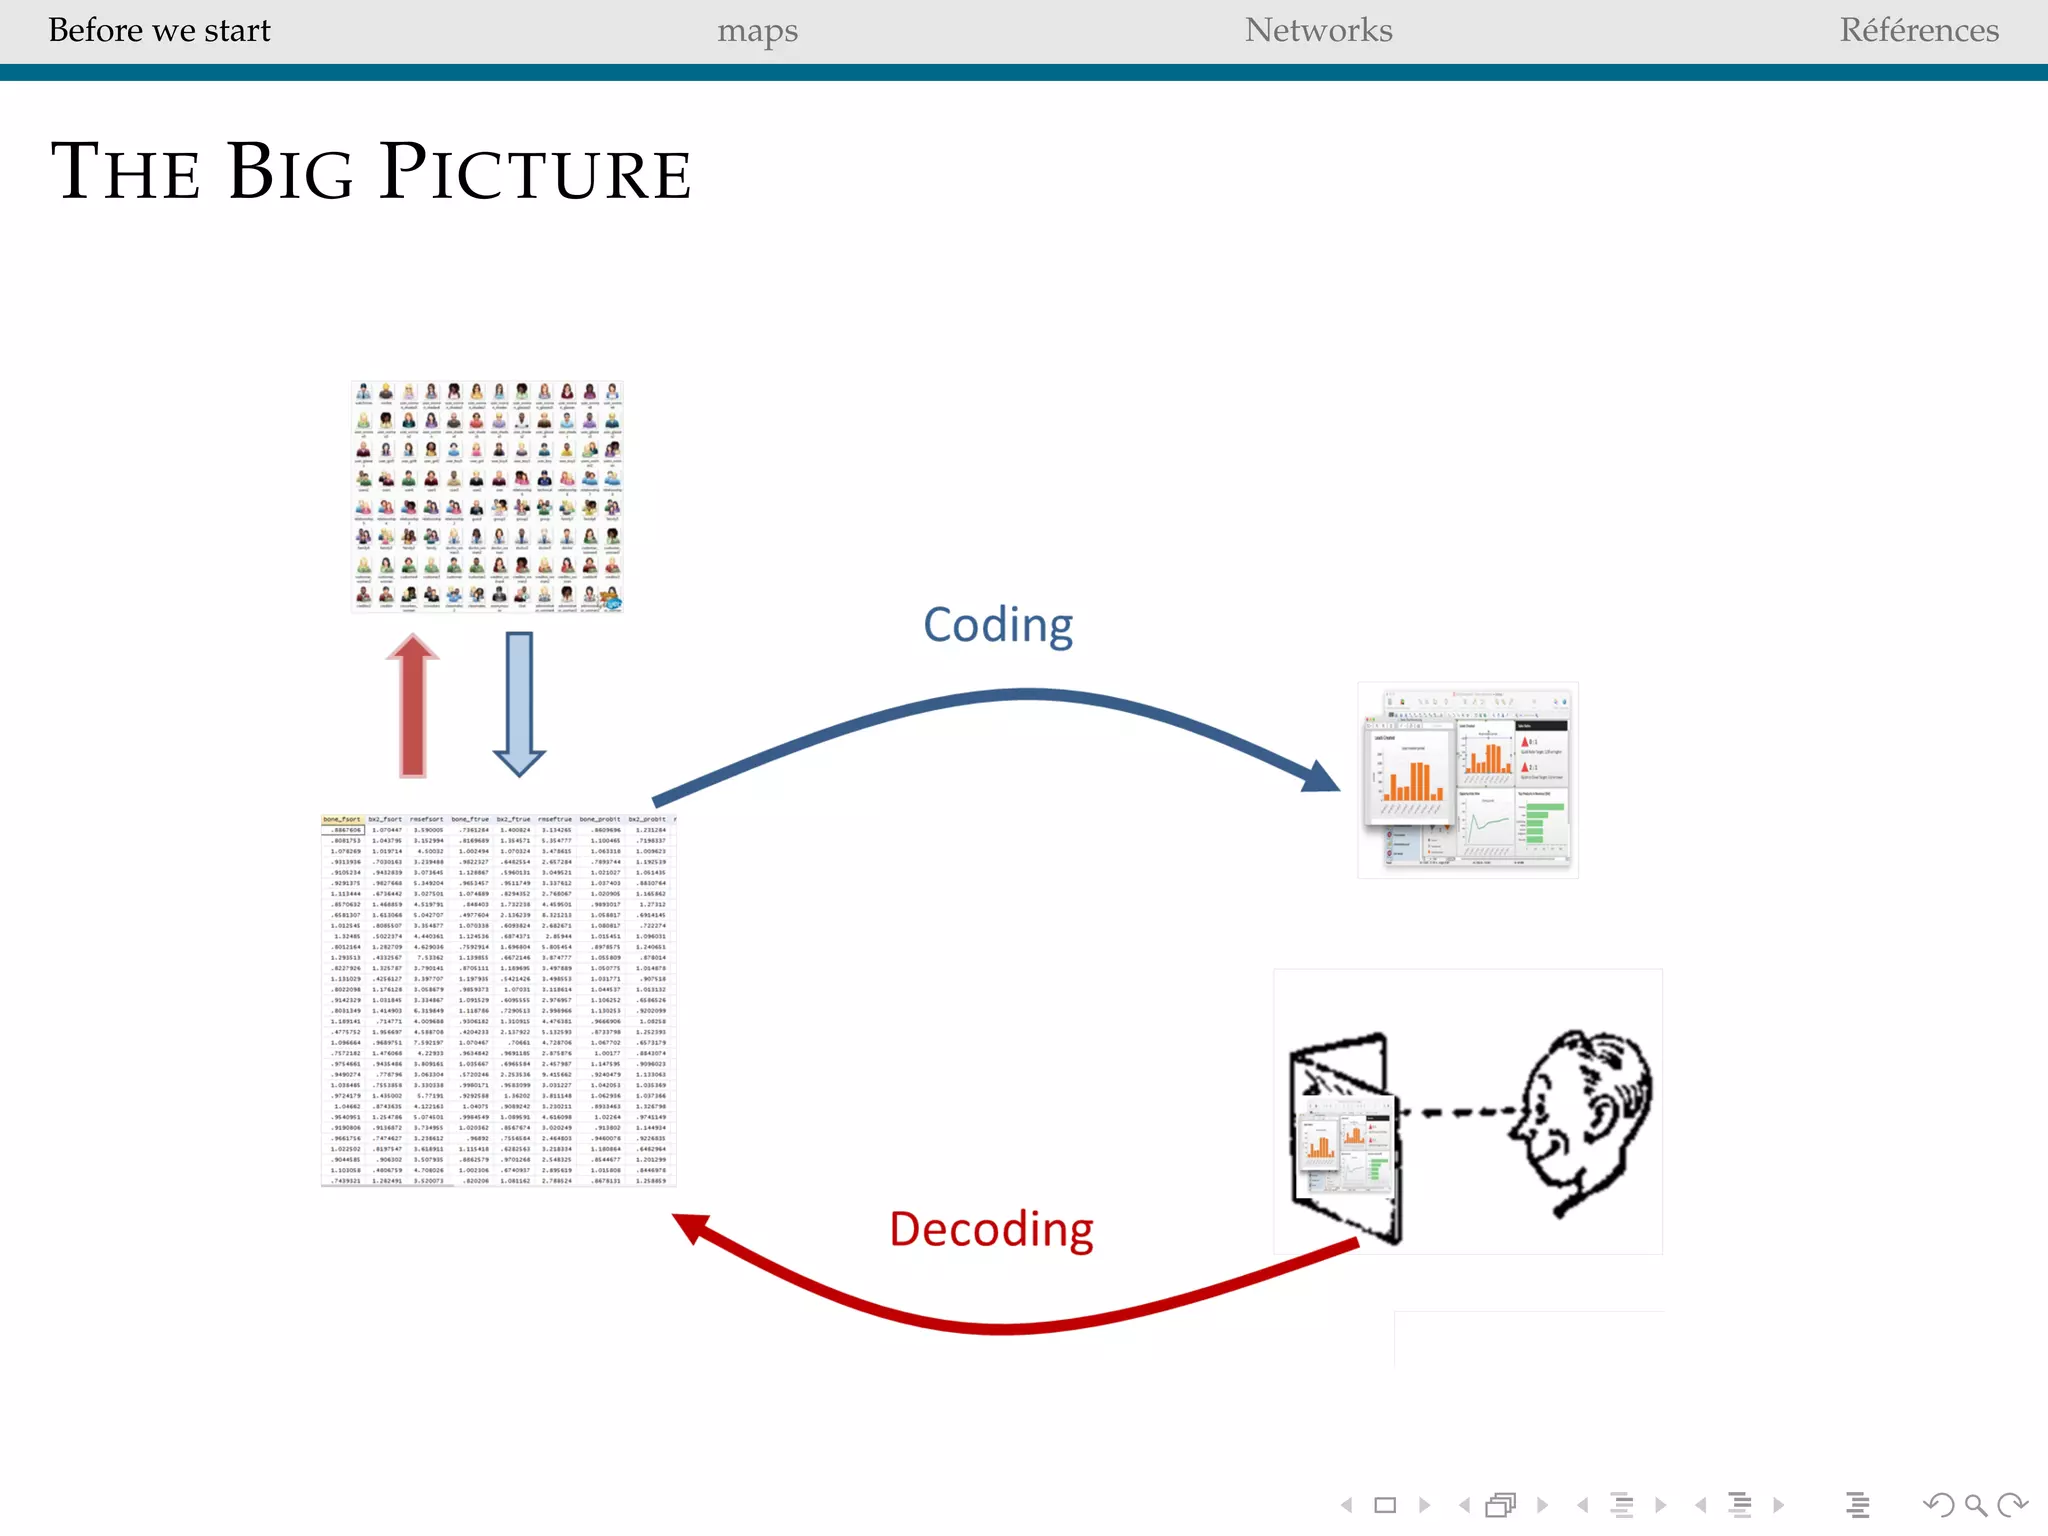
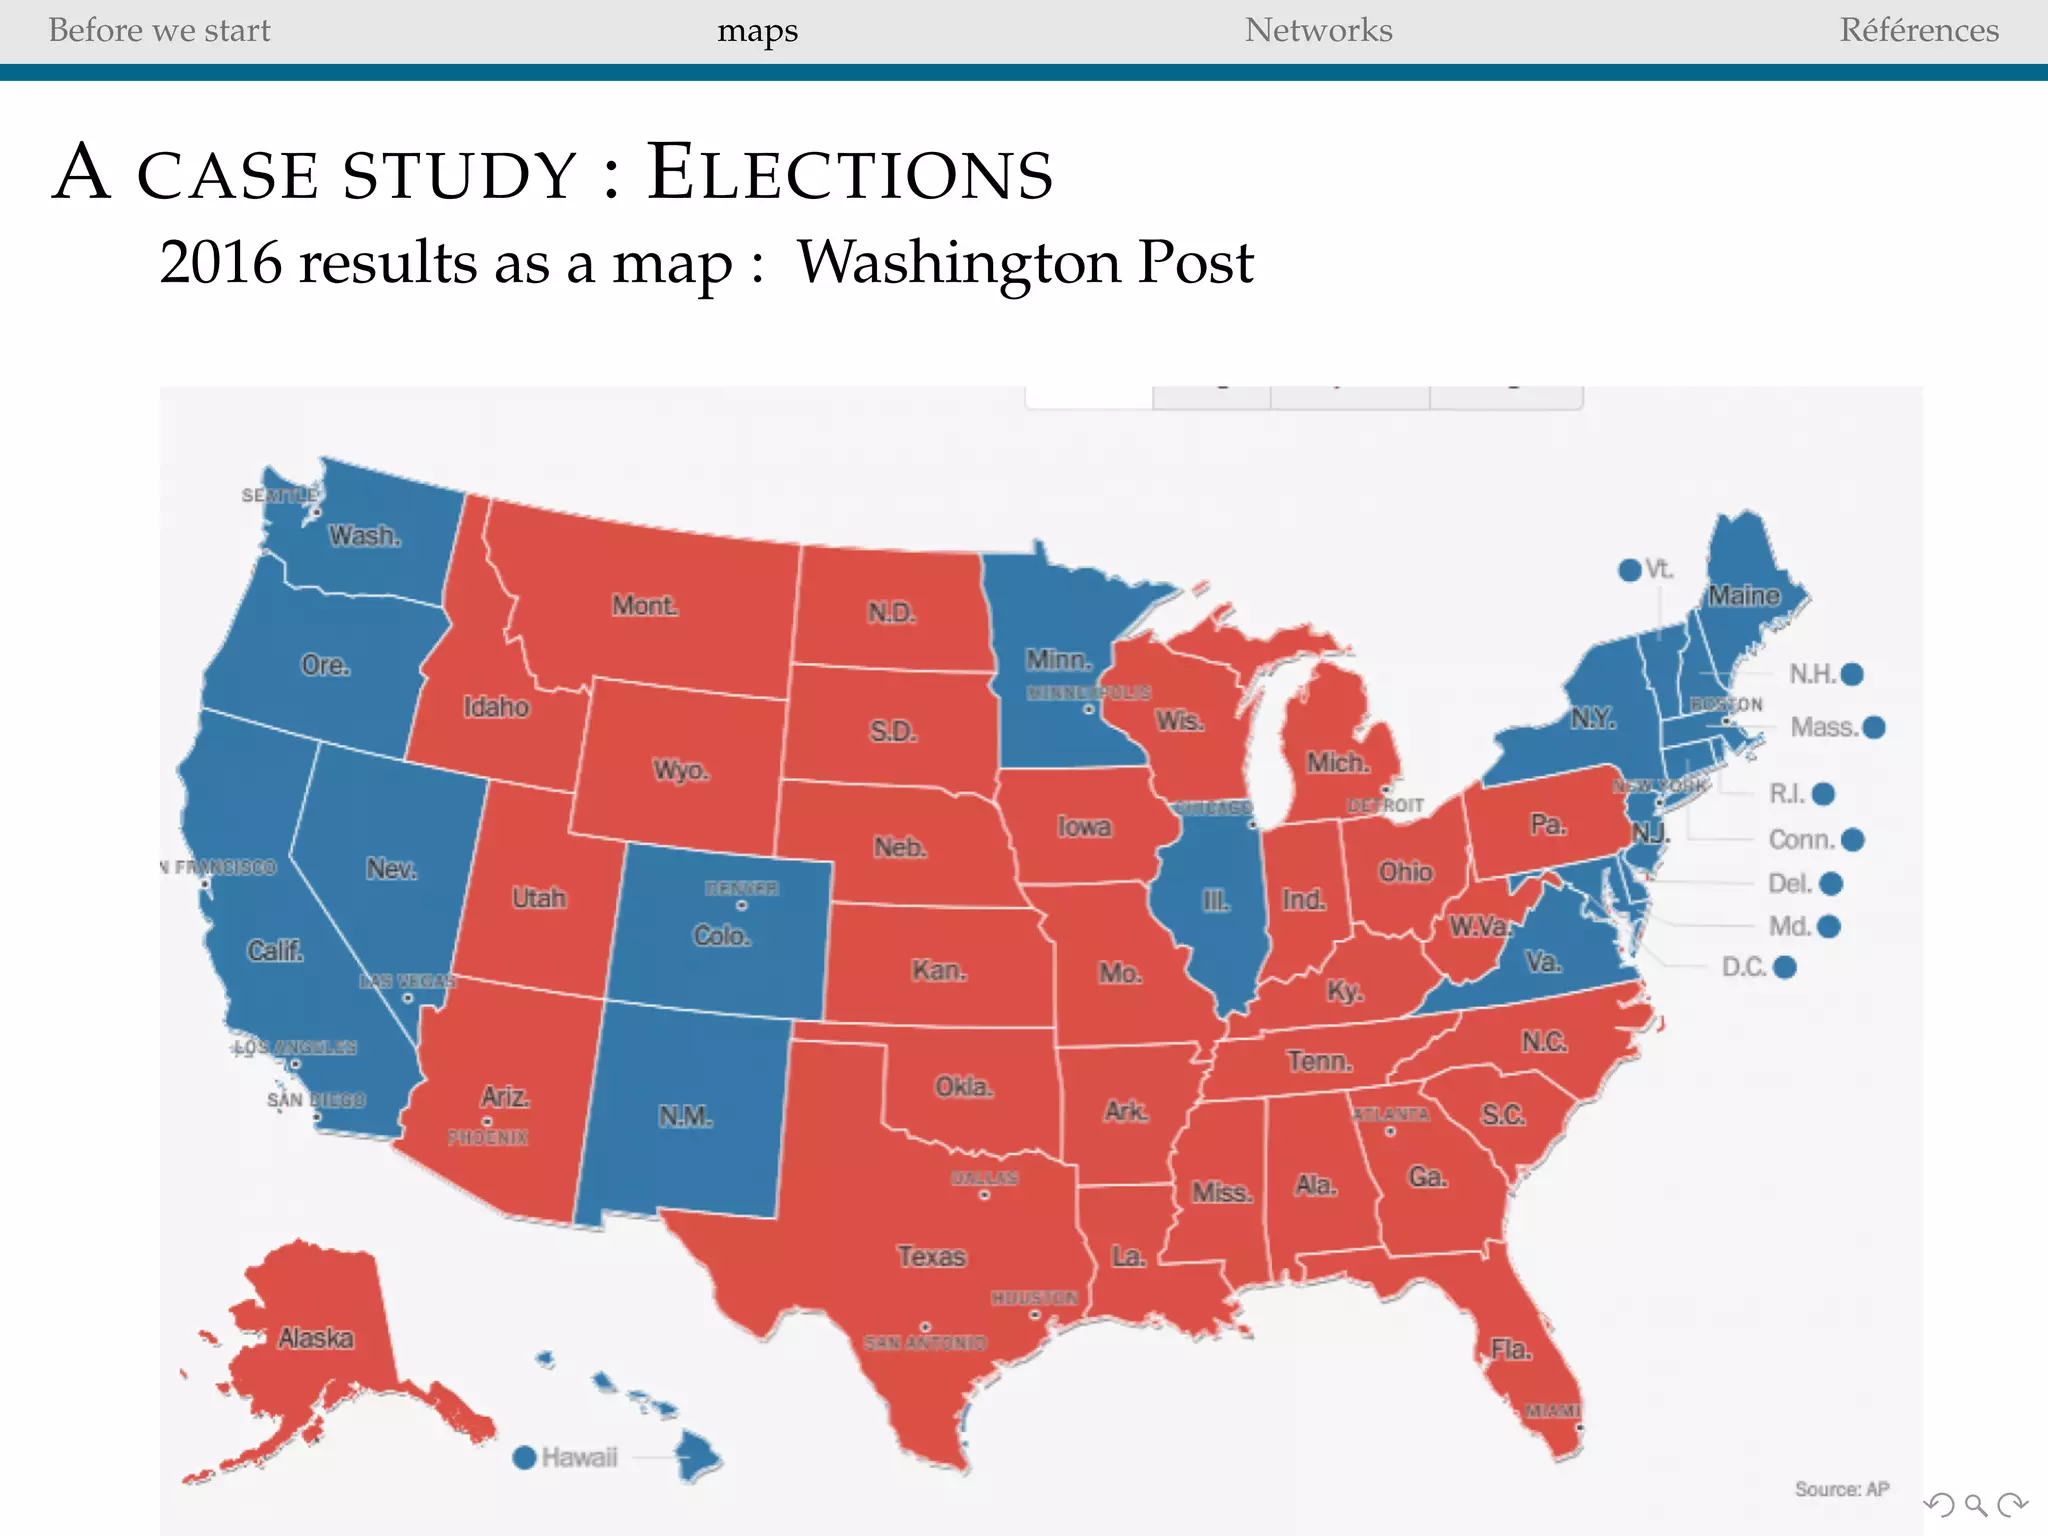
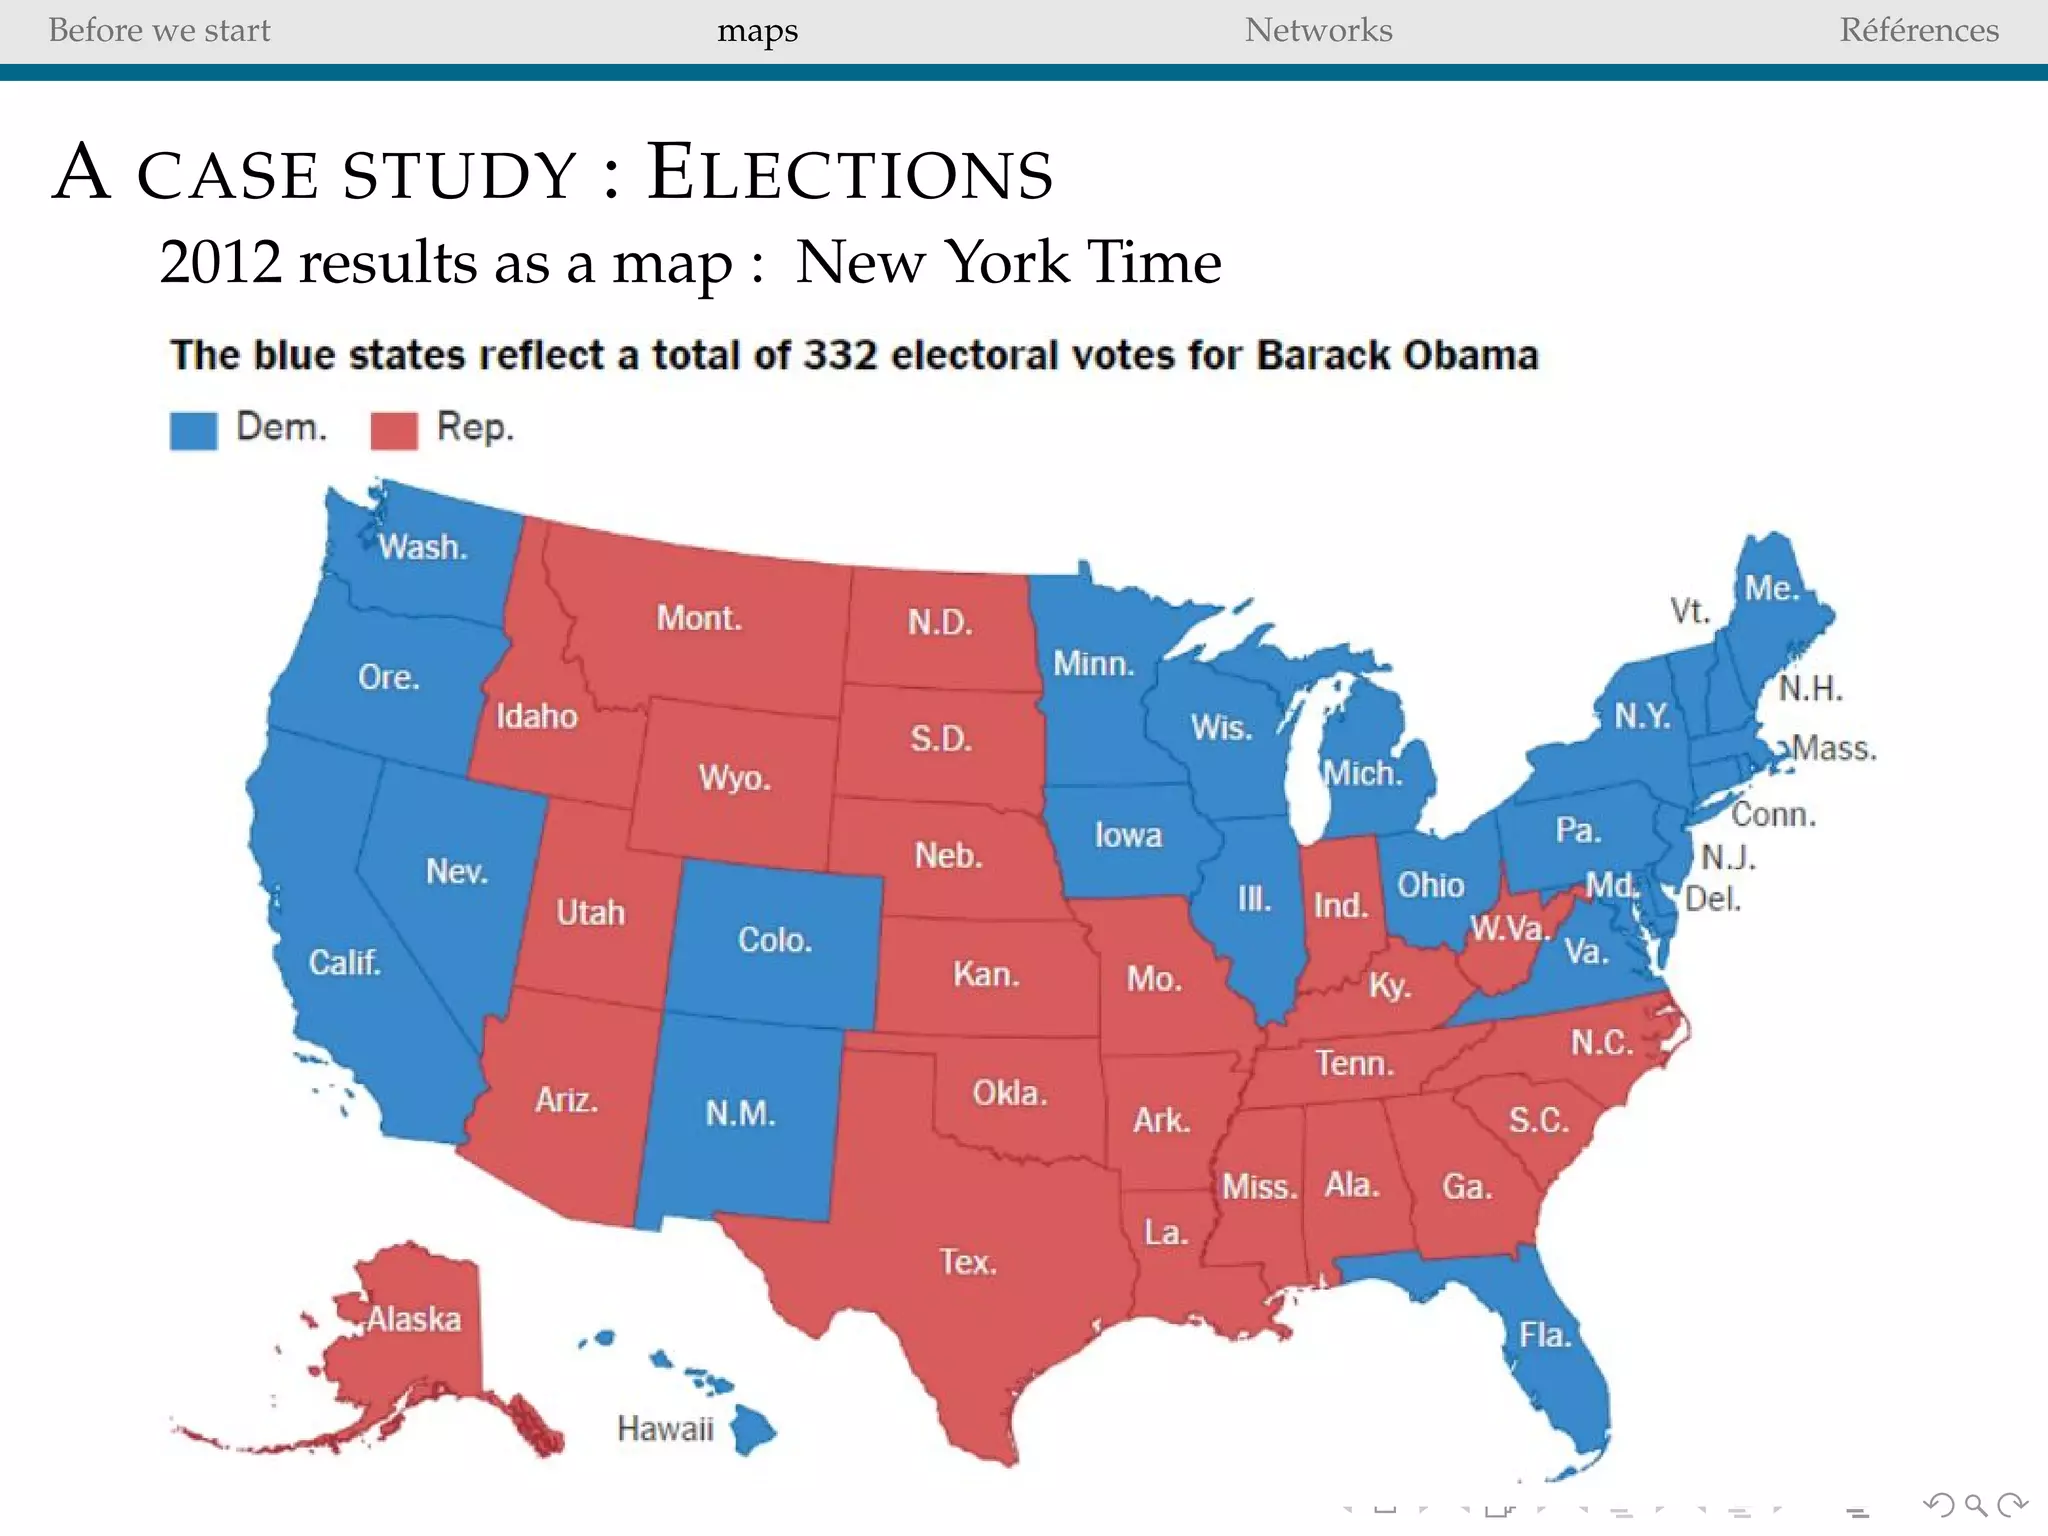
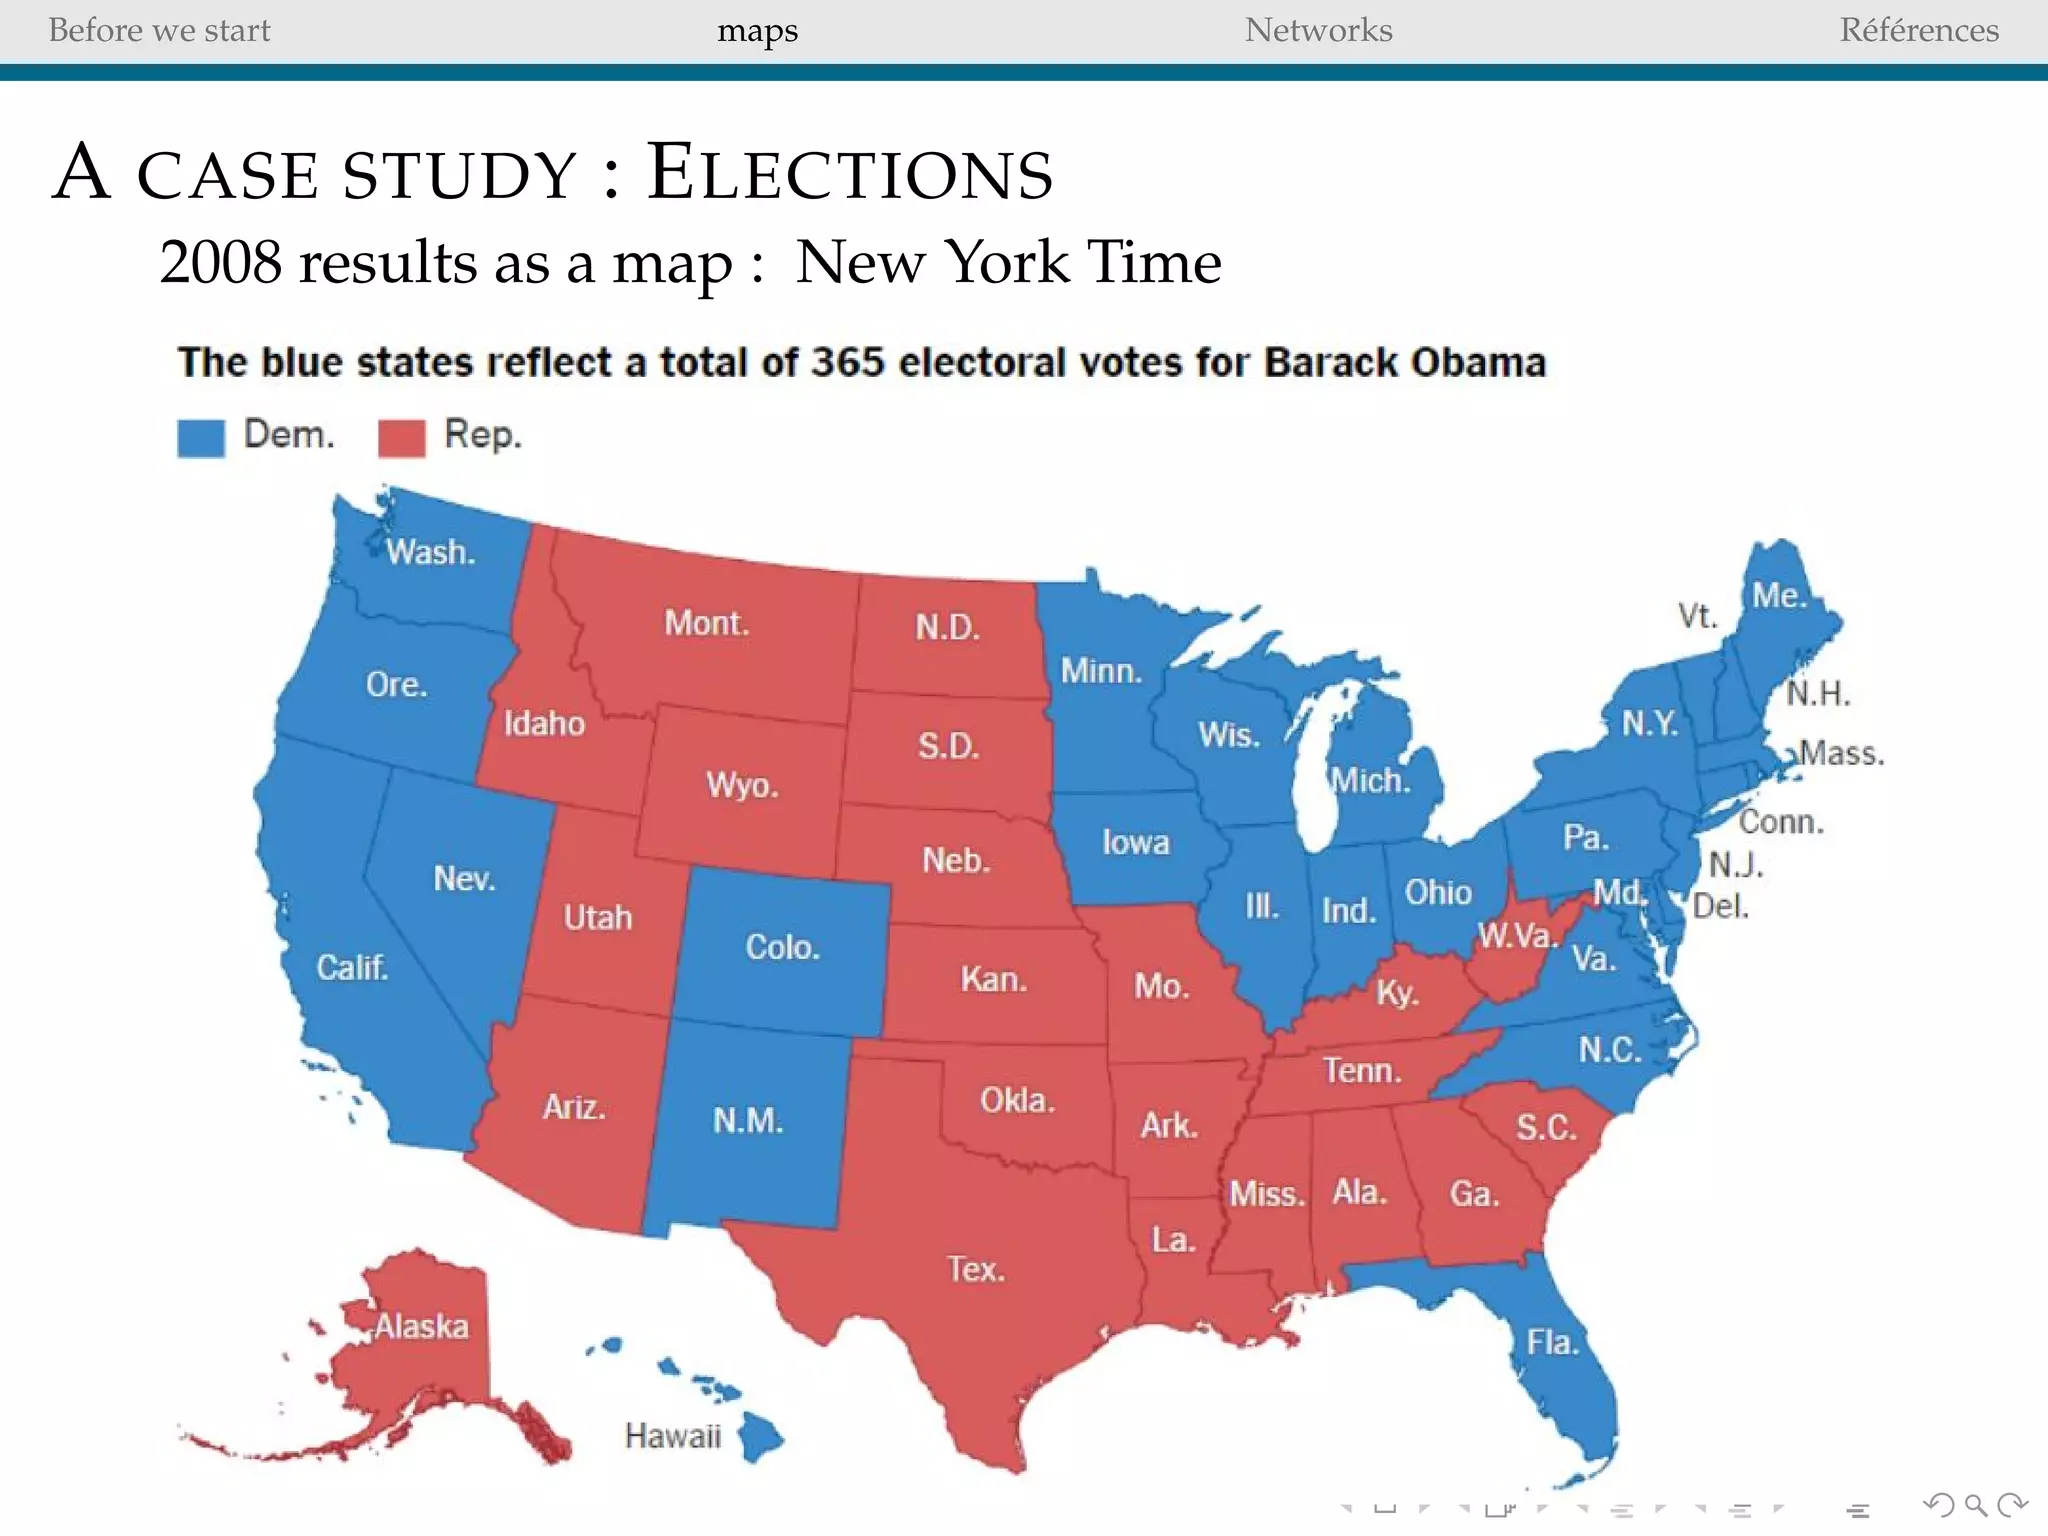
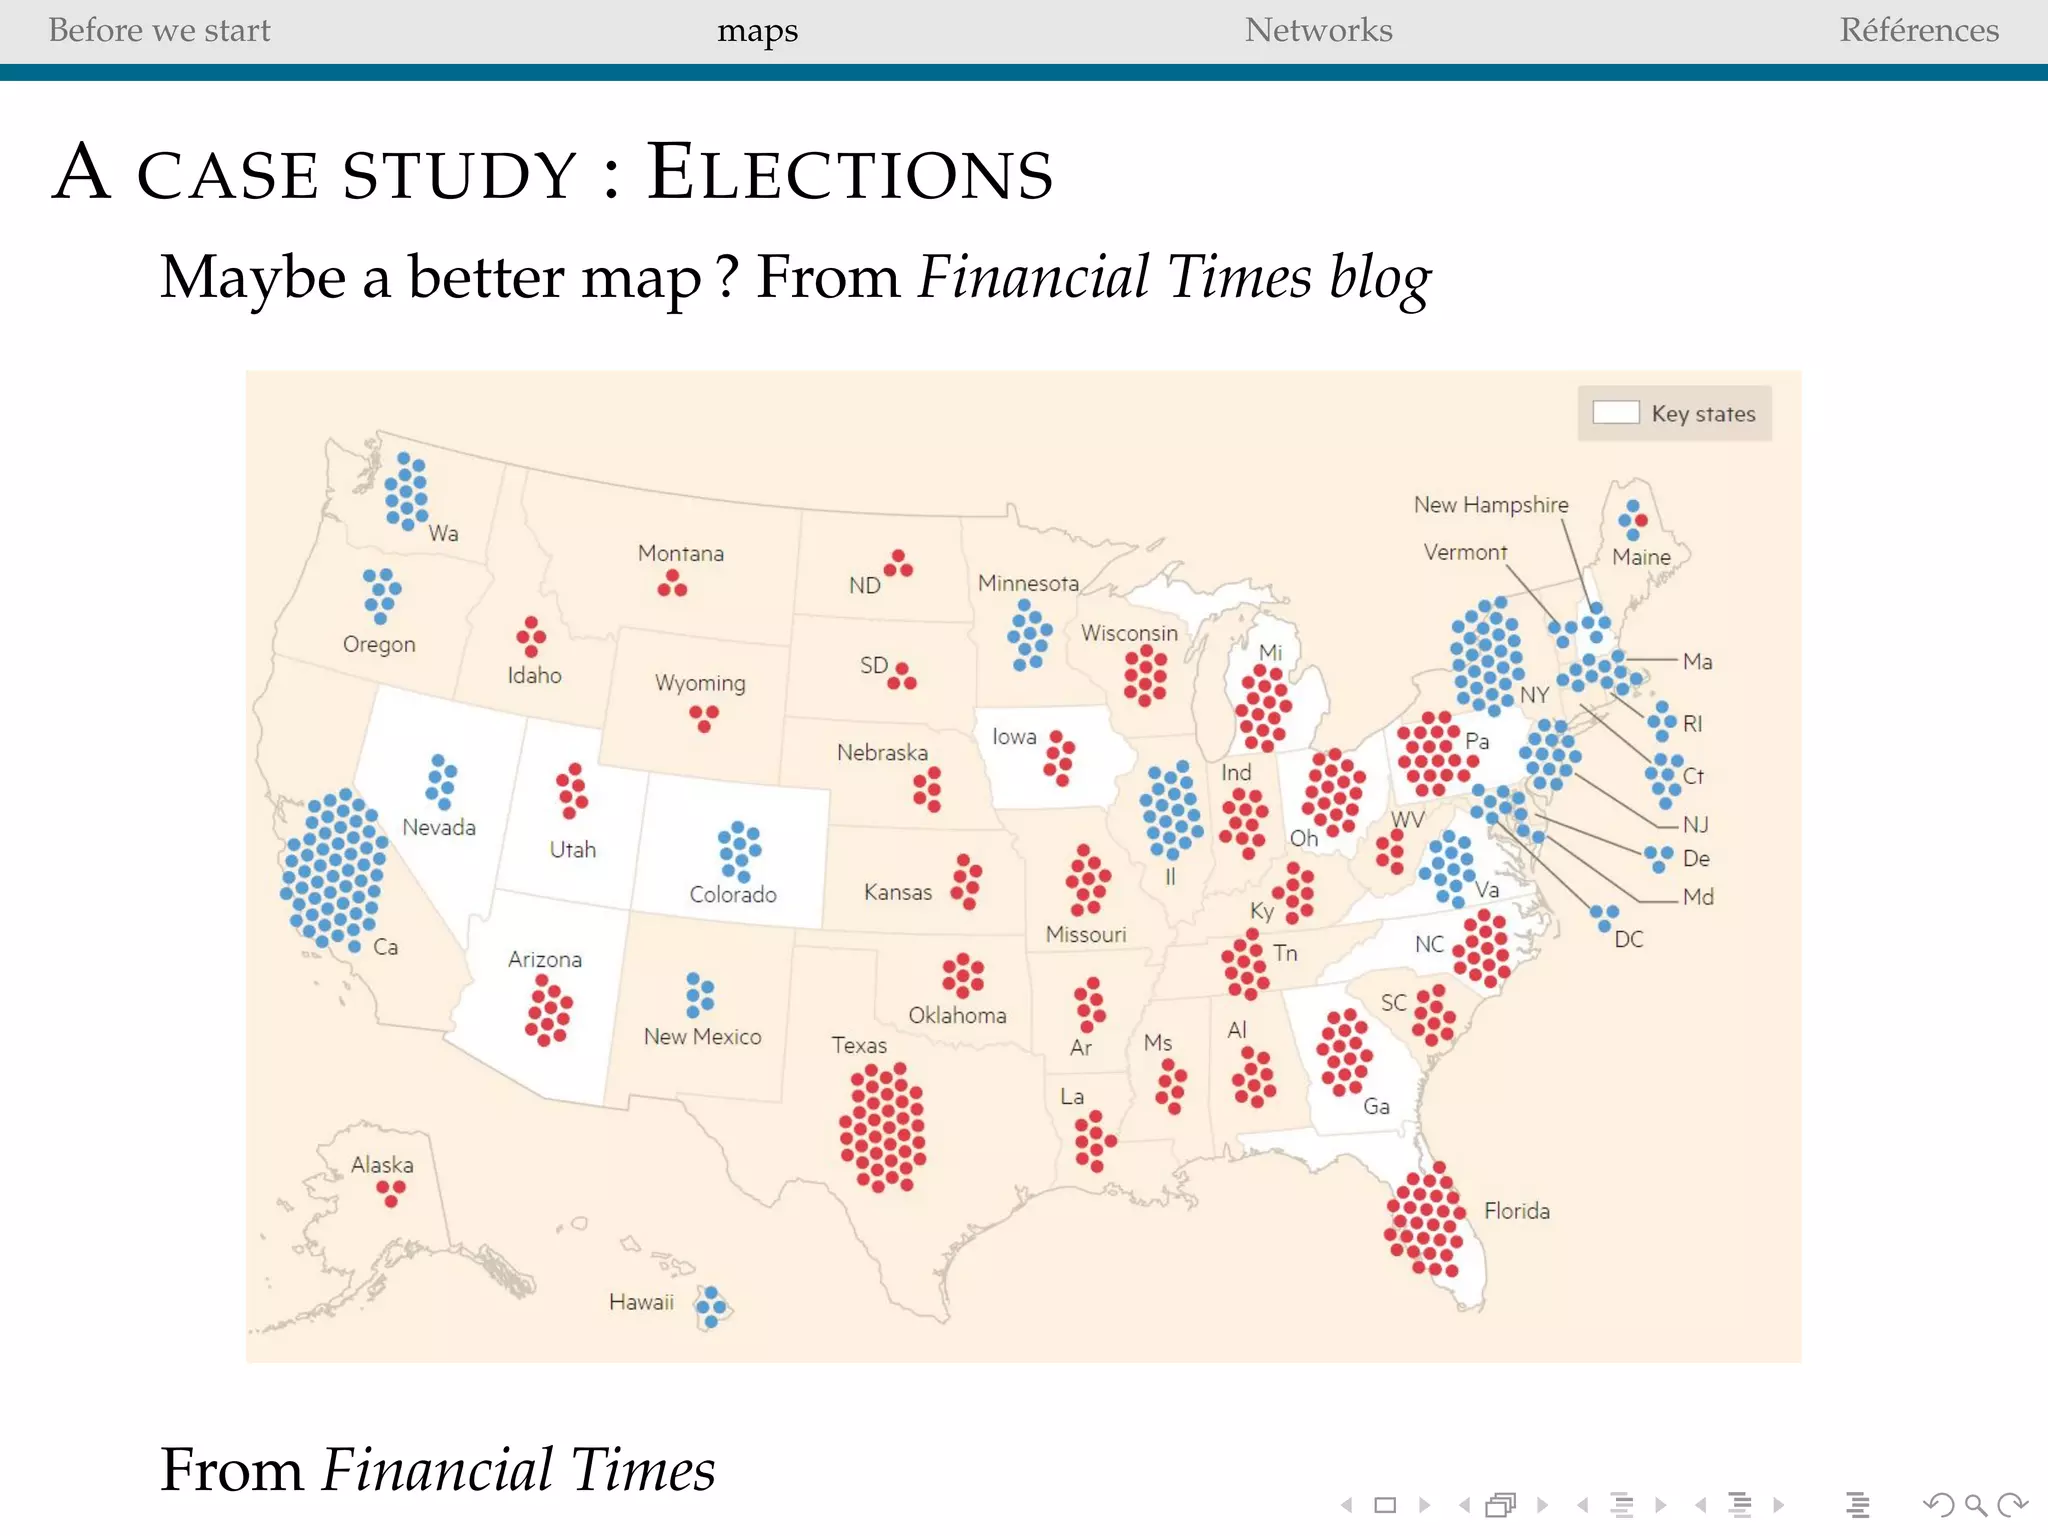
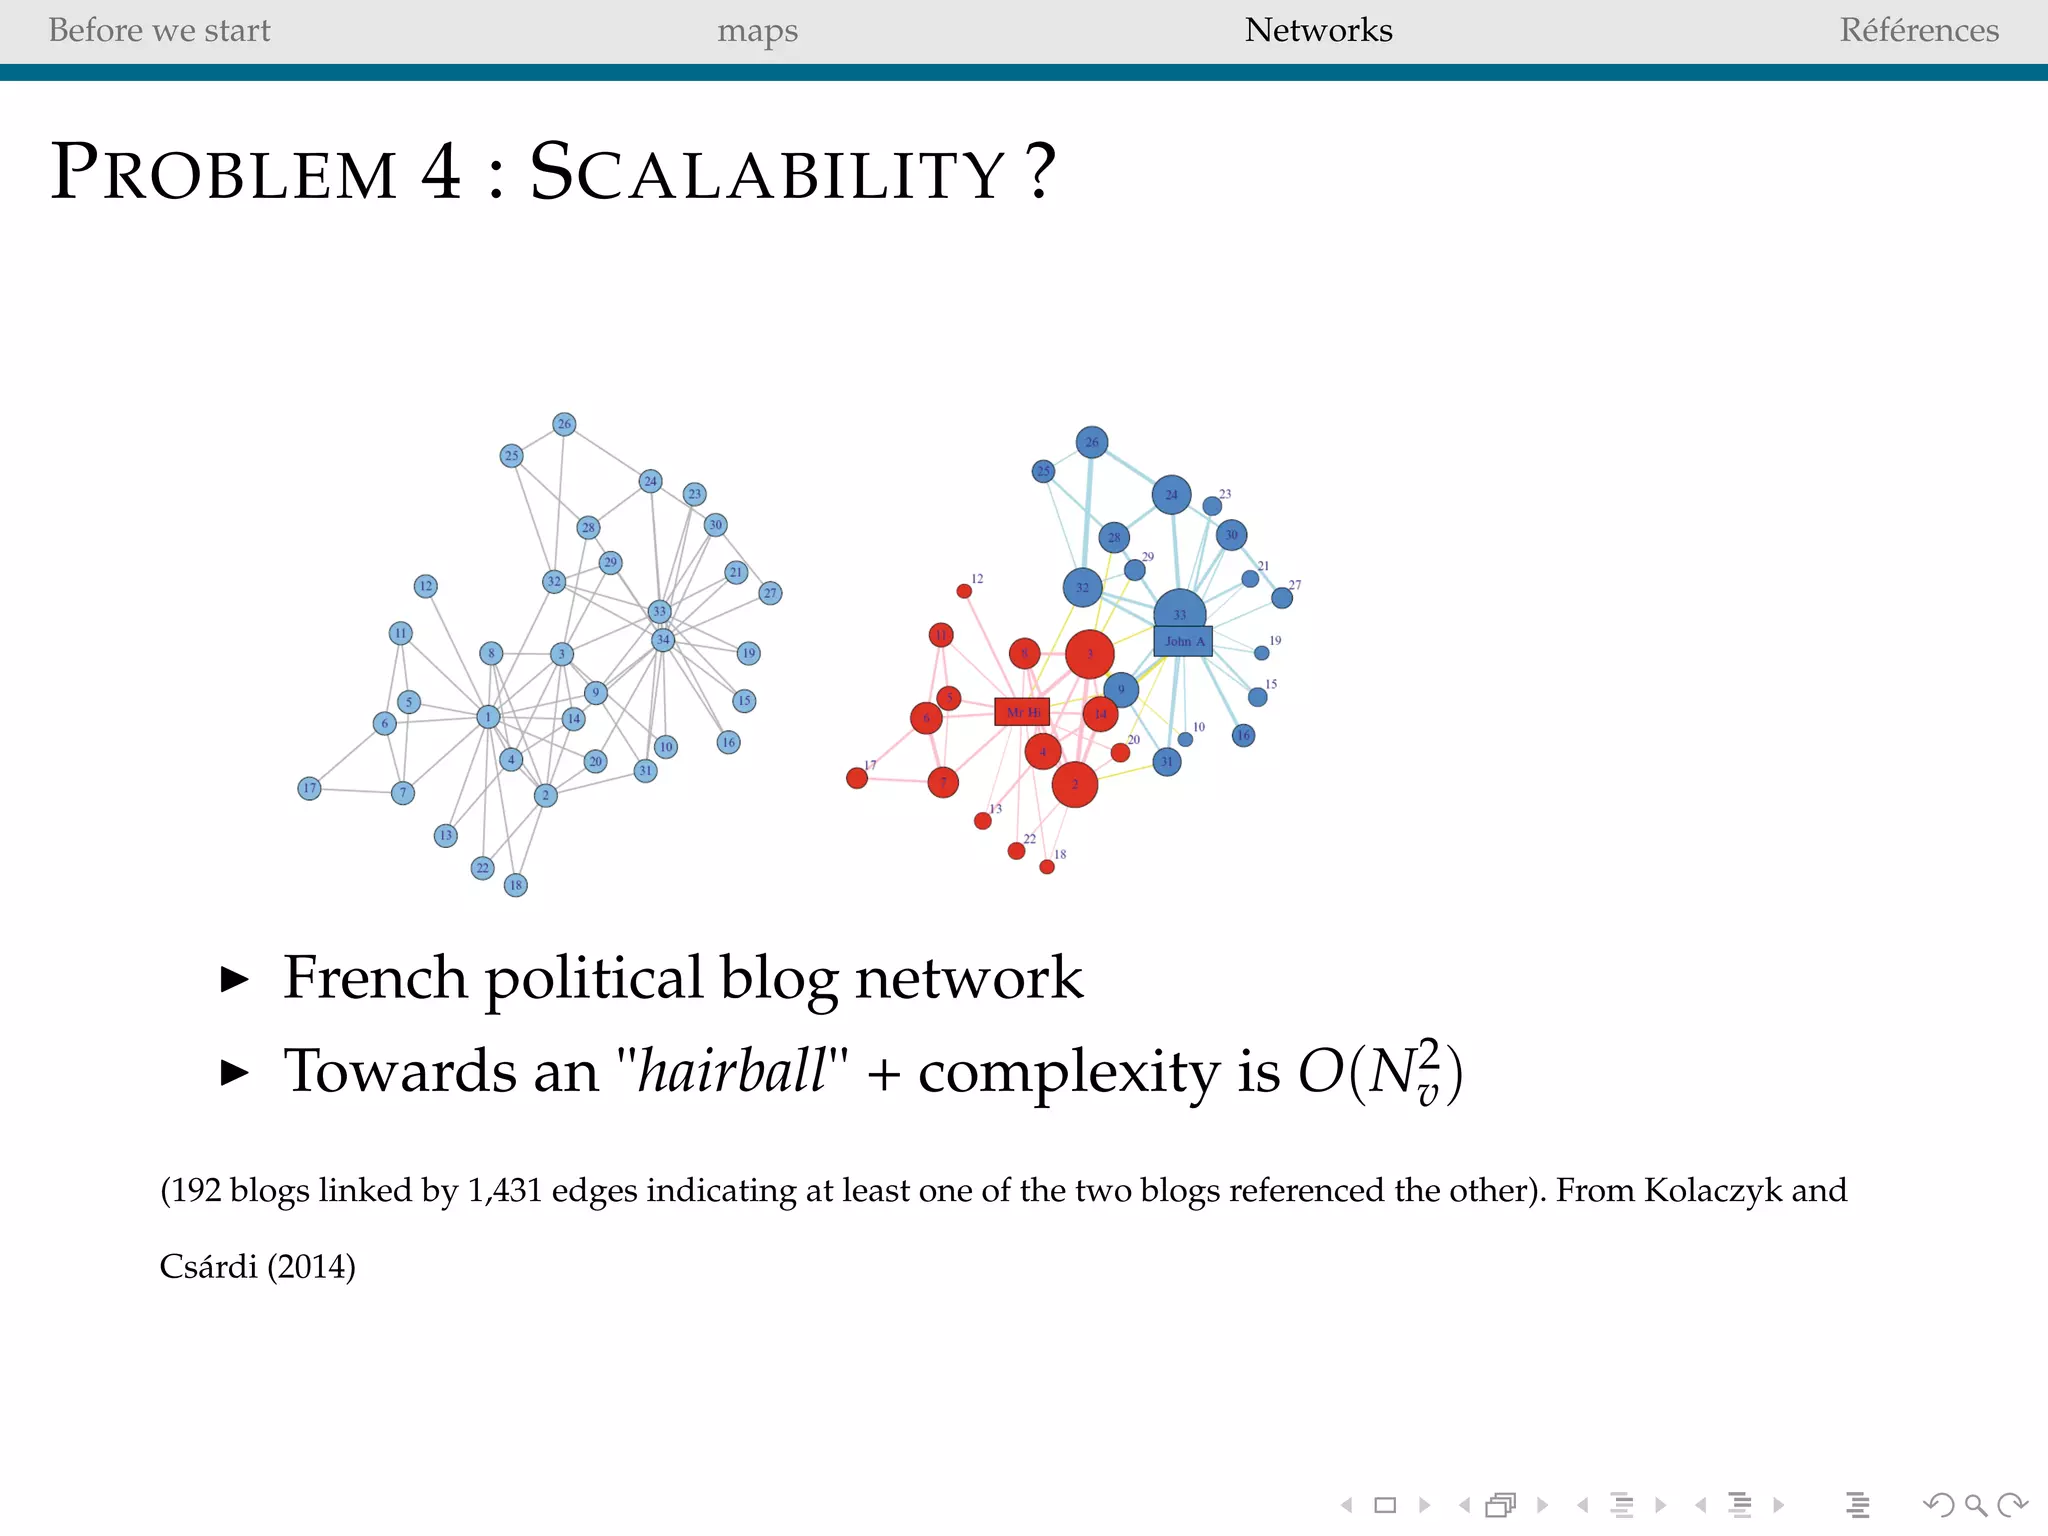
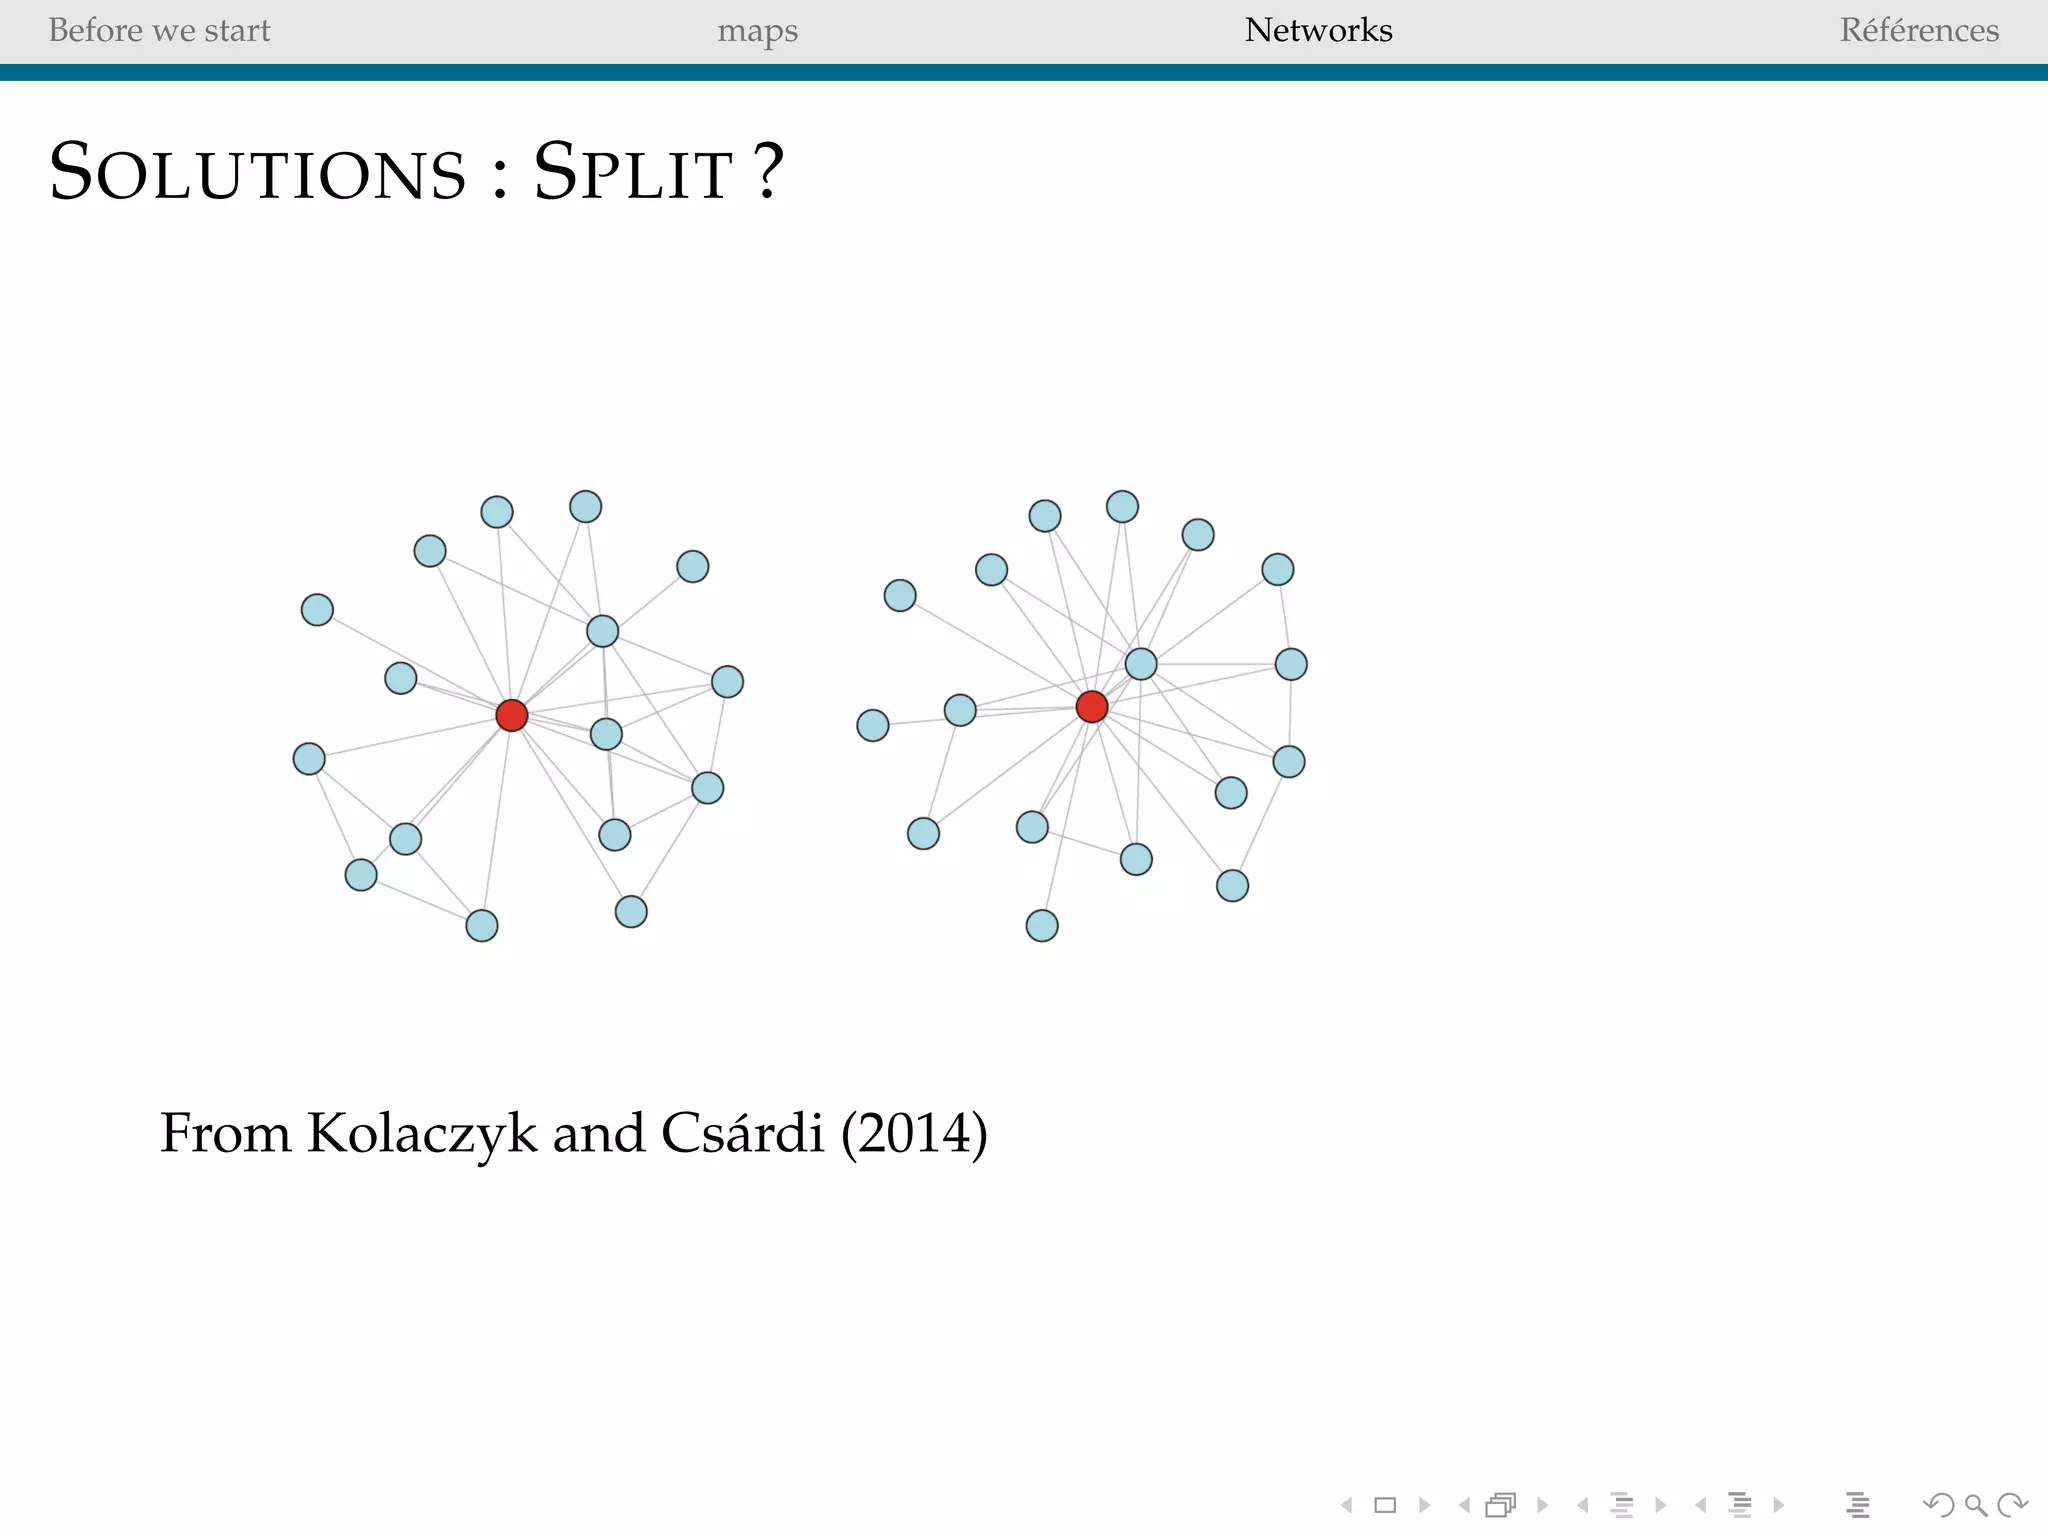
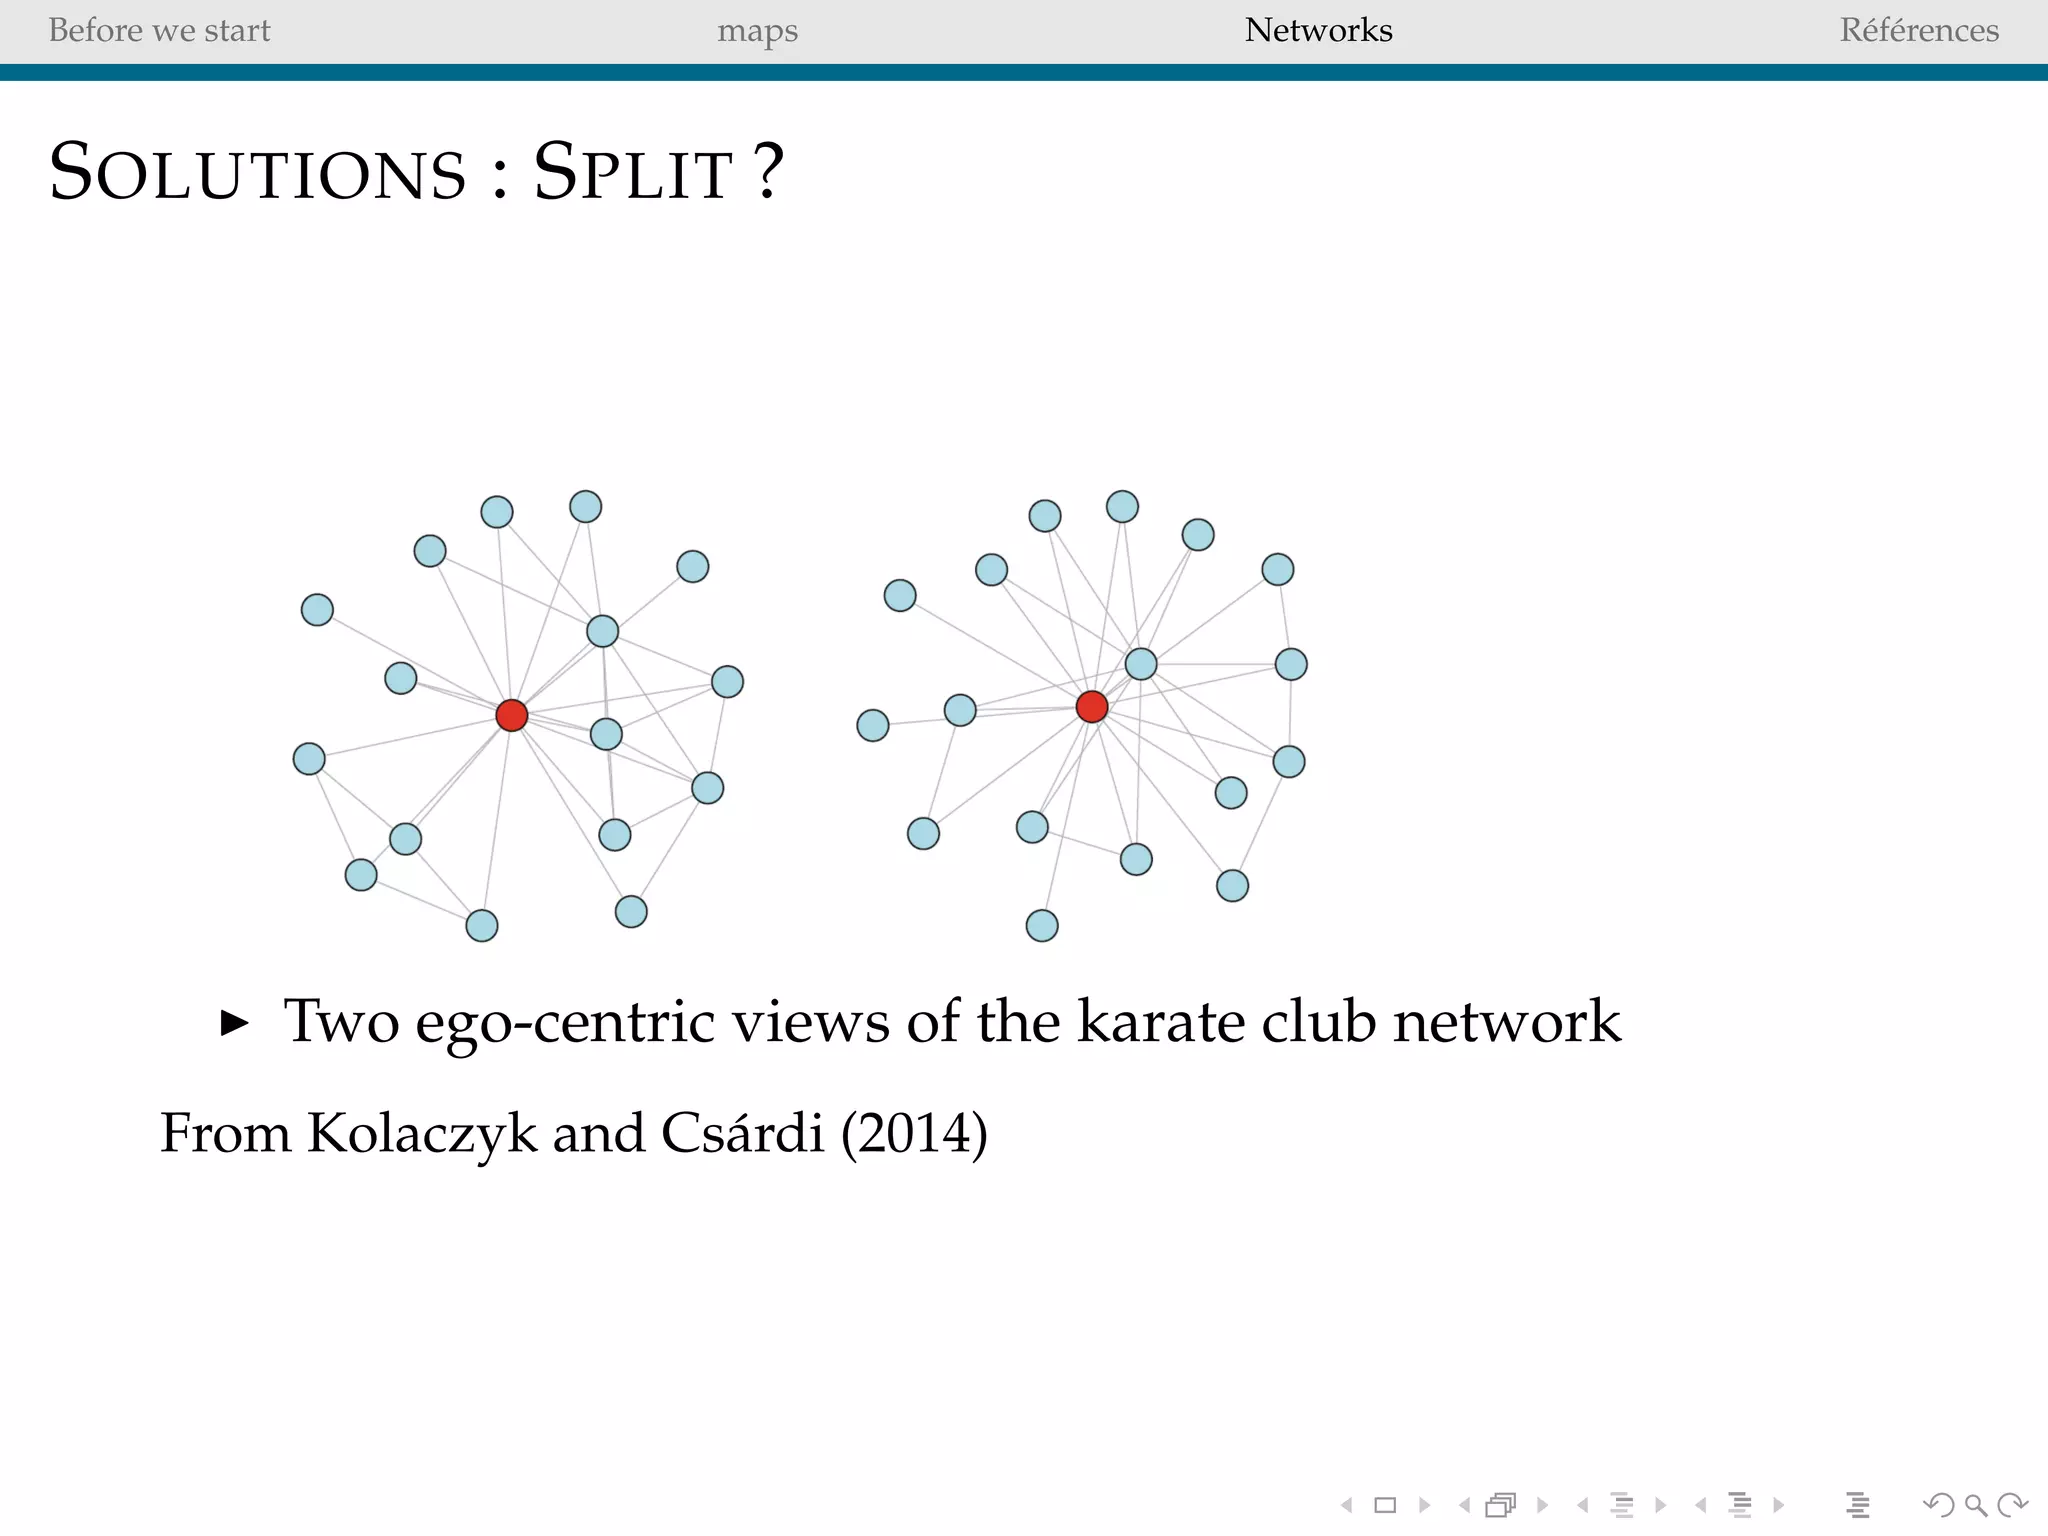
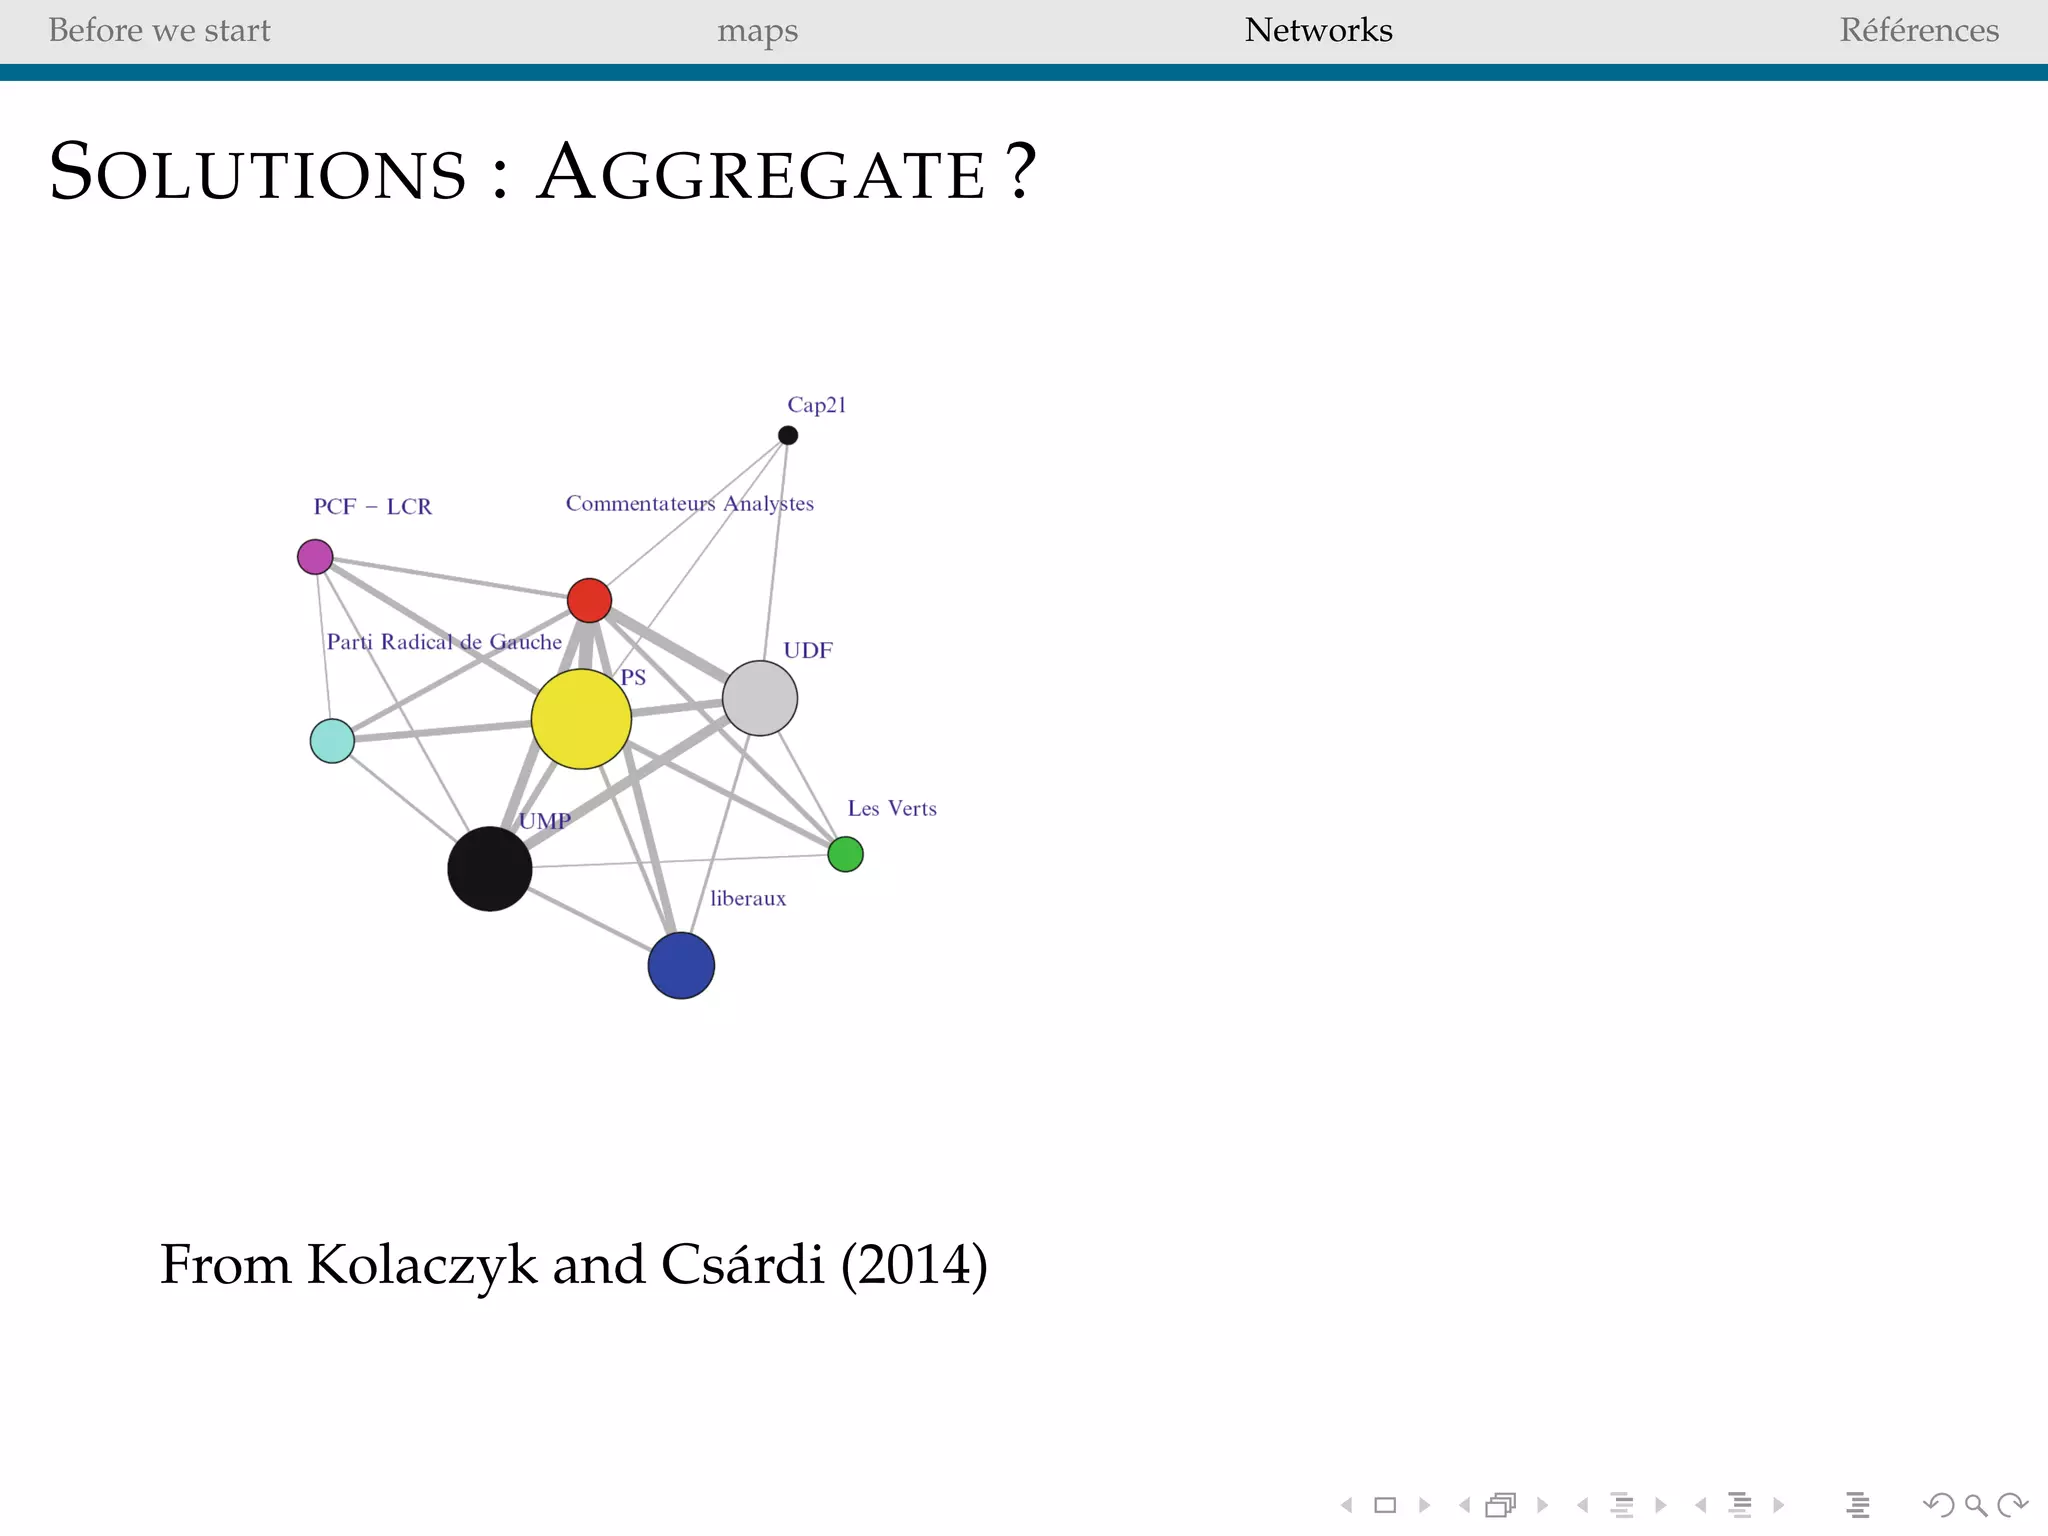
The document delves into the concepts of data visualization, focusing on its goals of data exploration and representation, and discusses how visuals can facilitate statistical comparisons and answer questions. It critiques common issues with map representations, especially in the context of election data, highlighting the potential for misrepresentation and complexity in statistical maps. Additionally, the document addresses the intricacies of network analysis, emphasizing the challenges of adequately representing relationships and the importance of clear visual rules.


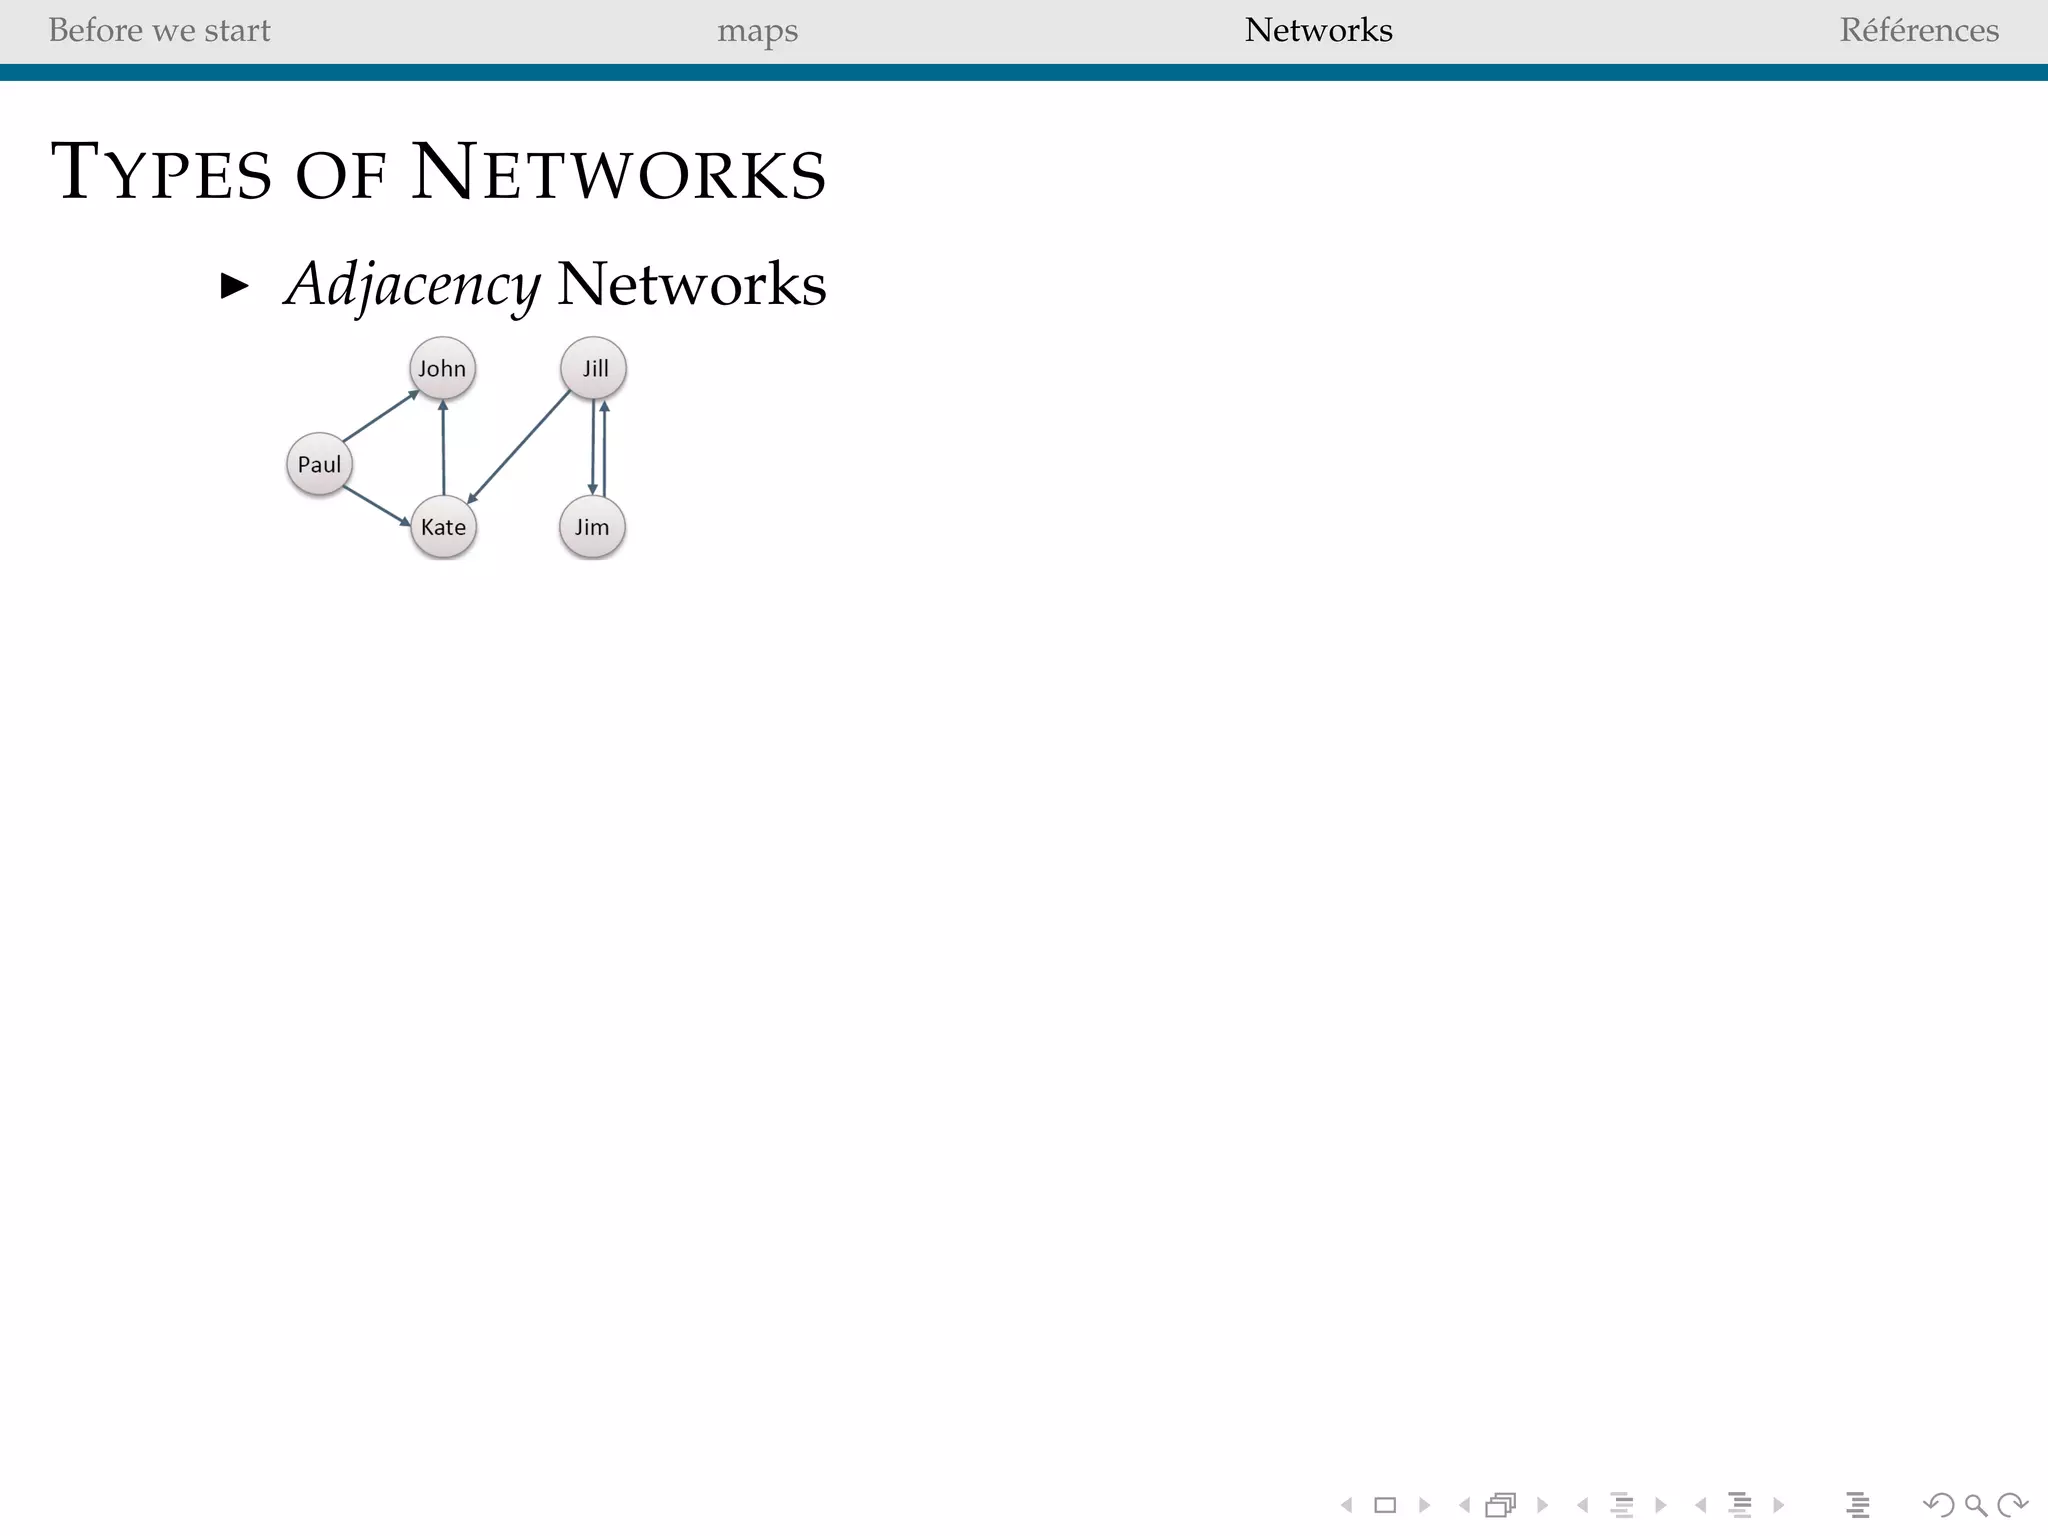
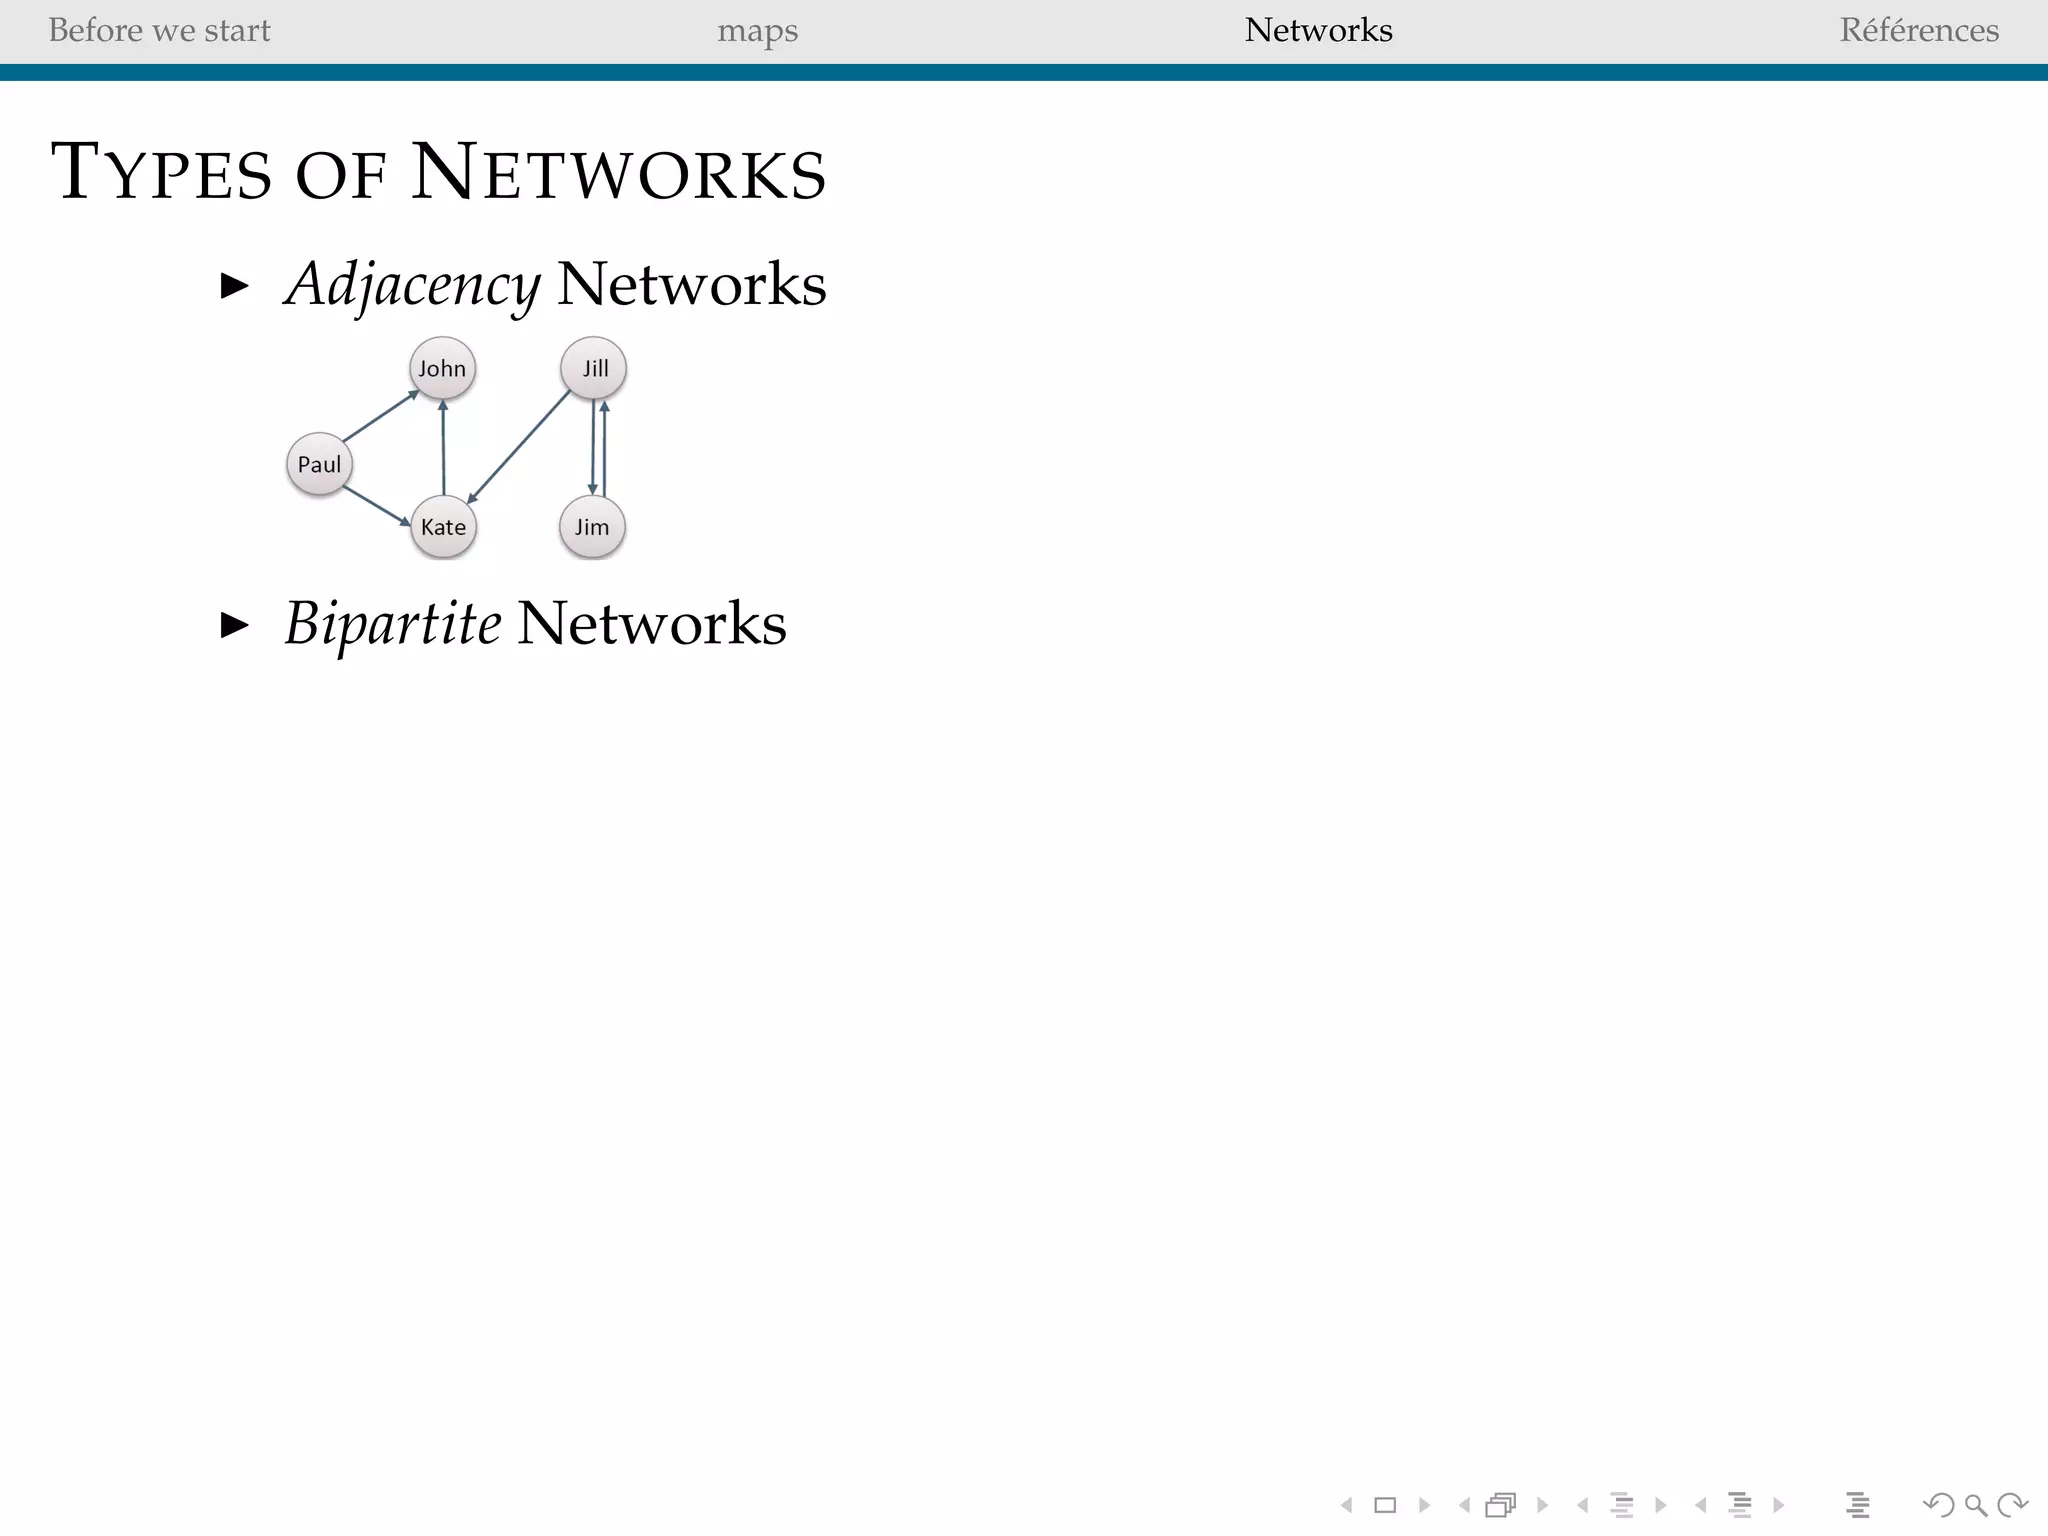
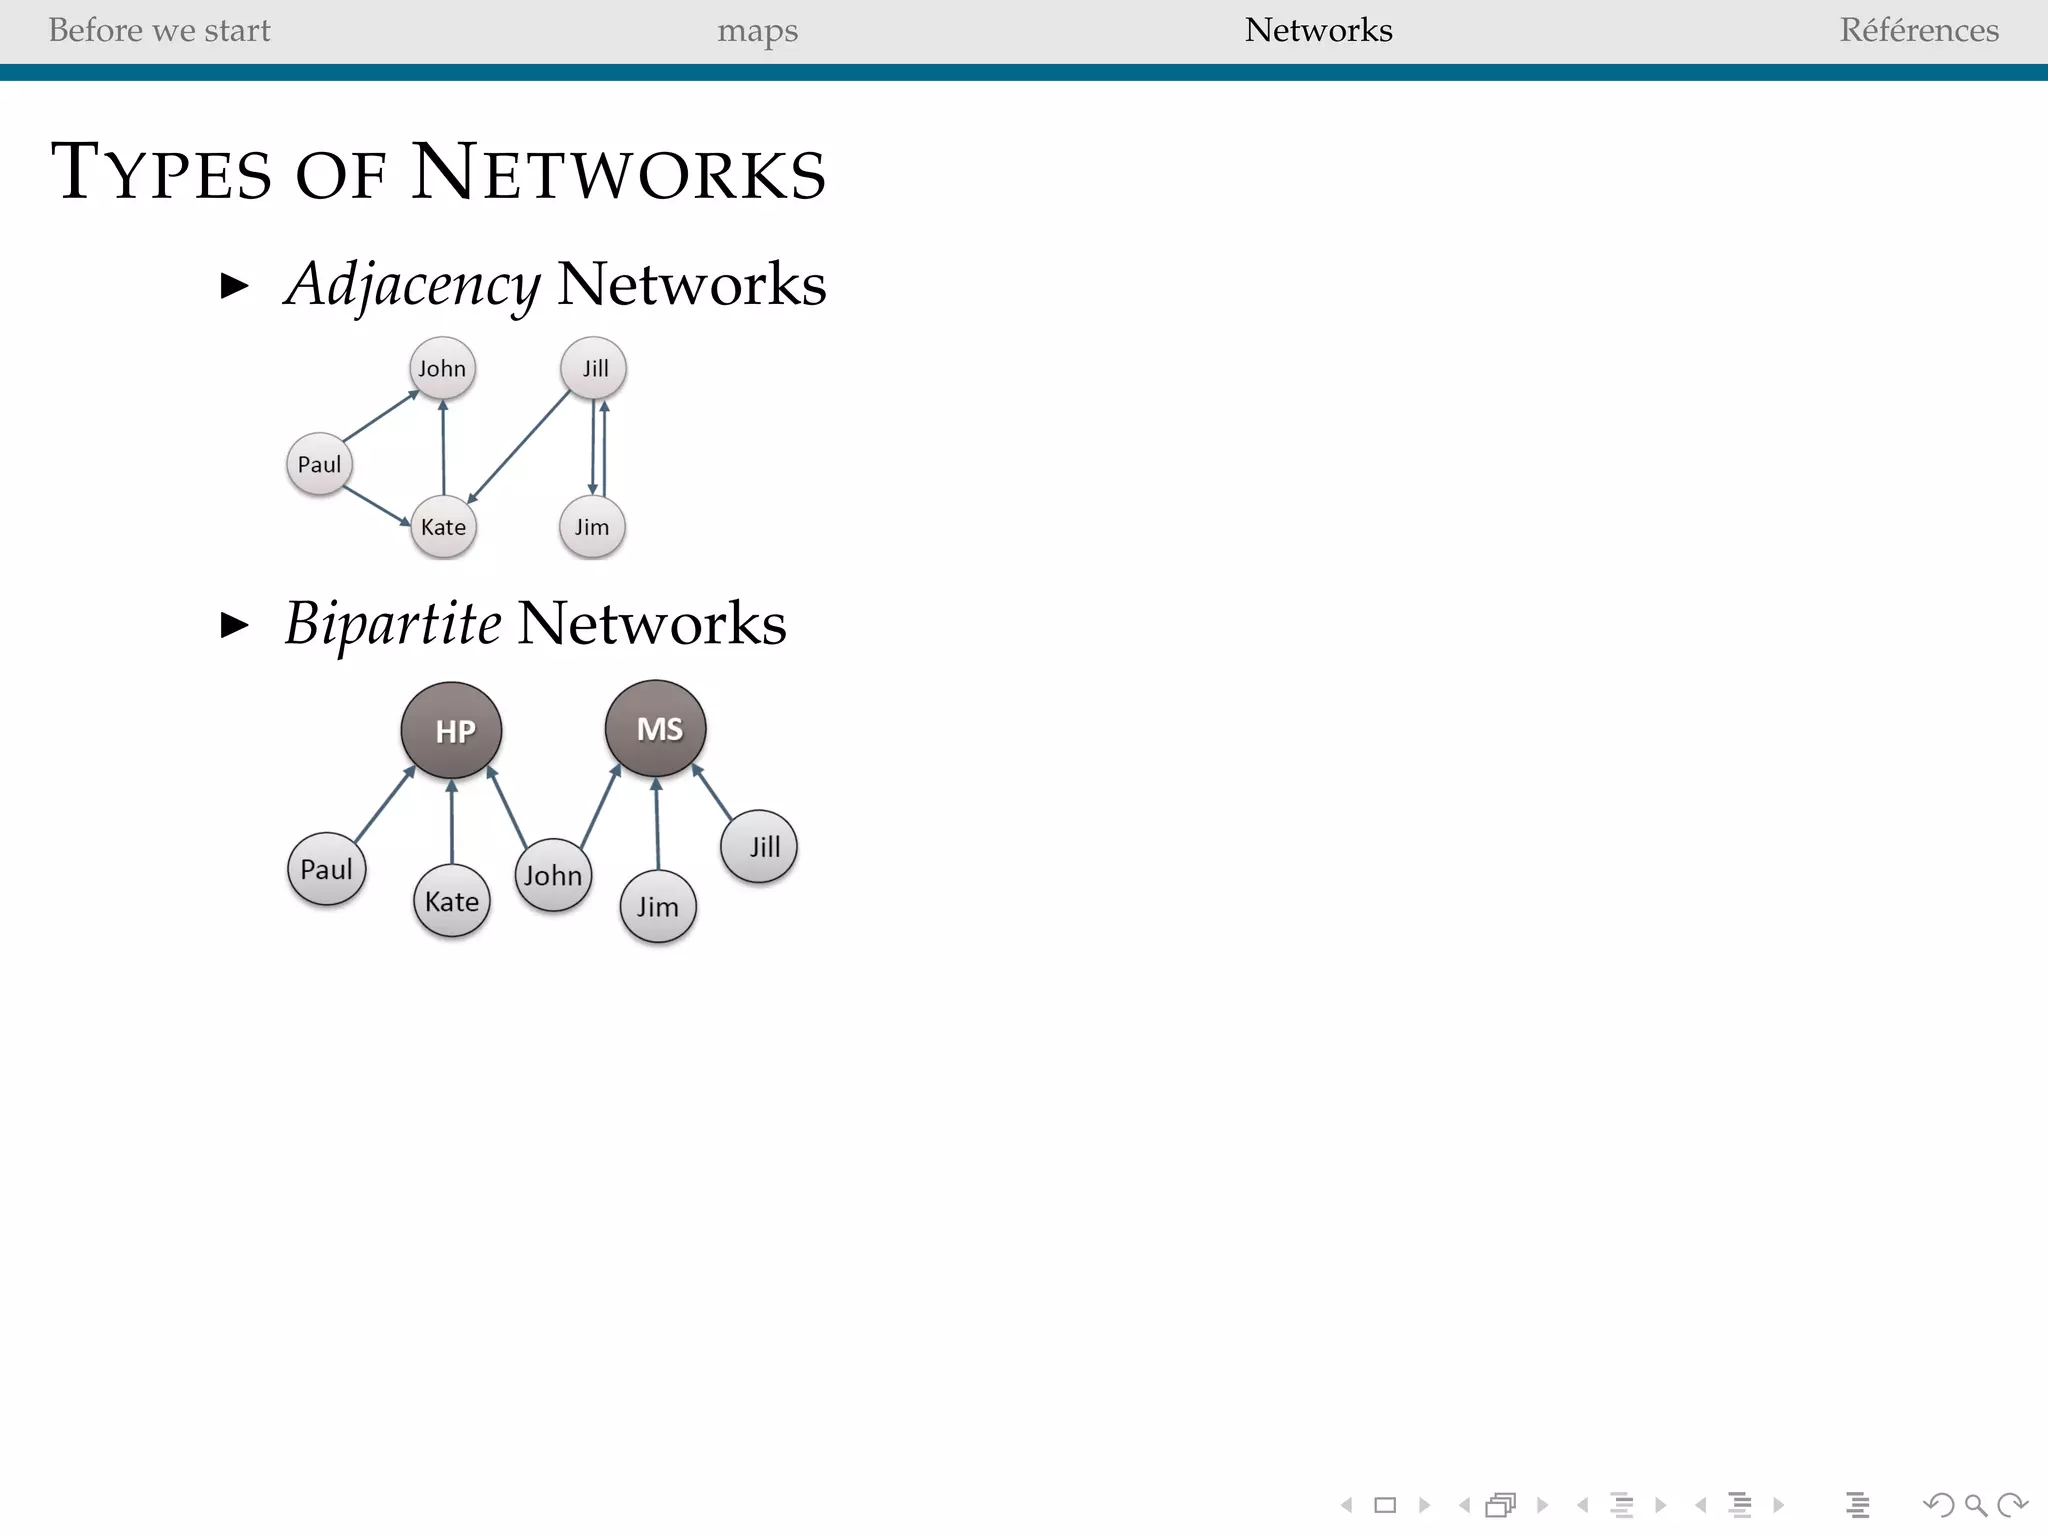
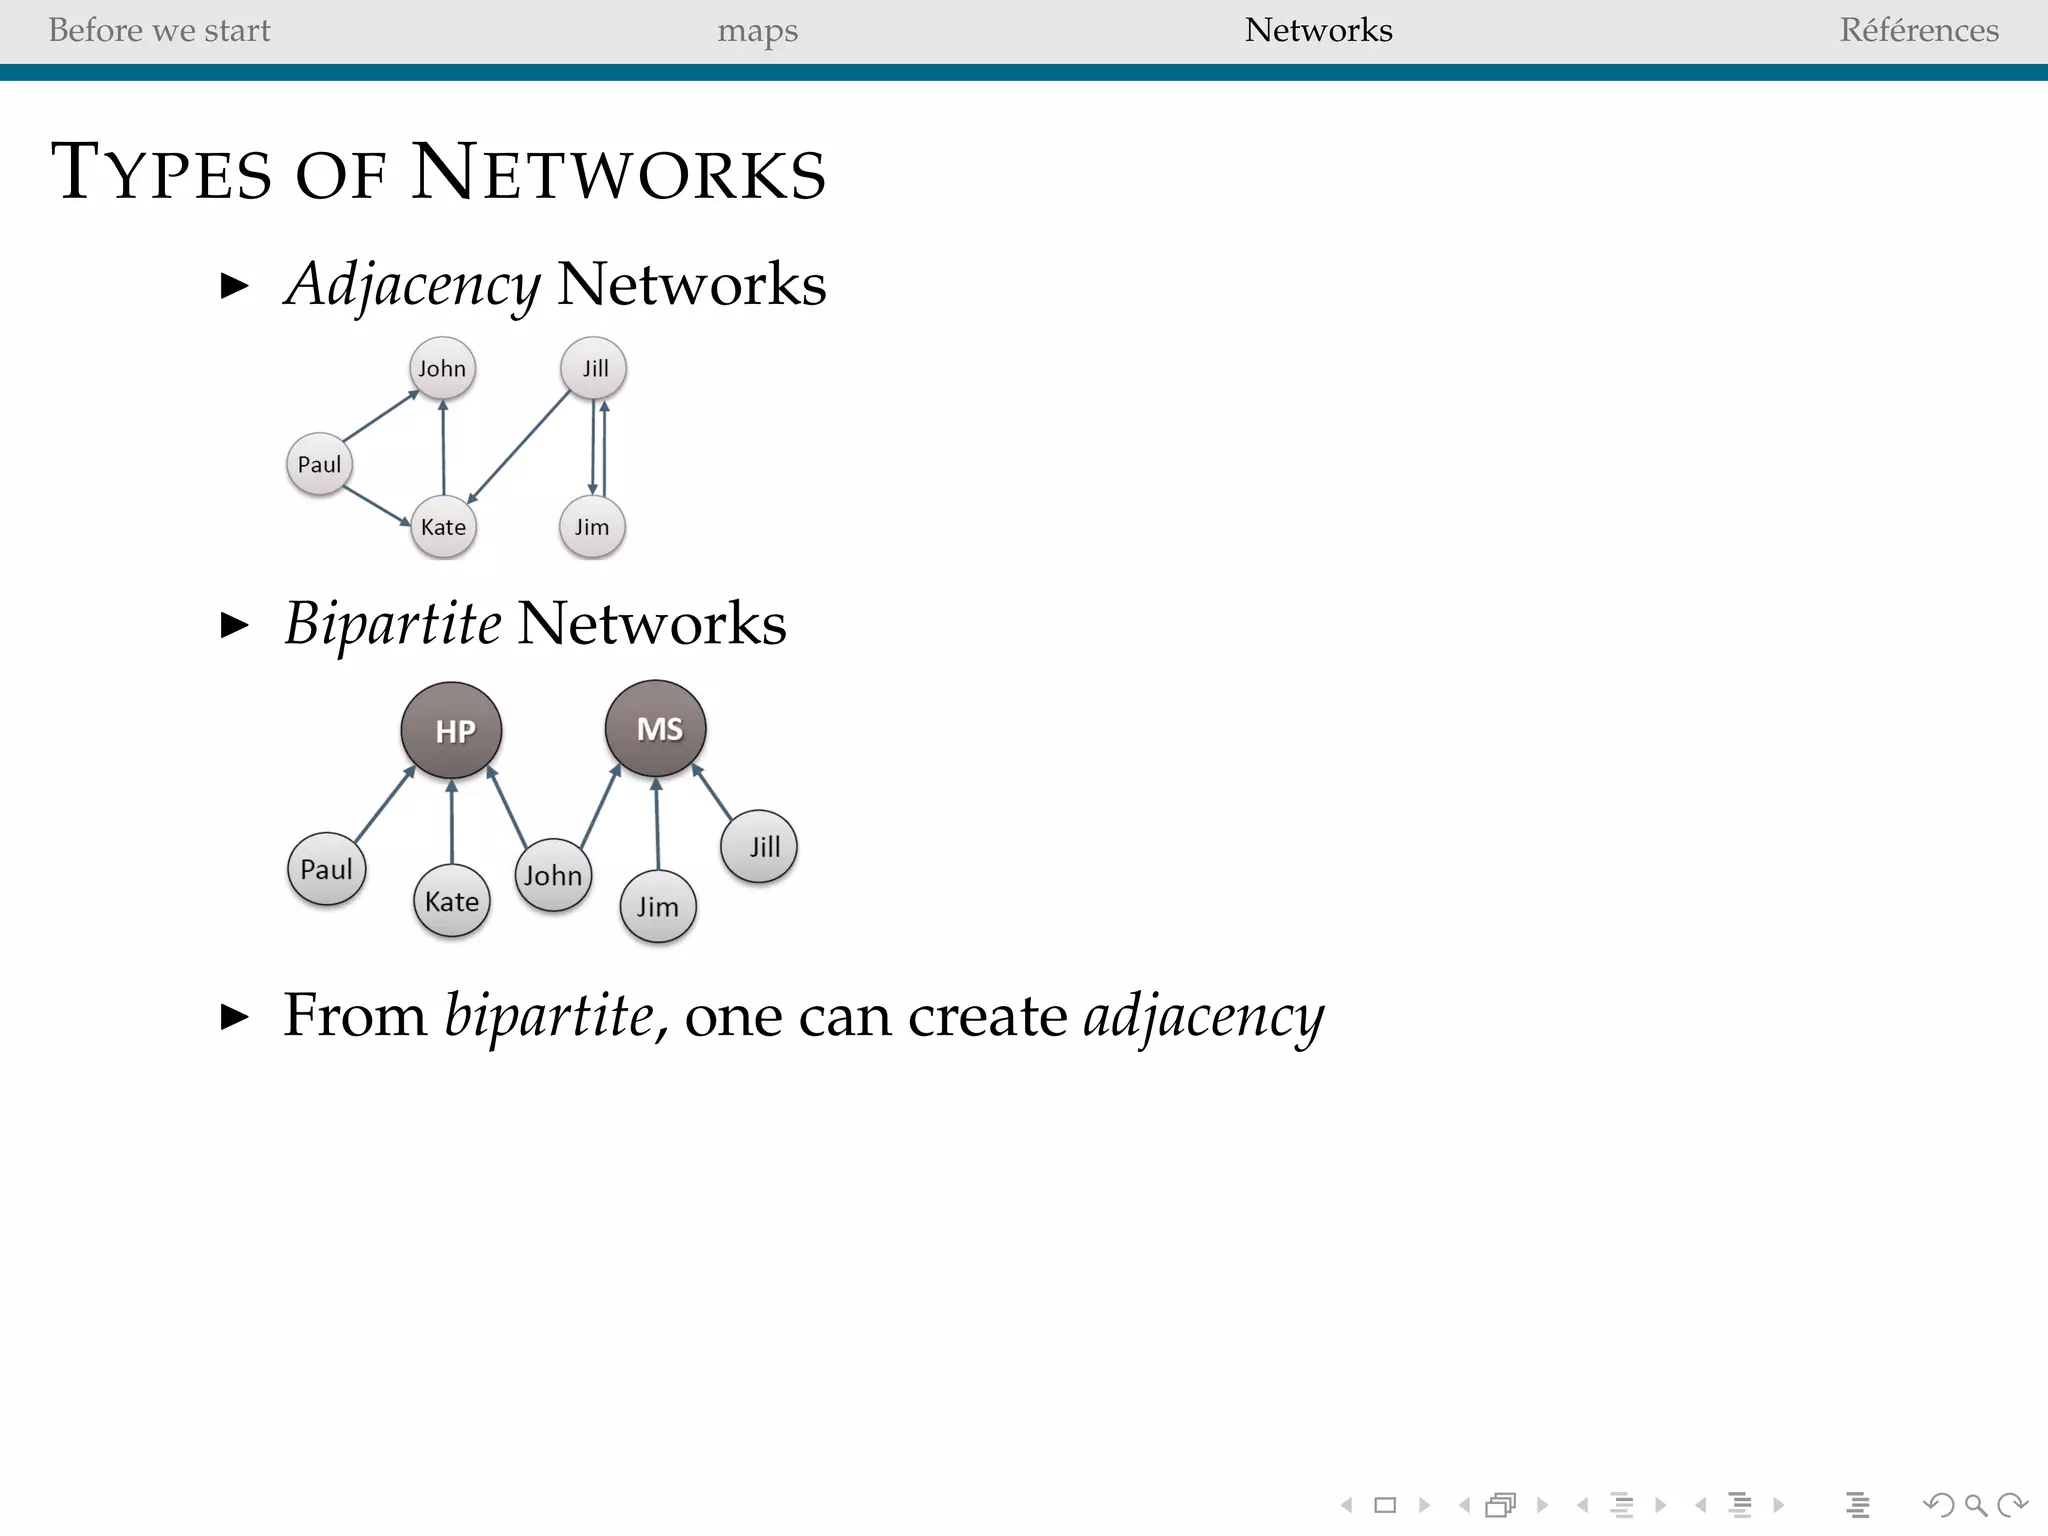
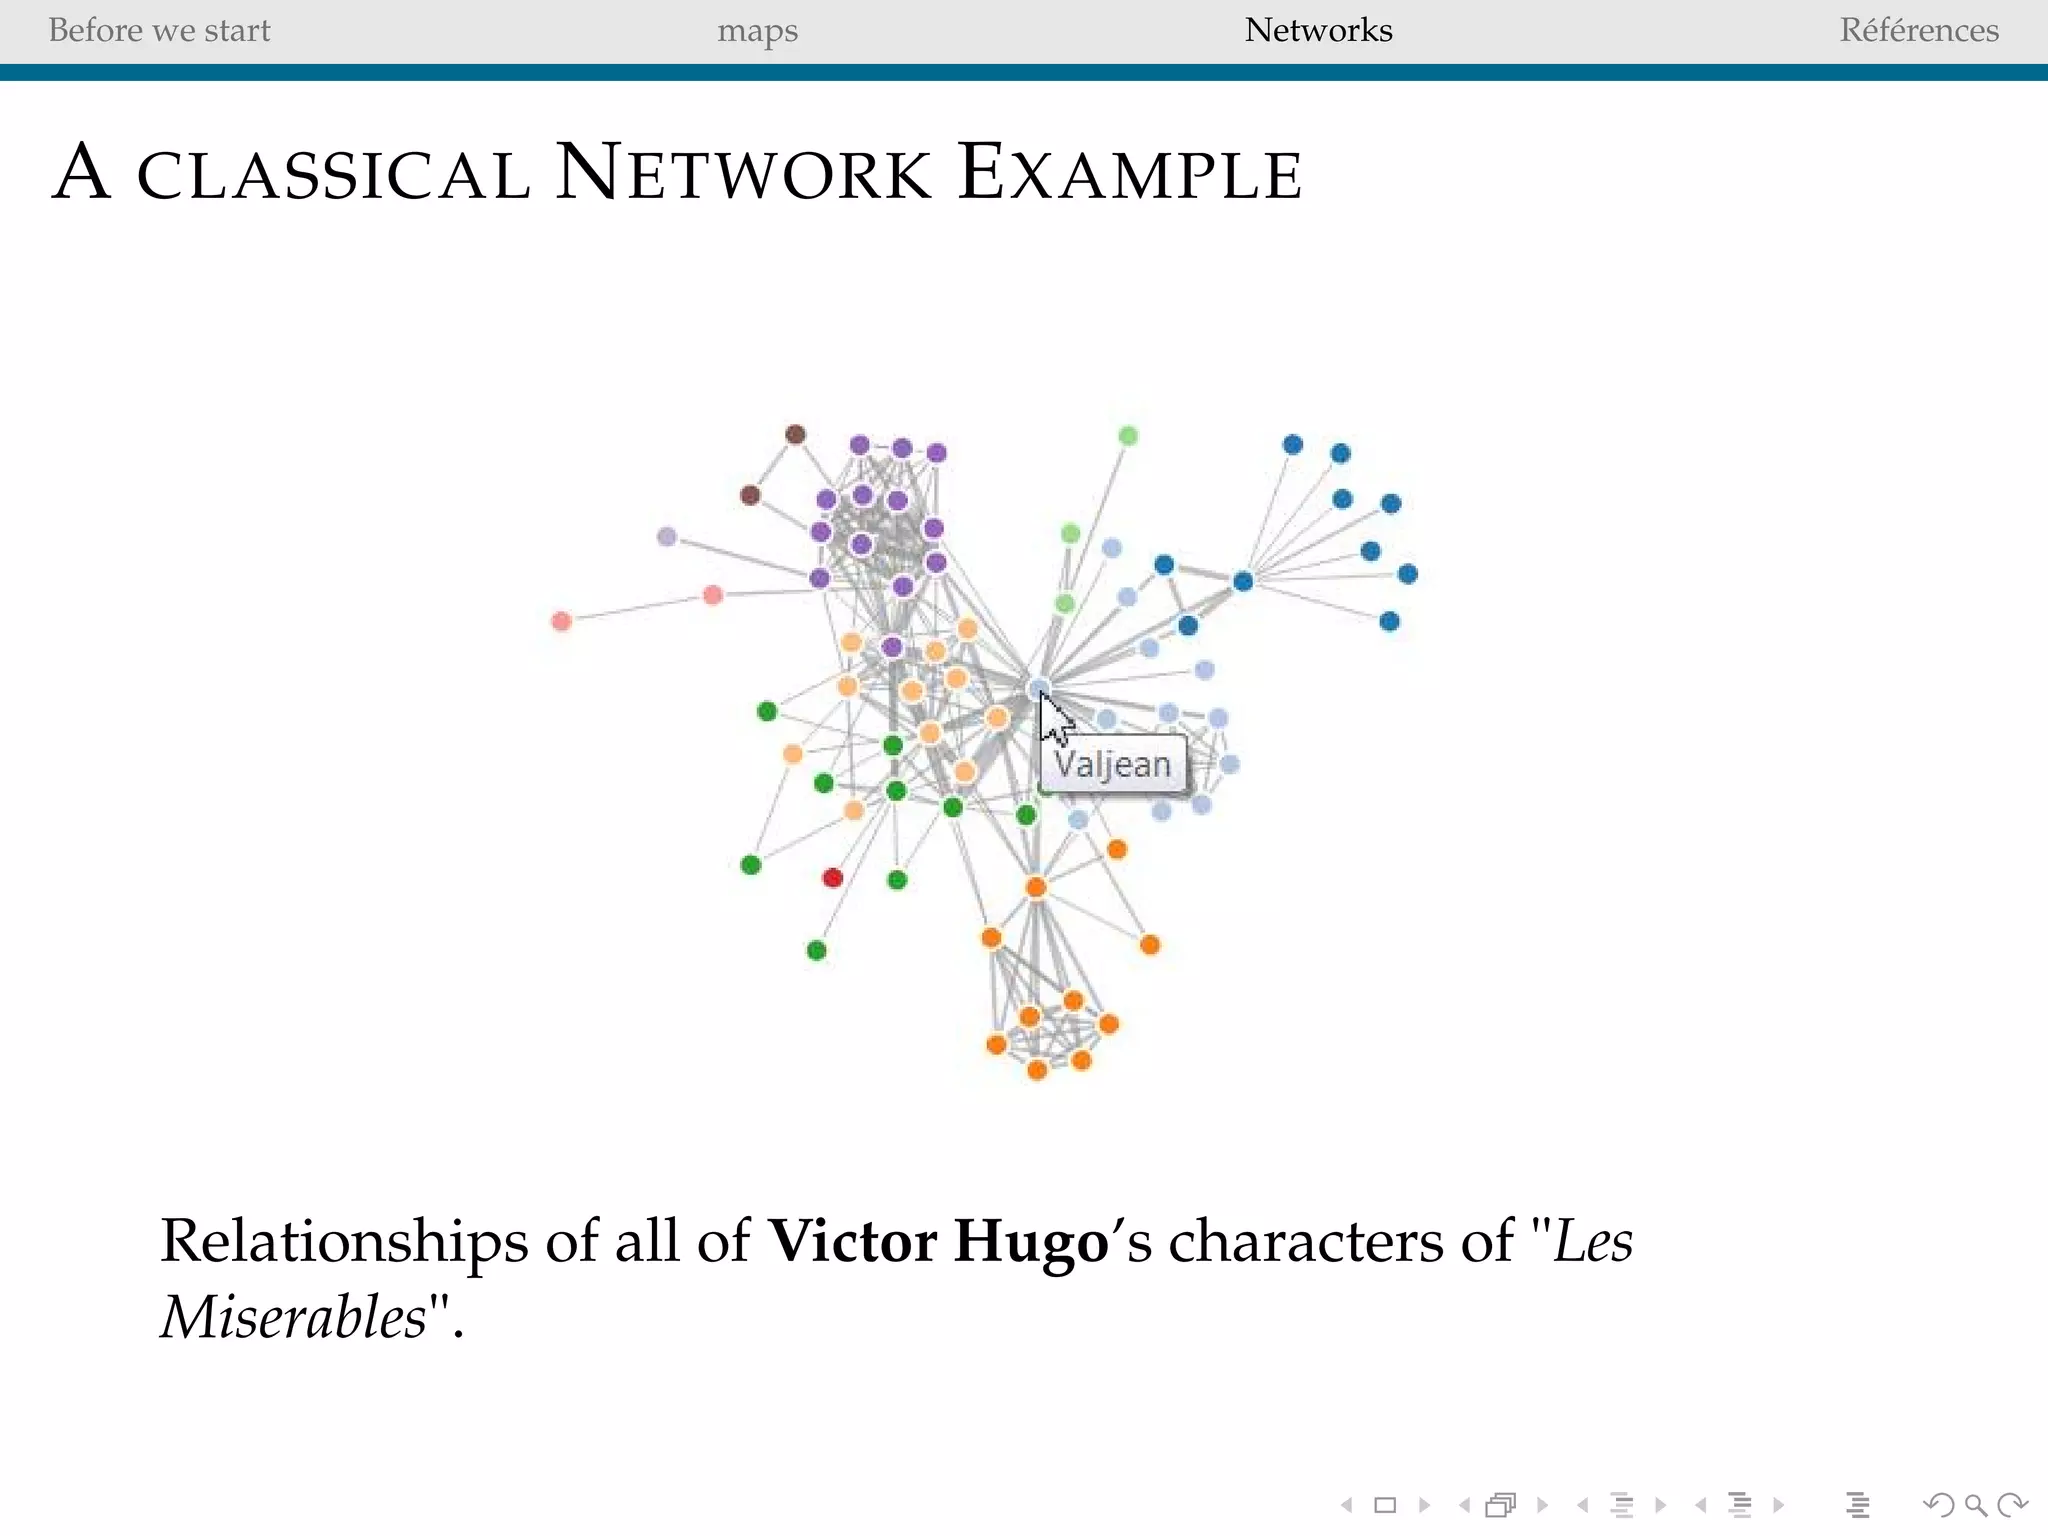


![ict_presentation_final_final_final[1].pptx](https://cdn.slidesharecdn.com/ss_thumbnails/ictpresentationfinalfinalfinal1-251230145259-2b4839bd-thumbnail.jpg?width=640&height=640&fit=bounds)


