1. The Cascadia Subduction Zone vs. Seaside
Having participated in school tsunami drills in Seaside, Oregon, the adequacy of practiced evacuation plans in the
event of a local earthquake along the Cascadia Subduction Zone (CSZ)—the fault along the West coast of the U.S. where
tectonic plates collide, building up extreme pressure—is lacking. The face of the land will change before anyone knows to
evacuate. And in light of the recent subduction-zone earthquake and tsunami in Tohoku, Japan, which was more deadly than
anticipated, the tsunami’s potential needs to be reevaluated also.
Because Seaside is a rather poor city, the best chance it has at a generally survivable evacuation plan is to
collaborate with privately-owned, large, new structures already in the area, whose building codes ensure a higher probability
that they will withstand an earthquake, and instruct people to run toward them in the event that they can’t quickly reach
higher elevations. This would require most of the population to run toward the ocean, where large hotels and parking
structures sit against the beach. However no one would follow such instructions without assertive publicity, especially
considering the high annual proportion of tourists.
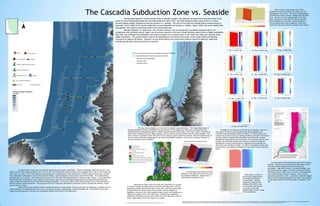
The figure above shows the city of Seaside against several tsunami possibilities. The last earthquake along the CSZ was in the
1700’s, and the only remaining evidence of it is in the rock record and Native American history, which suggests that it was 10 meters high and
took 4 days to recede. This by itself would be discomfiting news, looking above at the devastation a 10-meter tsunami would cause, but the
most comparable earthquake in recent history was the Tohoku, Japan earthquake, whose tsunami was 40 meters high. This would entirely
submerge the city of Seaside. The residents and tourists of the city would have approximately 15 minutes to get to safety. It’s also alarming
that the official city evacuation routes citizens are instructed to take often cross multiple bridges before reaching official destinations of
safety; bridges are notorious for structural failure during earthquakes. In this case, failure would trap the greater mass of the population to
face the tsunami without protection. And only one of the city’s evacuation destinations would even survive a tsunami like Tohoku’s, should
anyone make it to them.
Some landmarks are included as both a spatial reference for those familiar with the area and as an implication of danger; most of
these landmarks are trapped between two rivers, at an almost strategic disadvantage , should the bridges fail. The downtown area that’s
usually the most populous is directly west of Broadway Middle School and the fire department.
This map shows perspective on the basis for Seaside’s evacuation plans. The Oregon Department of
Geology and Mineral Industries (DOGAMI) has reported that a much bigger area needs to be evacuated than the
Federal Emergency Management Agency’s (FEMA) expected tsunami would imply. An 8-meter contour is included to
show where a moderate tsunami might inundate, but this model is still more drastic than the report by FEMA. A 40-
meter contour is included to show where the recent tsunami in Japan would have reached. Only the southernmost of
the evacuation destinations designated by the city meet DOGAMI’s standards, much less the necessary elevation to
escape a tsunami similar to Tohoku’s.
‘Developed & Urban’ land is the type most vulnerable to a tsunami
for several reasons: developed land has very poor drainage (water can’t be
absorbed by asphalt and concrete like it can by soil), and the concentration
of people allows for greater loss of life no matter what the disaster is.
Vegetation can also act as a buffer against tsunami waves, but Seaside has no
vegetation to guard it from this destruction. Planting more vegetation,
allowing for the growth of more forest within the city or between it and the
ocean, might greatly reduce the impact of a tsunami.
This is a basic 3-dimensional view of the
modeled fault used to estimate the impact of a CSV
earthquake on the surface. The fault is approximately
120 kilometers west of seaside, dipping under the West
coast. Because the exact dipping angle of the fault
plane and amount of slip that will take place during
the earthquake are not certain, several models of
vertical displacement were considered, which show
where the land would uplift and subside at the surface:
5˚ dip, 12 meter slip 10˚ dip, 12 meter slip 12˚ dip, 2 meter slip
12˚ dip, 5 meter slip 12˚ dip, 7 meter slip 12˚ dip, 10 meter slip
12˚ dip, 13 meter slip 12˚ dip, 15 meter slip 15˚ dip, 12 meter slip
Although all the scenarios of slip and dip are possible, a dip of 12˚
and a slip of 12 meters were considered the most predictable and
consistent with the greatest number of models. It is shown above with
contours for greater accuracy in reading subsidence and uplift. Paired with
the figure below, modeling where the West coast falls on the vertical
displacement graph (with a star on Seaside), we can predict that the area
of study will most likely subside (fall) around 1.5 meters in elevation.
Although this scenario would produce a magnitude 8.8 earthquake and
older structures will likely crumble, 1.5 meters of subsidence luckily does
not pose much more danger to Seaside than the tsunami would otherwise
inflict.
To the right is a model of
the horizontal displacement
the modeled earthquake
would produce. Because
Seaside lies along the 120
kilometer line of the X axis,
we can predict that Seaside
will ‘jump’ to the west
approximately 2 meters, along
with its subsidence
A 3-dimensional representation of the
subsidence and uplift that would result from
the modeled earthquake. Seaside lies at
120 kilometers along the X-axis.
The map above models liquefaction potential in the area
of study. Liquefaction is a phenomenon that makes certain
rock-types behave liquidly during the shaking of an
earthquake. High-density objects, including buildings, cars,
and sometimes even people, will sink into the ground while
low-density objects might ‘float’ to the top, such as gasoline
tanks at gas stations and septic systems. Loose sand is
especially susceptible to this. Liquefaction poses the biggest
concern about evacuating people to the large, new structures
on the beach instead of instructing them to evacuate to the
hills.
12˚ dip, 12 meter slip
Sources: Nationalmap.gov, web.pdx.edu/~jduh/seasidegis/shapefiles/main.php, spatialdata.oregonexplorer.info, dingo.gapanalysisprogram.com/landcoverv2/DownloadData.aspx, ir.library.oregonstate.edu/xmlui/bistream/handle/1957/9402/Tolson_Patrick_m_1975_Plate 2 Geology.jpg?sequence=2,
www.oregongeology.org/sub/publications/IMS/ims-010/Maps/images/seaside?liq.jpg, nationalatlas.gov, google earth, seismo.berkeley.edu/seismo/annual_report/ar99_00/node28.html, oregon.gov/dogami/earthquakes/coastal/ofr95-67.pdfCreated by C.S. Woolley of Brigham Young University-Idaho, mentored by Dr. J. Willis