This document discusses various accounting ratios used to analyze a company's financial performance and position. It defines ratios such as gross profit margin, net profit margin, current ratio, quick ratio, inventory turnover, receivables turnover, and payables turnover. For each ratio, the document provides the formula, what it measures, and what high or low values may indicate about the company's financial management and liquidity.
This PowerPoint helps students to consider the concept of infinity.
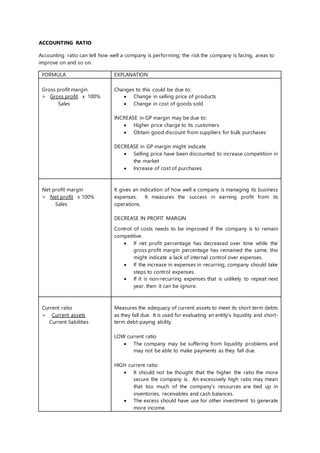
Accounting ratio
1. ACCOUNTING RATIO
Accounting ratio can tell how well a company is performing; the risk the company is facing, areas to
improve on and so on.
FORMULA EXPLANATION
Gross profit margin
= Gross profit x 100%
Sales
Changes to this could be due to:
Change in selling price of products
Change in cost of goods sold
INCREASE in GP margin may be due to:
Higher price charge to its customers
Obtain good discount from suppliers for bulk purchases
DECREASE in GP margin might indicate
Selling price have been discounted to increase competition in
the market
Increase of cost of purchases
Net profit margin
= Net profit x 100%
Sales
It gives an indication of how well a company is managing its business
expenses. It measures the success in earning profit from its
operations.
DECREASE IN PROFIT MARGIN
Control of costs needs to be improved if the company is to remain
competitive.
If net profit percentage has decreased over time while the
gross profit margin percentage has remained the same, this
might indicate a lack of internal control over expenses.
If the increase in expenses in recurring, company should take
steps to control expenses.
If it is non-recurring expenses that is unlikely to repeat next
year, then it can be ignore.
Current ratio
= Current assets
Current liabilities
Measures the adequacy of current assets to meet its short term debts
as they fall due. It is used for evaluating an entity’s liquidity and short-
term debt-paying ability.
LOW current ratio
The company may be suffering from liquidity problems and
may not be able to make payments as they fall due.
HIGH current ratio
It should not be thought that the higher the ratio the more
secure the company is. An excessively high ratio may mean
that too much of the company’s resources are tied up in
inventories, receivables and cash balances.
The excess should have use for other investment to generate
more income.
2. Quick ratio/ Acid test ratio
= Current assets – Stock
Current liabilities
Quick ratio does not include the closing inventory in the calculation of
current assets. Inventory is omitted because it is considered to be
relatively difficult to convert into cash in short period of time.
This ratio should ideally be at least 1:1. If quick ratio has fallen
below 1, the business clearly has cash flow problem. It may
not be able to pay off its debts as they become due.
If low quick ratio but high inventory level, this might indicate
that the company has poor inventory control, it might be that
some of the inventory is unsellable/ slow moving.
Inventory turnover
= Ave. stocks x 365 days
Cost of sales
OR
= Cost of sales
Ave. stocks
In DAYS
This measures the average number of days it takes to sell the
inventory. It gives a general indication on the efficiency of
management in controlling inventory level.
In TIMES
Inventory turnover measure the number of times inventory is
replenished in an accounting period. This measures the number of
times on average the inventory is sold during the period; measures the
liquidity of the inventory.
HIGH inventory turnover
Lengthening inventory period from one to the next
accounting period indicates slowdown in trading or build-up
in inventory levels
Greater risk that goods will perish or become obsolete
It is not advisable for an entity to have too much inventory
because
Inventory takes up costly warehouse space
Some items may become spoiled or obsolete
Working capital is tied up
LOW inventory turnover
Shorter turnover period is better as less money is tied up and
this indicates that inventory is converted into cash more
quickly to realize profits.
If the inventory turnover ratio has fallen suggesting that there
may be some
Inventory control problems
Changing the mix/type of goods it sells resulting in
different turnover ratio
Slowdown in trading
3. Receivables turnover
= Ave. receivables
Credit sales
x 365 days
The trade receivable collection period measures how long it takes the
trade receivable of a firm to settle the amount owed by them. It
provides an indication of how successful (or efficient) the debt
collection process has been
The ratio is used to assess the effectiveness of an entity’s
credit and collection policies.
The general rule is that the collection period should not
greatly exceed the credit term
LONGER collection period
Collection period that increases over time or is high relative
to industry indicates that some account receivables are
delinquent or uncollectible or weak credit control
The slower collection of receivables will be contributing to the
poor liquidity situation. The business may be giving
customers more credit in order to sell more inventories
SHORTER collection period
Improve cash flows
Liquidity will improve and bad debt reduced
Shorter receivables collection period can indicate procedures
are needed to be tightened up, which would help to improve
the business’ liquidity situation
Payable turnover
= Ave. payables
Credit purchases
x 365 days
The trade payable collection period measures how long it takes to pay
the trade payables in a firm
LONGER collection period
A rising trend may indicate lack of cash resources therefore
requiring longer credit periods and there may be a danger of
further or renewed credit being refused by suppliers.
SHORTHER collection period
If payables period decrease, this suggest that the company is
paying suppliers more quickly. This will have an adverse
impact on the cash flow position, unless discount are being
received for early payment.
A low ratio may show that suppliers are tightening up their
credit terms or discounts provided for early payments.