2. reporting purposes.
However, having
timely, relevant cost
information is essen-
tial for profitability
analysis and strategic
planning. Consider
the following story. A
few years ago, after
implementing a more
detailed costing sys-
tem, Nestlé SA Chief Executive
Peter Brabeck made an unex-
pected and alarming discovery:
His company was produc-
ing 130,000 variations of its
various brands, and 30 percent
weren’t making money.1 Exces-
sive focus on variable costs and
spare capacity led to the con-
clusion that many new products
were “profitable” and long-
term winners. Nestlé’s margins
were lower than competitors,
however, which strongly sug-
gested that these seemingly
“profitable” products were
actually decreasing firm profit.
Careful consideration of the
cost and profitability analysis
provided by its new sophis-
ticated Enterprise Resource
Planning (ERP) system led
Nestlé to jettison weaker
brands, consolidate product
3. offerings, and make significant
adjustments in strategic direc-
tion. As Nestlé discovered,
selecting the correct product
costing system for strategic
decisions can be challenging
but is essential in guiding firm
strategy. The wrong system can
lead to faulty strategic deci-
sions with disastrous results.
We have found that many
firms underinvest in their
product costing systems. But
if improvements in product
cost accuracy would lead to
different decision out-
comes, then the cost
of improving the cost
system becomes a stra-
tegic investment rather
than an unfavorable
spending variance.
While managers realize
the problems caused
by relying on flawed
cost information, it is
challenging to identify
the appropriate cost
system. Complicating
the task is the fact that
different strategic deci-
sions call for different product
costs. The purpose of this article
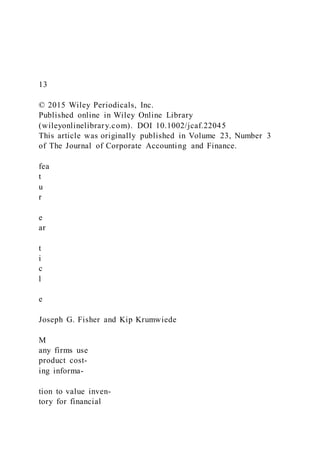
6. PRODUCT COST DESIGN
Unfortunately, the myriad
approaches to product costing
and choices available can inhibit
a systematic design approach. In
selecting a product cost system,
a firm needs to answer four key
questions:
1. Which costs should be
included in product cost?
2. At what level of detail
should we track direct
product costs?
3. How do we organize indirect
product costs?
4. How do we allocate indirect
costs to products?
Addressing these ques-
tions will help guide system
selection. Understanding the
desire more accurate product
costing systems but have trouble
justifying the cost. We have also
found, however, the cost infor-
mation philosophy to be quite
different in Europe. One Ger-
man controller of a company
with a very detailed costing
system expressed a commonly
7. held view when he said, “How
can you not have this level of
detail?” The benefits of a supe-
rior costing system are real but
hard to quantify in return on
investment (ROI) calculations,
and implementation costs can
seem onerous. In general, it is
difficult to quantify all benefits
prior to system implementation.
Improving a cost system should
be approached as a strategic
investment.
ASSESSING YOUR CURRENT
SYSTEM
So how do you know if you
have a satisfactory system? We
recommend assessing your cur-
rent system against three dimen-
sions:
• Convenience: how conve-
nient is it to get the cost
information needed?
• Correctness: are the current
product costs reasonably
accurate?
• Costs of implementation:
are the costs of implement-
accepted accounting principles
8. (GAAP) and International
Accounting Standards (IAS)
require the determination of
the cost of goods sold or ser-
vices performed for financial
reporting. Financial accounting,
however, does not require a high
level of accuracy or relevance for
product costing—the method
simply needs to be systematic
and reasonable. Second, prof-
itability assessment is a key
component of strategic analysis.
Many important strategic deci-
sions are made at the product-
line level. For almost any firm
producing a large and diverse set
of products in different facili-
ties and countries (e.g., Nestlé),
product profitability helps
guide product portfolio
decisions. Third, product
costing systems can help
in cost and operational
control.
Unfortunately, given
diverse demands on cost
information, there is no
single system that meets
every reporting and stra-
tegic need. Additionally,
different operational
settings call for different
costing approaches. A system
that is appropriate for a Nestlé
10. 1. Which costs should be included in product cost?
hgiHwoL
Throughput
Costing
Variable
Costing
Full Absorption
Costing
Life-Cycle
Costing
2. At what level of detail should we track direct product costs?
ecruoseRboJ
Job
Costing
Operation
Costing
Value Stream
Costing
Process
Costing
Resource
Consumption
Accounting
11. 3. How do we organize indirect product costs?
xelpmoCSimple
Plantwide
Cost Pool
Department
Cost Pools
Time-Driven
ABC
Activity-Based
Cost Pools
Detailed
Cost Centers
4. How do we allocate indirect costs to products?
xelpmoCSimple
Volume-
Based
Drivers
Transaction-Based
Drivers
Duration-Based
Drivers
Intensity-
Based
12. Drivers
Exhibit 1
Which Costs Should Be
Included in Product Costs?
The first question relates
to product cost definition. As a
starting point, full absorption
costing includes all manufactur-
ing costs as product costs; it is
most commonly used in practice,
and it is mandated by GAAP for
financial reporting. However, it
may be insufficient since it only
includes certain costs: direct
materials, direct labor, and some
reasonable allocation of vari-
able and fixed overhead. Other
direct costs are not included.
For example, a 2 percent tariff
on every candy bar sold is as
much a cost of selling a product
as the ingredients that went into
it. Yet this cost would not be
included in full absorption cost.
Nor would absorption costing
include other relevant nonmanu-
facturing costs—such as R&D,
sales, support, and distribu-
tion—in product costs. Includ-
ing full manufacturing costs can
lead to unnecessary inventory
buildup since fixed overhead
13. (i.e., capacity) costs are capital-
ized in inventory and not imme-
diately expensed on the income
statement. In addition, this cost-
ing approach mixes variable and
fixed costs, which makes it dif-
ficult to determine cost behavior
when making product decisions.
The question of what to
include in product cost is chal-
lenging, since there are many dif-
ferent cost categories that may
be considered. Exhibit 2 presents
several cost models along with
typical cost inclusions. Any com-
bination of costs, however, may
be included in product costs.
Throughput costing includes
only direct materials in product
costs. This model (which dis-
courages inventory buildup since
fixed costs cannot be capitalized
into the inventory account) is
Levels of Product Costing Completeness
Types of Cost
Direct materials
Direct labor
Variable factory overhead
Fixed factory overhead
Nonfactory costs (sales, admin, distribution)
R&D, design, customer service, disposal
Throughput
15. Variable costing includes all
variable manufacturing costs.
This methodology is more
appropriate when variable costs
are significant and a key com-
ponent of total cost. Although
not allowed for GAAP due to
immediate expensing of fixed
overhead, the use of variable
costing can discourage buildup
of inventories since fixed pro-
duction costs are expensed
instead of being included in
inventory. The separation of
fixed and variable costs
permits construction of
a “contribution margin”
income statement. Con-
tribution margin equals
sales minus all variable
costs. Focusing on the
contribution margin may
be relevant for short-term
strategic decision making
since fixed overhead does
not change significantly
with changes in short-
term production volume.
More inclusive methods
include full absorption costing
discussed earlier and life-cycle
costing. Life-cycle costing
includes all production-related
costs as well as nonproduction
costs such as sales, administra-
16. tion, R&D, customer service,
and disposal costs. These
“upstream” and “downstream”
costs are part of the overall
value chain and are increasingly
being recognized as costs that
need to be taken into account
when making strategic deci-
sions. In fact, in many firms,
these costs are more signifi-
cant than manufacturing cost.
Ignoring these costs can result
in understated product costs for
strategic decision analysis.
It is important to empha-
size that one product cost defi-
nition cannot meet all costing
needs. For example, for inven-
tory control purposes, a firm
may select throughput costing,
while for pricing decisions the
firm may use a more inclusive
definition. Exhibit 3 provides a
list of typical product cost defi-
nitions along with associated
pros and cons.
Another issue relating to
product cost is how to address
idle capacity cost. Idle capacity
in one period may be a necessary
investment in another period to
meet demand. Including these
costs as part of product costs,
17. however, leads to the risk of a
“downward demand spiral.” This
term refers to decreasing demand
leading to allocating these costs
to fewer products, which leads
to higher cost allocations and
prices, which in turn leads to
further decreased demand, and
so forth. Many firms attempt to
report these idle capacity costs
separately in order to minimize
the impact of short-run capacity
issues on product cost.2
At What Level of Detail Should
We Track Direct Product Costs?
The second important
question to answer is how to
track direct product costs. As
Exhibit 1 illustrates, one end of
the spectrum tracks costs by job
(or product). Job costing is most
appropriate when each job or
product is unique, but it can lead
to unnecessary recordkeeping for
costs that are common to all jobs.
At the other end of the spec-
trum is resource consumption
accounting (RCA), where costs
are tracked at the individual
resource cost center level for a
large number of cost centers
18. (i.e., work areas).3 RCA requires
tracking several cost categories
for each cost center, separating
fixed and variable costs, and
developing a cost rate for the
variable costs that can be used
to charge costs to the output. A
flexible budget is devel-
oped for each cost center
based on the actual activ-
ity volume. Fixed and
variable costs continue
to be separated as costs
are rolled up to the final
product cost. This level of
detail allows firms using
RCA to achieve a high
level of cost accuracy and
control. This approach
is appropriate for batch
processing and when cost
assignment drivers are quantifi-
able, but it can be expensive to
implement.
Other methods between the two
extremes include process cost-
ing, operation costing, and value
stream costing. Process costing
tracks costs at the process or
department level and assumes
product uniformity. When
products have certain unique
costs (e.g., different materials)
but essentially go through the
20. individual jobs or processes. On
the down side, it is more chal-
lenging to apply in situations
where common resources are
used to support multiple value
streams.
Exhibit 4 provides a brief
description and list of pros and
cons for different approaches to
tracking direct product costs.
How Do We Organize Indirect
Product Costs?
The question of how to
handle indirect costs is a key
Product Cost Definitions
Definition snoCsorP
Throughput costing
Includes only direct
materials as product
costs
Treats all other costs
as period costs
Consistent with just-
in-time and
discourages
inventory buildup
21. Relatively simple
May lead to strategic
errors (e.g.,
underpricing
products)
Not allowed under
GAAP
Variable costing
Classifies cost by
behavior (e.g.,
variable or fixed)
Treats variable
manufacturing costs
as product costs
Treats all other costs
as period costs
Allows cost-volume-
profit (break-even)
analysis
Consistent with a
contribution margin
approach
Relatively simple
May lead to strategic
errors (e.g.,
underpricing
22. products)
Not allowed under
GAAP
May require extra
training
Full absorption costing
Includes all materials,
labor, and
manufacturing
overhead as product
costs
Treats all other
nonmanufacturing
costs as period costs
Required for GAAP
and IAS
Commonly used and
understood
Does not include
nonmanufacturing
costs
Can motivate
unnecessary
inventory buildup
May treat fixed
production costs as
24. Cost Approach snoCsorP
Job costing (JC)
Each order is
separately costed
Requires separate
record keeping for
each job or product
Best captures the
unique aspects of
each job
Generally most
accurate costing
system
May lead to
unnecessary tracking
for costs that are
common
Expensive
Process costing (PC)
Tracks costs by
department and
computes average cost
for all units for a time
period
Typically the easiest
25. and least costly
method
Works well in
environments where
individual units are
indistinguishable
Does not capture
unique costs
Operation costing (OC)
Tracks unique costs
by order (e.g.,
materials) like JC
Tracks common costs
by department and
computes average cost
across all units
Captures the unique
costs of each job
Cost-effective for
costs that are
common for each job
or unit
Less accurate than
JC for costs that differ
by job
More effort required
than PC
26. Value stream costing
Tracks revenues and
costs by value stream
Shows sustaining
costs separate from
value stream costs
(minimizes arbitrary
allocations)
Supports Lean
manufacturing
philosophy
Simplifies the
accounting process
Saves time by not
having to track costs
for individual jobs or
processes
Less cost control over
individual processes
Not as effective when
company uses
common resources
Resource consumption
accounting (RCA)
Models how resources
are used by outputs
27. Separates costs into
variable and fixed
elements for a large
number of cost
centers
Uses flexible
budgeting at the cost
center level
Responsibility for
costs lies with cost
center managers
(strong cost control)
Highly accurate
product cost
information for short-
term decisions
Typically requires
expensive ERP
system
Very detailed—can be
difficult to understand
Typically most
complex method
Exhibit 4
The Journal of Corporate Accounting & Finance / May/June
29. of setups to allocate setup
costs. Intensity drivers
are more complex since
they seek to measure the
actual resources used by
an activity.6 For instance, some
products may be particularly
difficult to set up because they
require specially trained workers
and quality control personnel.
Instead of treating all setup
hours alike, hours requiring dif-
ferent human resources would
be tracked separately. Use of
intensity drivers typically results
in more accurate product costs
but is expensive to implement.
TAKING ACTION
Developing the right prod-
uct costing system is not an easy
or trivial process. In order to
find the right fit, first assess your
the capacity cost rate, TDABC
allows the firm to compute the
cost of unused capacity. One
downside of TDABC is the
need to estimate the time to
carry out each type of transac-
tion and the assumption of
constant time requirements. In
addition, resource costs that are
not correlated with time (e.g.,
30. level of complexity, space, etc.)
may be handled more easily by
conventional ABC methods.
The most complex method
to organize indirect costs is to
use detailed cost centers. Often
used with RCA, this method
tracks costs at the individual
cost center (i.e., work area) level
by various categories (e.g., vari-
able vs. fixed, supplies, labor,
etc.). These costs are “direct” to
the cost center and then charged
to the product using the variable
cost rate. Tracking these costs at
this disaggregated level allows
for greater accuracy but at the
expense of higher implementa-
tion and maintenance costs.
How Do We Allocate Indirect
Costs to Products?
Closely related to deciding
how to track indirect costs is
choosing the most appropriate
basis for allocating these costs to
the product. The goal is to find
the best “cost driver” for each
cost pool that approximates the
challenge for product cost-
ing. By definition, these costs
cannot be easily traced to the
31. product (or cost object). Exhibit
1 illustrates a continuum of
methods to track indirect costs
from simple to more complex
methods (see Exhibit 5 for a
list of pros and cons for each
method). Historically, most
businesses have chosen plant-
wide or department-based accu-
mulation approaches in which
overhead costs are accumulated
into either a single cost pool or
department-based cost pools.
Departmental cost pools are
commonly used with operation
and process costing methods.
Although simple plantwide
or department-based cost pools
are used extensively, prior
research suggests that
these approaches can lead
to highly distorted product
costs due to the inclusion
of only one cost driver. To
address this issue, activity-
based costing (ABC)
organizes indirect costs
by activity and can result
in more accurate prod-
uct costs. ABC, however,
has been criticized due to
inherent complexity. Chal-
lenges include the difficulty in
collecting activity data, alloca-
tion challenges, and high imple-
33. All indirect costs are
accumulated into a
single cost pool
Simplest method
Works well if all
products consume
indirect costs at the
same rate
Generally least
accurate assignment
Can lead to highly
distorted costs since
all indirect costs
assumed to be driven
by one driver
Departmental cost pools
Indirect costs are
accumulated into a
separate cost pool for
each department
Simple method
Recognizes
differences in
overhead costs
among departments
Generally more
34. accurate than
plantwide method
Often not very
accurate assignment
of overhead costs to
products
Activity-based costing (ABC)
Assigns indirect
(overhead) costs to
activity cost pools
Next assigns activity
costs to cost objects
using appropriate cost
drivers and rates
Generally most
accurate assignment
of overhead costs to
products
Can use cost drivers
and activity cost
rates to help manage
business
Needs to use JC, PC,
or OC to account for
direct costs
Complex to set up
and maintain
35. Time-driven ABC
Indirect costs are
accumulated into a
separate cost pool for
each department
Uses time as the cost
driver for all resources
within a given
department
Multiplies single cost
rate by the time
Takes less time and
effort than ABC
(does not require
accumulating costs
by activity or tracking
various cost driver
data)
Allows the firm to
compute the cost of
unused capacity
Must estimate time to
carry out each type of
transaction
Not as accurate for
resource costs that
are not driven by time
(e.g., complexity,
space)
36. required for each type
of transaction
Detailed cost centers
Indirect costs tracked
at the individual cost
center (work area)
level
Costs tracked by
category (e.g.,
variable vs. fixed,
supplies, labor, etc.)
Costs are charged to
the output using a
variable cost rate for
each cost center
Cost center manager
has responsibility for
indirect costs
Higher granularity
and accuracy than
other cost
approaches
Typically requires
expensive ERP
system
Very detailed—can be
difficult to understand
38. and ABC on the road to RCA. Strate-
gic Finance, 88(5), 33–39.
4. See Pryor, T. (2010, January/February).
A financial thermometer for lean oper-
ations. Journal of Corporate Accounting
& Finance, 21(2), 81–91; and Kennedy,
F., & Brewer, P. (2005). Lean account-
ing: What’s it all about? Strategic
Finance, 87(5), 27–34.
5. Kaplan, R., & Anderson, S. (2007).
The innovation of time-driven activity-
based costing. Cost Management,
pp. 5–15. See also Öker, F., & Adigü-
zel, H. (2010). Time-driven activity-
based costing: An implementation in
a manufacturing company. Journal
of Corporate Accounting & Finance,
22(1), 75–92.
6. For a more complete discussion of dif-
ferent types of cost drivers, see Kaplan,
R., & Cooper, R. (1998). Cost and
effect: Using integrated cost systems
to drive profitability and performance.
Boston, MA: Harvard Business School
Press; pp. 95–98.
information was used to help
make the decision. Show how
more accurate or complete
information might have altered
the outcome of the decision. It
is hard to quantify the benefits
of improvements to a costing
39. system, but a firm can often
quantify the benefits for spe-
cific decisions and use them as
examples. In addition, employ-
ees whose measured perfor-
mance is negatively affected by
the new product cost system
may be wary of system change.
Being cognizant of potential
behavioral issues is key in sys-
tem implementation.
Back to Nestlé’s situation,
a careful examination of prod-
uct costing systems resulted
in a major system overhaul.
New information led to major
changes in strategic direc-
tion. For instance, CEO Peter
Brabeck was surprised to dis-
cover that it cost more to make
flavored frozen treats in the
United States than in Europe.
In response, Nestlé retrained
US factory workers to feed the
machines faster, leading to a 33
percent drop in the cost of ice
pops the following year. Nestlé
discovered that good product
management, aided by better
cost systems, can pay major
dividends.
current system based on conve-
nience, correctness, and costs of
implementation. Also look for
40. warning signs that your current
product cost system is flawed.
If the current system seems to
be consistently falling short,
consider the four key ques-
tions and different approaches
available discussed in this
article. Many of the approaches
included in this article fit well
as a costing package. For exam-
ple, typical pairings include:
throughput costing and value
stream costing; department-
based cost pools with process
or operation costing; plantwide
cost pools with volume-based
drivers; ABC with transaction
drivers; TDABC with duration
drivers; and RCA with detailed
cost centers.
Beyond the issues dis-
cussed in this article, product
costing system change can
result in challenging behav-
ioral and political issues.
Even if improvements to the
cost systems are in order,
there is often resistance due
to financial and time con-
straints. To help “sell” a cost
system improvement initia-
tive to upper management,
try identifying some recent
specific strategic or opera-
tional decisions in which cost
41. Joseph G. Fisher is the Harry C. Sauvain Chair of the
Department of Accounting in the Kelley School of
Business at Indiana University in Bloomington, Indiana. Kip
Krumwiede is an associate professor in the
Department of Accounting in the Robins School of Business at
the University of Richmond in Richmond,
Virginia.
Copyright of Journal of Corporate Accounting & Finance
(Wiley) is the property of John
Wiley & Sons, Inc. and its content may not be copied or emailed
to multiple sites or posted to
a listserv without the copyright holder's express written
permission. However, users may
print, download, or email articles for individual use.
Sheet1Nestle SAIn millions(except for data per share and
employees)2013 and 201420132014ResultsSales 92 158 91
6129215891612Trading operating profit 14,04714,019as % of
sales 15.24%15.30%Profit for the period attributable to
shareholders of the parent (Net profit) 1001514456as % of
sales10.87%15.78%Balance sheet and Cash flow
statementEquity attributable to shareholders of the parent
62,57570,130Net financial debt 14,69012,325Ratio of net
financial debt to equity (gearing) 23.48%17.57%Operating cash
flow 14,99214,700as % of net financial debt
102.06%119.27%Free cash flow 10,48614,137Capital
expenditure 4,9283,914as % of sales 5.35%4.27%Data per
shareWeighted average number of shares outstanding (in
millions of units) 3,1913,188Basic earnings per share
3.144.54Dividend as proposed by the Board of Directors of
Nestlé S.A.2.152.20Market capitalisation, end December
42. 31st208,279231,136Number of employees (in thousands)
333339Retrieved from: https://www.nestle.com/asset-
library/documents/library/documents/annual_reports/2014-
annual-report-en.pdfReferring (Fisher & Krumwiede, 2015),
review the above financial information and answer the
following questions1. Did Nestle S.A.'s financial position
improve or decline from 2013 to 2014?2. Give at least three
indications that support your answer in question #1.3. Why do
you think sales decreased from 2013 to 2014 and yet net profit
increased?
As you have learned throughout this course so far, financial
statements play a significant role in all aspects of accounting.
For this assignment, you are to retrieve a journal entry-flow of
production from your current employer. If your employer will
not provide an entry, you may use this sample financial
analysis statement .
After selecting the financial statement(s) to use, you will need
to read the following article:
Fisher, J. G., & Krumwiede, K. (2015). Product costing
systems: Finding the right approach . Journal of Corporate
Accounting & Finance, 26(4), 13-21. Retrieved from
https://libraryresources.columbiasouthern.edu/login?url=http://s
earch.ebscohost.com/login.aspx?direct=true&db=bth&AN=1022
02378&site=ehost-live&scope=site
Once you have read the article, address the following questions
based on both the article and your chart(s):
· analyze your current system using the three dimensions
of convenience,correctness, and costs of implementation;
· correlate your current company’s product cost design abilities
by answering the four key product design questions; and
· employ strategies for how businesses can better present
financial statements for other businesses or financial
institutions.
Your assignment must be at least two pages in length, not
counting the title and references pages. You must have at least
43. two outside sources, which can include the textbook and the
Fisher and Krumwiede article. Remember to use APA style
format throughout all portions of the assignment.