Recommended

Recommended
More Related Content
What's hot
What's hot (19)
Similar to Detention Basin (FINAL DRAFT)
Similar to Detention Basin (FINAL DRAFT) (20)
Detention Basin (FINAL DRAFT)
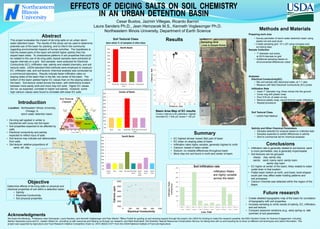
- 1. Cesar Bustos, Jazmin Villegas, Ricardo Barron Laura Sanders Ph.D., Jean Hemzacek M.S., Kenneth Voglesonger Ph.D. Northeastern Illinois University, Department of Earth Science Introduction Location: Northeastern Illinois University, Chicago, IL storm water detention basin • De-icing salt applied in winter is transferred with snow into the basin • Soil properties expected to be affected by salts • Electrical conductivity and salinity expected to reflect input of salts • Soil texture may indicate soil deterioration from salts • Soil texture: relative proportions of sand, silt, clay 0% 5% 10% 15% 20% 25% 30% 35% 40% 45% 50% Sandy Clay Sandy Clay Loam Silt Loam Loamy Sand North Basin 0% 5% 10% 15% 20% 25% 30% 35% 40% 45% 50% Sand Clay Sandy Clay Sandy Clay Loam Loamy Sand Center of Basin 0% 5% 10% 15% 20% 25% 30% 35% 40% 45% 50% Loamy Sand Clay Loam Silt Loam Silty Clay Loam Sandy Clay Loam Sandy Loam Sandy Clay South Basin Results Conclusions • Infiltration rate is generally related to soil texture: sand is more permeable; clay is generally impermeable • Soil textures can be grouped: clayey: clay, sandy clay sandy: sand, loamy sand, sandy loam, sandy clay loam • EC higher at center of the basin; likely related to water outlet drain in that location • Flatter basin bottom at north, and lower, bowl-shaped south part may affect water-holding patterns and soil processes. • Calcium Chloride was detected within the region of the Basin. Acknowledgments We thank the following: Professors Jean Hemzacek, Laura Sanders, and Kenneth Voglesonger and Peer Mentor Tiffany Probst for guiding us and showing support through the project; the USDA for funding to make this research possible; the NEIU Student Center for Science Engagement, including Marilyn Saavedra-Leyva and Dr. Joseph Hibdon for providing us with resources and helping us through our research; and Mark Bramstedt, Soil Scientist, Natural Resources Conservation Service, for taking time with us and traveling far to show us different soil techniques and useful information. This project was supported by Agriculture and Food Research Initiative Competitive Grant no. 2010-38422-21271 from the USDA National Institute of Food and Agriculture. Future research • Create detailed topographic map of the basin for correlation of topography with soil properties. • Increase sampling to verify results of salinity, EC, infiltration, and soil texture. • Compare seasonal variations (e.g., early spring vs. late summer) of soil parameters Basin Area Map of EC results Contour interval is 50 μSiemens; highest recorded EC = 830 μS, lowest = 120 μS Methods and Materials Preparing work area • Survey perimeter of storm water detention basin using stadia rod and auto level. • Create sampling grid: 10′ x 20′ using compass and surveying tape. Sample Collection • 1′′-diameter soil probe, at 20-ft intervals on grid • Additional sampling based on environmental differences noted Analyses Electrical Conductivity(EC) • Mix soil sample with deionized water, at 1:1 ratio • Measure with field Electrical Conductivity (EC) probe Infiltration Rate • Insert 7” diameter ring, three inches into the ground • Cover ring with plastic wrap • Pour 518 mL of water on top • Remove plastic wrap; record time for water infiltration • Repeat procedure Soil Textural Class • USDA Field Method Salinity and Other Chemical Parameters • Samples selected for analysis based on collected data • Samples expected to exhibit differences in salinity • Sent to commercial lab for chemical analyses Summary • EC highest at/near lowest (flat) part of basin • EC lower on sloping sides of basin • Infiltration rates highly variable; generally highest to north • Calcium: lowest in basin center • Sodium: no notable differences throughout basin • More clay-rich soil found in north and center of basin Objective Determine effects of de-icing salts on physical and chemical properties of soil within a detention basin: • Salinity • Electrical Conductivity • Soil physical properties Abstract This project evaluates the impact of de-icing salts on an urban storm water detention basin. The results of this study can be used to determine potential use of the basin for planting, and to inform the community regarding environmental impacts of human activities. The hypothesis is that the lowest parts of the basin will exhibit higher salinity than the sloped basin sides. To characterize patterns in soil properties that could be related to the use of de-icing salts, topsoil samples were extracted at regular intervals on a grid. Soil samples were analyzed for Electrical Conductivity (EC), infiltration rate, salinity and related chemistry, and soil textural class. USDA standard field methods were employed to measure EC, infiltration rate, and soil texture; chemical analysis was conducted by a commercial laboratory. Results indicate faster infiltration rates on sloping sides of the basin than in the flat, low center of the basin. The bottom of the basin yielded higher EC values than on the sloping sides of the basin. Soil texture varied across the basin, with distinctions evident between more sandy soils and more clay-rich soils. Higher EC values did not, as expected, correlate to higher soil salinity. However, some high calcium values were found to correlate with lower EC soils. Soil Textural Class bars show % of samples in that class Sampling Grid Lines & Sample Points 1 2 4 3 5 6 7 8 9 Soil Textural Classes N Distance,feet Distance, feet 0 50 100 150 200 250 300 350 400 Line 1-1 Line 1-2 Line 1-3 Line 2-1 Line 2-2 Line 3-1 Line 3-2 Line 3-3 Line 4-1 Line 4-2 0 Feet 80 Feet 120 Feet 0 Feet 160 Feet 0 Feet 40 Feet 68 Feet 0 Feet 75 Feet Line- Feet Soil Infiltration rate InfiltrationRate, inches/hour Infiltration Rates are highly variable across the basin 1500 2000 2500 3000 3500 4000 0 200 400 600 800 1000 Calcium,ppm Electrical Conductivity