1. OUR BUSINESS
NZ & ASIA PACIFIC
DATA SNAPSHOT
ABOUT YOUR HOSTS - ACENZ MEMBERSHIP
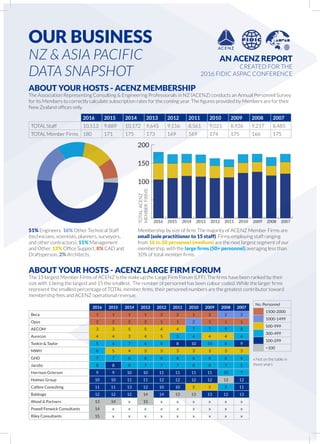
The Association Representing Consulting & Engineering Professionals in NZ (ACENZ) conducts an Annual Personnel Survey
for its Members to correctly calculate subscription rates for the coming year. The figures provided by Members are for their
New Zealand offices only.
2016 2015 2014 2013 2012 2011 2010 2009 2008 2007
TOTAL Staff 10,513 9,889 10,172 9,645 9,116 8,561 9,021 8,926 9,217 8,485
TOTAL Member Firms 180 171 175 173 169 169 174 175 166 175
Background data:
Engineers 51% (255 of 500)
Other Technical personnel - technicians, scientists, planners, surveyors, other contrac-
tors 16% (80 0f 500)
Office Support 12% (60 of 500)
Management and Other 11% (55 of 500)
CAD/Draftsmen 8% (40 of 500)
Architects 2% (10 of 500)
0
50
100
150
200
Small firm (sole practice to 15 employees)
Medium firm (16 to 50)
Large firm (50+)
2016 2015 2014 2013 2012 2011 2010 2009 2008 2007
51% Engineers, 16% Other Technical Staff
(technicians, scientists, planners, surveyors,
and other contractors), 11% Management
and Other, 12% Office Support, 8% CAD and
Draftsperson, 2% Architects.
Membership by size of firm: The majority of ACENZ Member Firms are
small (sole practitioner to 15 staff). Firms employing staff ranging
from 16 to 50 personnel (medium) are the next largest segment of our
membership, with the large firms (50+ personnel) averaging less than
10% of total member firms.
ABOUT YOUR HOSTS - ACENZ LARGE FIRM FORUM
The 15 largest Member Firms of ACENZ is the make up the Large Firm Forum (LFF). The firms have been ranked by their
size with 1 being the largest and 15 the smallest. The number of personnel has been colour coded. While the larger firms
represent the smallest percentage of TOTAL member firms, their personnel numbers are the greatest contributor toward
membership fees and ACENZ operational revenue.
2016 2015 2014 2013 2012 2011 2010 2009 2008 2007
Beca 1 1 1 1 2 2 1 2 2 2
Opus 2 2 2 2 1 1 2 1 1 1
AECOM 3 3 5 5 4 4 7 7 9 8
Aurecon 4 4 3 4 5 5 4 4 4 4
Tonkin & Taylor 5 6 7 6 8 8 10 10 8 9
MWH 6 5 4 3 3 3 3 3 3 3
GHD 7 7 6 8 6 6 6 6 6 6
Jacobs 8 8 8 7 7 7 8 8 7 5
Harrison Grierson 9 9 10 10 11 11 11 11 10 7
Holmes Group 10 10 11 11 12 12 12 12 13 12
Calibre Consulting 11 11 13 12 10 10 5 5 5 11
Babbage 12 12 12 14 14 13 13 13 12 13
Wood & Partners 13 14 x 15 x x x x x x
Powell Fenwick Consultants 14 x x x x x x x x x
Riley Consultants 15 x x x x x x x x x
No. Personnel
1500-2000
1000-1499
500-999
300-499
100-299
<100
x Not on the table in
those years
AN ACENZ REPORT
CREATED FOR THE
2016 FIDIC ASPAC CONFERENCE
TOTALACENZ
MEMBERFIRMS
2. ABOUT NEW ZEALAND - GOVERNMENT
New Zealand has the British monarch as titular Head of State. The Queen is represented in New Zealand by the Governor-
General, appointed by her on the advice of the New Zealand Government. Legislative power is vested in Parliament, a
unicameral body designated the House of Representatives. It currently has 121 members, who are elected for three-year
terms through general elections. The Parliament is the supreme legislative power.
National Labour Green NZ First Maori ACT United Other
2014 60 32 14 11 2 1 1 0
2005 48 50 6 7 4 2 3 1
EXECUTIVE COUNCIL
The executive Government of New Zealand is carried out by the Executive Council. This is a formal body made up of the
Cabinet and the Governor-General, who acts on the Cabinet’s advice. The Cabinet itself consists of the Prime Minister
and his/her Ministers, who must be chosen from among elected Members of Parliament. Each Minister supervises and is
responsible for particular areas of government administration. Collectively, the Cabinet is responsible for all decisions of the
Government.
ABOUT NEW ZEALAND - LIFE AND HISTORY
New Zealand’s population is estimated to increase by one person every 5
minutes and 4 seconds. This is based on the estimated resident population at 31
December 2015 and the following forecasts: one birth every 8 minutes and 59
seconds, one death every 18 minutes and 40 seconds, a net migration gain of one
New Zealand resident every 6 minutes and 22 seconds. The forecasts are based on
recent trends and do not necessarily reflect actual population change.
WEIGHTED AVERAGE RETAIL PRICES OF SELECTED FOOD ITEMS (AT MARCH):
MILK BREAD STEAK APPLE
$3.27 (2009) $1.74 (2009) $23.71 (2009) $2.40 (2009)
$3.54 (2014) $1.80 (2014) $23.83 (2014) $2.31 (2014)
$3.28 (2016) $1.08 (2016) $30.37 (2016) $2.67 (2016)
ETHNIC DIVERSITY NEW ZEALAND PUBLIC HOLIDAYS
4,686,336
NEW ZEALAND
POPULATION
AS OF 8 MAY 2016 AT 7:00 PM
NZ-68%
Maori-14%
Asian 11%
Pacific-7%
2013
NZ-65%
Maori-14%
Asian 13%
Pacific-7%
2018
NZ-68%
Maori-14%
Asian 11%
Pacific-7%
2013
NZ-65%
Maori-14%
Asian 13%
Pacific-7%
2018
JUNE 2013: 68% New Zealander and
European, 14% Maori, 11% Asian, 7% Pacific.
JUNE 2018 (PROJECTION): 65% New
Zealander and European, 14% Maori, 13%
Asian, 7% Pacific.
New Zealand observes ten public holidays nationwide each year. In
addition to these ten days, each region observes one to two additional
days in specific to that region. Example, Wellington Anniversary Day was
celebrated on January 25, 2016 only for those living in the Wellington
region. National public holidays include: New Year’s Day, the day after
New Year’s Day, Waitangi Day, Good Friday, Easter Monday, ANZAC
Day, Queen’s Birthday, Labour Day, Christmas Day, and Boxing Day.
ANZAC DAY was observed to honour the members of the Australian
and New Zealand Army Corps (ANZAC) who fought at Gallipoli (in 1915)
against the Ottoman Empire during World War I. It commemorates all
New Zealanders killed in war and also honours returned servicemen and
women.
QUEEN’S BIRTHDAY is actually on 21 April (1926) but it is celebrated
on various dates across the commonwealth to fit with each country’s
spread of public holidays.
LABOUR DAY commemorates the struggle for an eight-hour working
day. New Zealand workers were among the first in the world to claim
this right when, in 1840, the carpenter Samuel Parnell won an eight-
hour day in Wellington. Labour Day was first celebrated in New Zealand
on 28 October 1890, when several thousand trade union members
and supporters attended parades in the main centres. Government
employees were given the day off to attend the parades and many
businesses closed for at least part of the day.
3. ABOUT NEW ZEALAND & ASIA PACIFIC REGION
The relationship of New Zealand with the Asia Pacific Region is undeniably imperative. In the past, New Zealand’s geographic
isolation and its agricultural economy has attract minimal public interests in international affairs. However, globalisation
has increasingly made New Zealand an important partner in several international economic and social organisations. NZ
is committed to a multi-track trade policy which includes United Nations, World Trade Organization (WTO); World Bank;
International Monetary Fund (IMF); Organisation for Economic Co-operation and Development (OECD); Asia-Pacific
Economic Cooperation (APEC) and more.
Trade is essential to New Zealand’s economic prosperity. It’s a very export-driven competitive economy with exports
accounting for about 30% of GDP. As a member of APEC, NZ is committed to achieving APEC’s goals of free trade and
investment in the region. Asia Pacific regional linkages remain at the core of NZ’s political and economic interests. NZ has
free trade agreements with most Asia Pacific countries including Australia, China, Thailand, Singapore, Malaysia etc.
EXPORT (NZD, $BILLION) IMPORT (NZD, $BILLION)
Top 10 ASPAC Member Countries GDP (in USD $Billions)
China 717.93
Japan 252.81
India 130.56
Australia 94.88
Indonesia 67.30
Korea 49.79
Malaysia 31.26
Vietnam 21.67
Singapore 13.72
Bangladesh 13.10
Australia
(12.87)
China
(11.29)
European
Union (8.6)
USA
(8.38)
Japan
(3.74)
Korea
(2.02)
Singapore
(1.48)
India
(1.42)
Taiwan
(1.27)
Malaysia
(1.14)
European
Union (12.05)
Australia
(11.28)
China
(10.44)
USA
(8.06)
Japan
(3.37)
Singapore
(2.99)
Thailand
(2.28)
Korea
(1.98)
Malaysia
(1.82)
Indonesia
(0.94)
FIDIC ASPAC GLOBAL IMPACT
ASPAC members represent more than 50,000 member
firms from 23 FIDIC Member Associations. The countries
represented by ASPAC have a collective Construction
Industry GDP of over 1.4 trillion USD / year.
TRADE RELATIONSHIPS
New Zealand and the ASPAC countries have a strong
trade relationship which includes the import and export of
commodities and services.
New Zealand’s top exports and top destinations include:
Dairy Products (milk powder, butter, cheese, etc) to China,
Travel Services to Australia, Meat to USA, and Timber
Products (logs, wood, etc) to EU.
New Zealanders rely on the import of many products as
well with top imports and sources including: Electrical
Machinery and Equipment from China and EU, Vehicle
Parts and Accessories from Japan and the EU, and Textiles
from China.
MAIN TRADING PARTNERS 2015
TOTAL Export
69.31
TOTAL Import
66.85
4. NEW ZEALAND LABOUR MARKET
More people are moving to New Zealand from Australia instead of the other
way around as Kiwis return to a buoyant economy armed with the extra edge
of overseas work experience and equipped with international cultural skills in
search of work. According to new figures released by Statistics New Zealand,
in year 2015 there is a net flow of 769 people coming from Australia to New
Zealand and it is the first time New Zealand has seen net inward migration
from Australia since 1991. Kiwis living in Australia may be coming home either
because New Zealand’s labour market was stronger, or possible because there
was often little in the way of social welfare available for foreigners who were
out of work. According to Hay’s NZ Returners Mar 2015 survey findings, two
motivations that drove Kiwis home are family and Culture & Lifestyle. Many
returning Kiwis understand their worth in the global marketplace and the value
of their demand back home. The following data shows the annual salaries of full-
time engineering roles listed on Trade Me Jobs between July–Dec 2015.
ENGINEERING SALARY
INFORMATION (NZD, $Thousands)
Management Jobs
Civil, Structural & Geotechnical Jobs
Drafting Jobs
ENGINEERING IMMIGRATION AND VISAS
ACENZ Member’s greatest issue continues to be staffing and employing qualified professionals to meet the growing work
loads in New Zealand. Our current immigration system is great at providing visas to migrant who have jobs offers in New
Zealand. Since 2015, we have more than five thousand engineers from overseas countries including: China, Great Britain,
United States, India, Philippines, etc coming into New Zealand on Work Visas and Resident Visas. The numbers below
include visa renewal applications.
WORK VISAS RESIDENT VISAS TOTAL
OCCUPATION 2015 Q1 2016 2015 Q1 2016 2015-MAR ‘16
Mechanical Engineer 376 93 73 20 1,031
Mechanical Engineer Draftsperson/Technician 234 63 52 8 654
Engineering Manager/Professionals 225 70 38 19 647
Civil Engineer 152 49 111 29 542
Electrical/Electronics Engineer 184 45 67 15 540
Electrical/Electronics Draftsperson/Technician 161 48 90 23 531
Civil Engineering Draftsperson/Technician 156 56 65 26 515
Aeronautical/Aircraft Maintenance Engineer 137 44 10 1 373
Structural Engineer 113 18 93 11 366
Geotechnical Engineer 46 13 28 4 150
Transport Engineer 54 17 3 1 146
Mining/Petroleum Engineer 36 9 11 5 106
Environmental Engineer 18 4 9 6 59
GRAND TOTAL 1,892 529 650 168 5,660
Low Range Median High Range
150
130
110
90
70
50
30
0
UNEMPLOYMENT RATES
NZ’s unemployment rate at 5.3% is one of the lowest among the OECD countries. The average rate for Q4 2015 is recorded
at 6.562% with the lowest rate in Japan, Korea and Iceland. The graph below shows the New Zealand unemployment rate for
the past few years. It is currently the lowest on record since 2009.
Jan 2014 July 2014 Jan 2015 July 2015 Jan 2016
6.2
6.0
5.8
5.6
5.4
5.2
OECD COUNTRIES
Unemployment Rates at Q4 2015
NEW ZEALAND UNEMPLOYMENT
Unemployment Rates at Q4 2015
Japan
3.2
Iceland
3.5
New
Zealand
5.3
Korea
3.4
OECD
Average
6.5