Maternal Age DS Prevalence Bogotá Cali 2001-2018
•
0 likes•75 views

This study analyzed the association between maternal age and prevalence of Down syndrome (DS) in Bogota and Cali, Colombia from 2001-2018. The results showed that the risk of DS increases with maternal age, especially after age 35. For mothers aged 35 and older, the odds ratio of having a child with DS was 7.18 compared to younger mothers. Additionally, the temporal prevalence of DS for mothers 35 and older remained stable over the period studied, with an average of 51.9 cases of DS per 10,000 births.
Recommended

Recommended
More Related Content
Similar to Maternal Age DS Prevalence Bogotá Cali 2001-2018
Similar to Maternal Age DS Prevalence Bogotá Cali 2001-2018 (20)
More from Catherin Tovar Sanchez
More from Catherin Tovar Sanchez (14)
Recently uploaded
Recently uploaded (20)
Maternal Age DS Prevalence Bogotá Cali 2001-2018
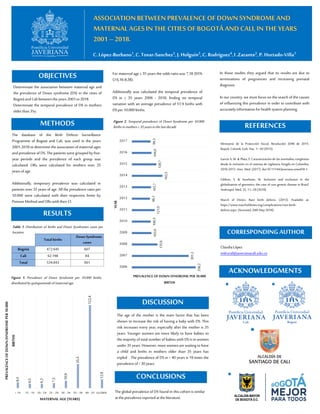
- 1. ASSOCIATION BETWEEN PREVALENCEOF DOWN SYNDROME AND MATERNAL AGES IN THE CITIES OF BOGOTÁ AND CALI, IN THE YEARS 2001 – 2018. C. López-Burbano1,C.Tovar-Sanchez2,J. Holguín3,C. Rodríguez4,I .Zarante2,P. Hurtado-Villa1 OBJECTIVES METHODS RESULTS CONCLUSIONS REFERENCES DISCUSSION Determinate the association between maternal age and the prevalence of Down syndrome (DS) in the cities of Bogotáand Calibetweentheyears 2001 to 2018. Determinate the temporal prevalence of DS in mothers olderthan 35y. The database of the Birth Defects Surveillance Programme of Bogotá and Cali, was used in the years 2001-2018 to determine the association of maternal ages and prevalence of DS. The patients were grouped by five- year periods and the prevalence of each group was calculated. ORs were calculated for mothers over 35 years of age. Additionally, temporary prevalence was calculated in patients over 35 years of age. All the prevalence rates per 10.000 were calculated with their respective limits by PoissonMethodand ORswiththeirCI. The age of the mother is the main factor that has been shown to increase the risk of having a baby with DS. This risk increases every year, especially after the mother is 35 years. Younger women are more likely to have babies so the majority of total number of babies with DS is in women under 35 years. However, more women are waiting to have a child and births in mothers older than 35 years has tripled . The prevalence of DS in > 40 years is 19 times the prevalenceof < 30 years. The global prevalence of DS found in this cohort is similar atthe prevalencereported atthe literature. Ministerio de la Protección Social. Resolución 2048 de 2015. Repub. Colomb. Gob. Nac. 1–18 (2015). García A, M. & Plata, S. Caracterización de las anomalías congénitas desde la inclusión en el sistema de vigilancia Sivigila en Colombia, 2010-2013. Univ. Med. (2017). doi:10.11144/Javeriana.umed58-1. Gibbon, S. & Aureliano, W. Inclusion and exclusion in the globalisation of genomics; the case of rare genetic disease in Brazil. Anthropol. Med. 25, 11–29 (2018). March of Dimes. Rare birth defects. (2013). Available at: https://www.marchofdimes.org/complications/rare-birth- defects.aspx. (Accessed: 20th May 2018). CORRESPONDINGAUTHOR ClaudiaLópez mdrural@javerianacali.edu.co 1 2 4 3 In those studies they argued that its results are due to terminations of pregnancies and increasing prenatal diagnosis. In our country, we must focus on the search of the causes of influencing this prevalence in order to contribute with accuratelyinformationfor healthsystem planning. 8,5 6,5 6,3 7,5 10,9 35,5 122,4 12,9 < 14 15 - 19 20 - 24 25 - 29 30 - 34 35 - 39 40 - 55 GLOBAL PREVALENCEOFDOWNSYNDROMEPER10.000 BIRTHS MATERNAL AGE (YEARS) For maternal age ≥ 35 years the odds ratio was 7,18 (95% CI6,16-8,38). Additionally was calculated the temporal prevalence of DS in ≥ 35 years 2006 - 2018, finding no temporal variation with an average prevalence of 51.9 births with DSper 10.000 births. Total births Down Syndrome cases Bogotá 472.645 607 Cali 62.198 84 Total 534.843 691 Table 1. Distribution of births and Down Syndromes cases per location. Figure 1. Prevalence of Down Syndrome per 10.000 births, distributed byquinquennials ofmaternalage. Figure 2. Temporal prevalence of Down Syndrome per 10.000 births inmothers ≥35yearsinthelastdecade 338,2 301,2 135,6 103,9100,3 121,0 96,1101,7 162,5 129,7 104,099,3 2006 2007 2008 2009 2010 2011 2012 2013 2014 2015 2016 2017 PREVALENCE OF DOWN SYNDROME PER 10.000 BIRTHS YEAR ACKNOWLEDGMENTS